
Market Overview
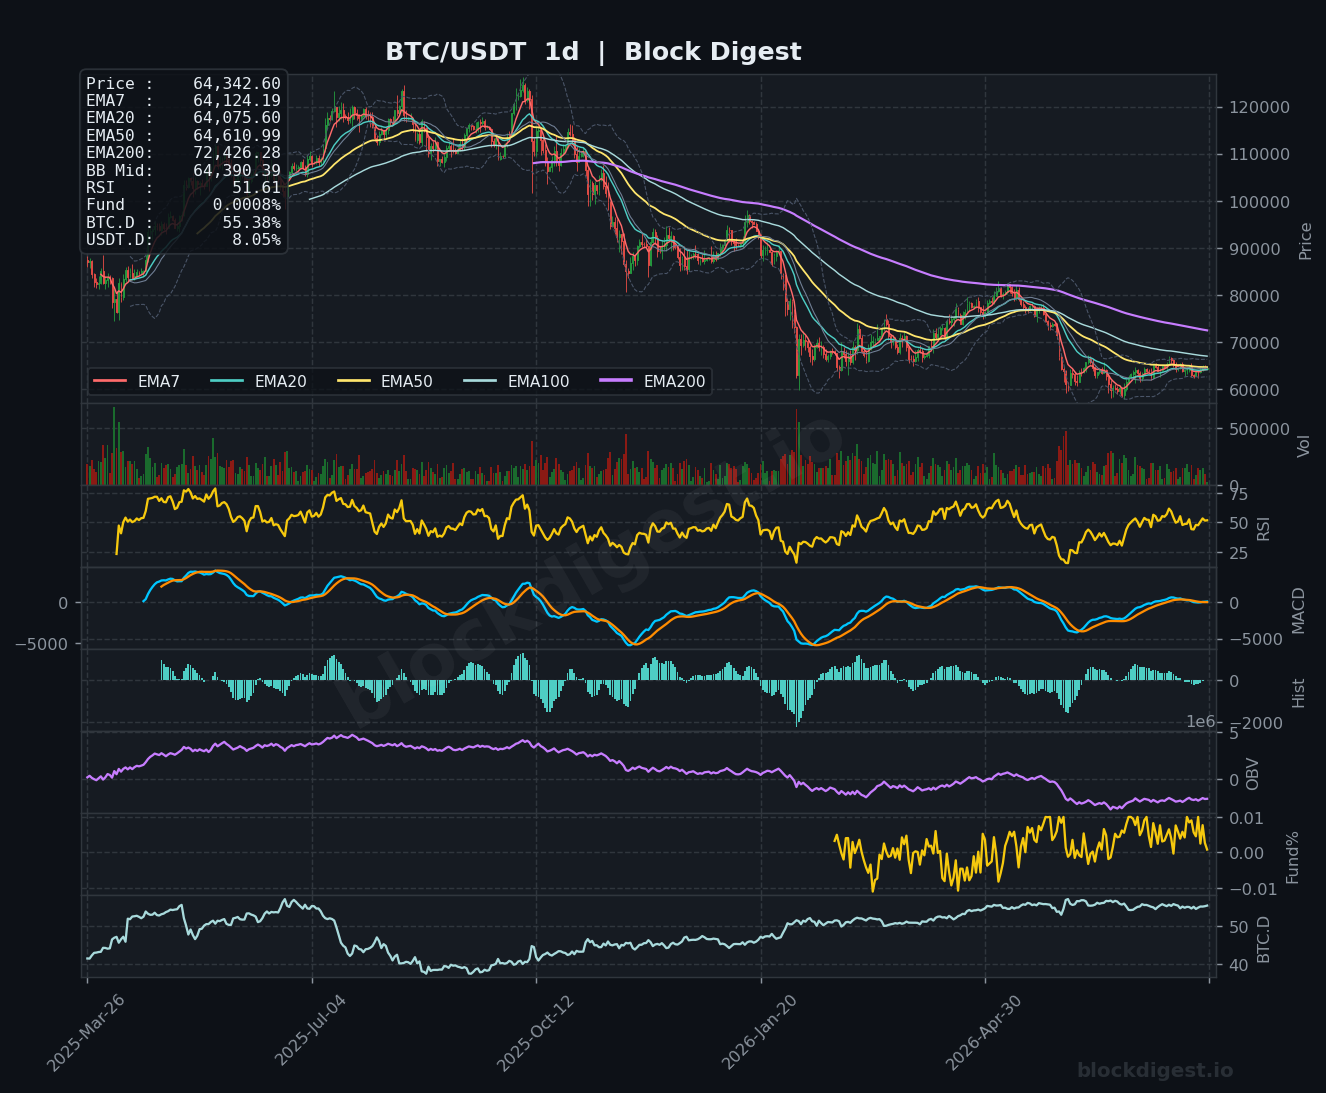
Bitcoin is trading at $64,342.60, caught in a delicate balancing act as price hovers just beneath the daily EMA50 at $64,610.99 and the EMA7 at $64,124.19, with the two effectively sandwiching current price action. The daily timeframe tells a sobering longer-term story: price remains well below the EMA200 at $72,426.28, confirming that the macro trend is still bearish following the prolonged downtrend from the late-2025 highs. That said, the daily Bollinger Band midline sits at $64,390.39 — essentially at current price — indicating BTC is at a genuine inflection point rather than deep in either extreme. The broader structure suggests a market that has stabilized from its earlier lows but has not yet produced the sustained momentum required to flip the trend.
Multi-Timeframe Confluence
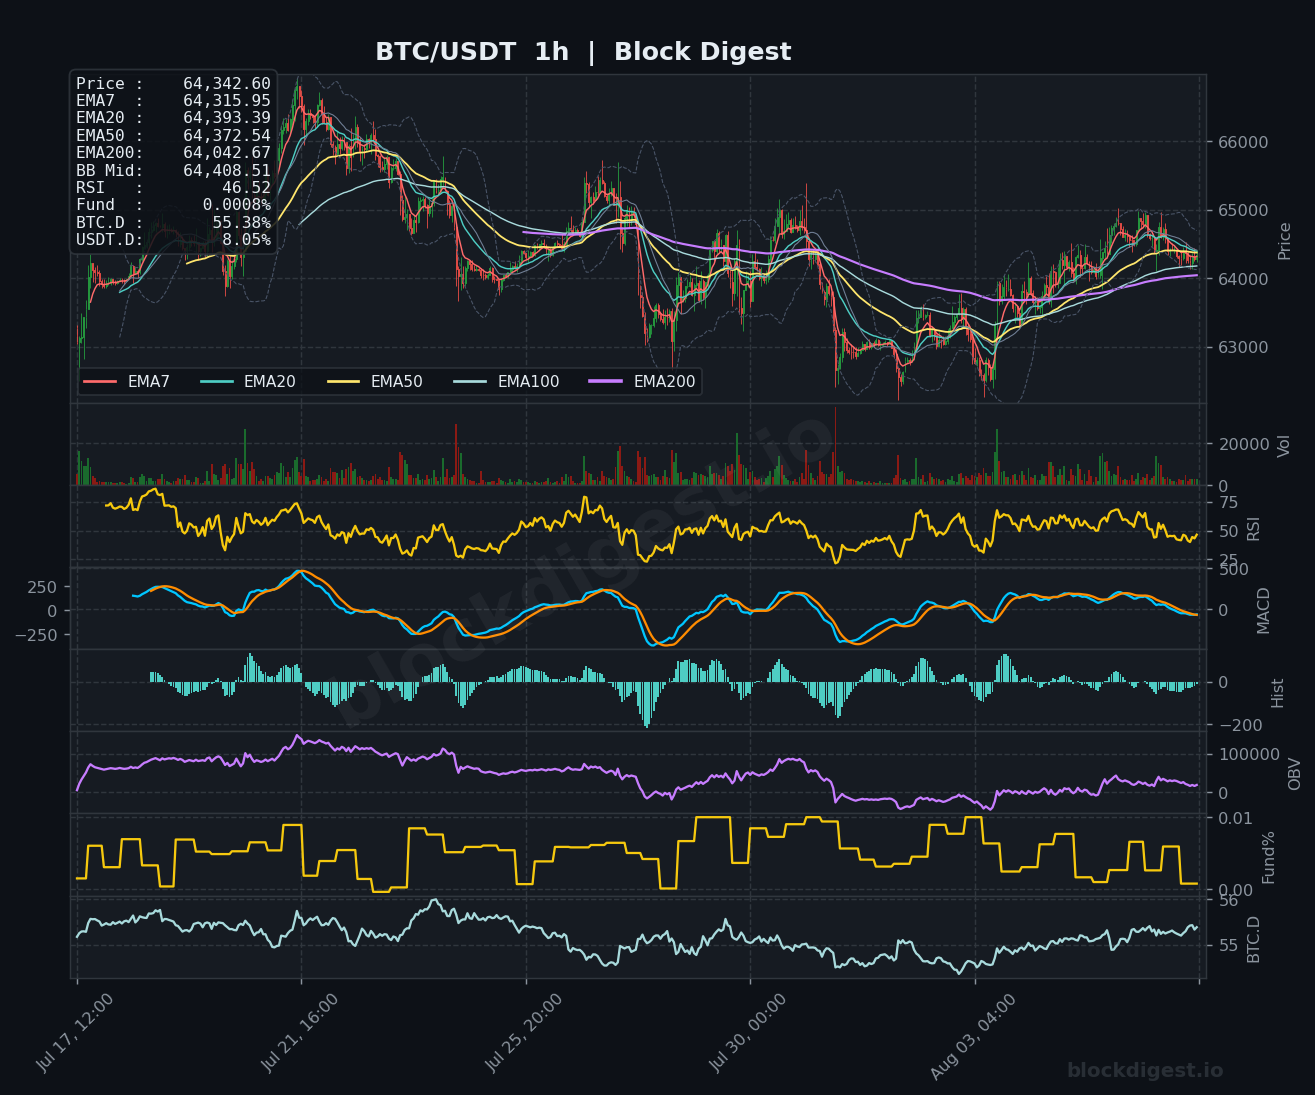
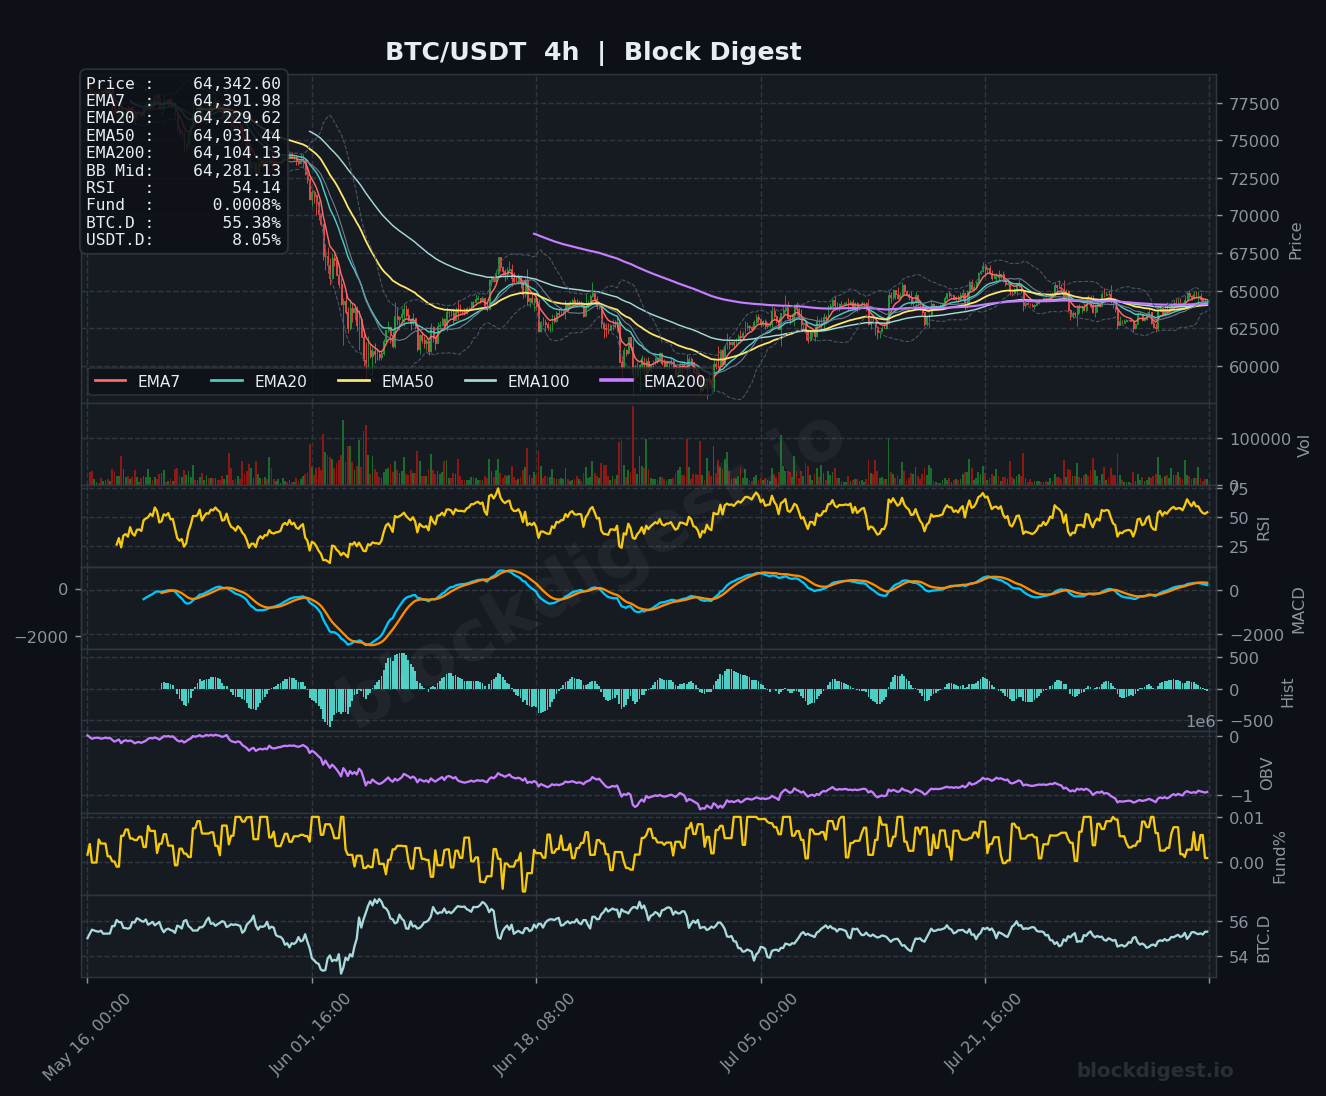
On the 4-hour chart, the shorter-term EMAs (7, 20, 50, and 200) have converged tightly in the $64,031–$64,391 range, reflecting the same indecision visible on the daily. The 4H RSI at 54.14 is marginally constructive, and price has been making a gradual recovery from the early-August lows near $62,500–$63,000 visible on the 4H chart. On the 1-hour chart, however, the picture is slightly more cautious: RSI reads 46.52 and price is trading below the 1H EMA20 ($64,393) and EMA50 ($64,372), suggesting the short-term intraday momentum has stalled after the recent recovery bounce. The key takeaway across all three timeframes is that $64,000–$64,400 is an extraordinarily dense confluence zone — a clean break in either direction is likely to carry conviction.
Key Levels to Watch
- Resistance: $65,000 — psychologically significant round number and near the upper 1H Bollinger Band; the level where recent rally attempts have stalled. $65,500–$66,000 — prior consolidation ceiling visible on the 4H chart and the area where the 4H EMA200 ($64,104) slope projects. $67,500–$68,000 — a broader resistance cluster from the mid-range structure on the daily, and an area AI models and analysts broadly identify as needing reclaim for trend repair.
- Support: $63,800–$64,000 — the 4H EMA50 ($64,031) and EMA200 ($64,104) cluster; losing this zone would signal a fresh deterioration. $62,500–$63,000 — the recent swing low on the 4H chart and a critical demand area that buyers defended aggressively. $61,000–$62,000 — the next meaningful structural support, broadly aligned with analyst projections for a seasonal August bottom in the $58,000–$62,000 range.
Momentum & On-Chain Signals
Block Digest’s BD Pulse score sits at a neutral 49/100, an accurate reflection of a market caught between two narratives rather than trending cleanly in either direction. The daily MACD is constructive at the margin — the signal and MACD lines have crossed into positive territory and the histogram is printing small positive bars — but the overall reading is tepid and lacks the slope needed to confirm a durable recovery. The 4H OBV has been in a persistent downtrend throughout the broader decline, and while it has flattened recently, it is not yet rising in a way that suggests aggressive accumulation. Funding rates remain extremely low at +0.0031%, which is actually a healthy sign — it means the derivatives market is not overleveraged to the long side, reducing the risk of a cascading squeeze lower.
BTC Dominance & Market Sentiment
BTC dominance holds at 55.38%, a level that has been broadly range-bound in recent weeks and indicates that capital rotation into altcoins remains limited — investors are staying closer to the relative safety of Bitcoin in an uncertain macro environment. USDT.D at 8.05% is not at an extreme, suggesting neither a full flight to stablecoins nor a euphoric risk-on surge; it is consistent with the cautious, wait-and-see posture evident across on-chain and derivatives data. The partial reopening of the Strait of Hormuz and a soft ADP jobs print are providing modest macro tailwinds, but the market has yet to translate that sentiment into a decisive directional move.
Risk Scenarios
- Bullish case: A clean 4H close above $65,000 — reclaiming the upper Bollinger Band region and flipping the 1H EMAs to support — would open a path toward $67,500 and potentially the $68,000–$70,000 resistance zone that multiple models flag as the key downtrend breakout level. Continued macro softness reducing Fed rate-hike odds, combined with improving OBV, would add meaningful confirmation.
- Bearish case: A 4H close below $63,800 would break the recent EMA cluster support and likely trigger a retest of the $62,500 swing low; a failure there exposes the $61,000–$62,000 zone and aligns with seasonal weakness patterns that have historically produced August drawdowns averaging around 10%. The BD Pulse at neutral 49 offers no cushion — a deterioration in sentiment could accelerate any move lower.
Outlook
The directional bias here is cautiously neutral with a slight lean toward upside resolution, provided the $63,800–$64,000 floor holds — but conviction is low given the dense EMA confluence and the daily chart’s entrenched macro downtrend. The next 24–48 hours hinge critically on whether BTC can engineer a sustained 4H close above $65,000; failure to do so risks the market drifting back toward the $62,500 low as August seasonal headwinds persist. The macro backdrop — softer employment data and Hormuz negotiations — is mildly supportive, but traders should respect that these tailwinds are already partially priced in at current levels. Watch the $64,000 support and $65,000 resistance as the binary triggers: whichever gives way first with volume confirmation is likely to define the next meaningful swing.
—
Disclaimer: This analysis is for informational purposes only and does not constitute financial advice. Cryptocurrency markets are highly volatile and unpredictable. All trading decisions should be made based on your own research and risk tolerance. Block Digest is not responsible for any financial losses incurred as a result of acting on this content.
Stay Ahead of the Market
Follow BlockDigest for crypto market intelligence, research and real-time updates.


