
Market Overview
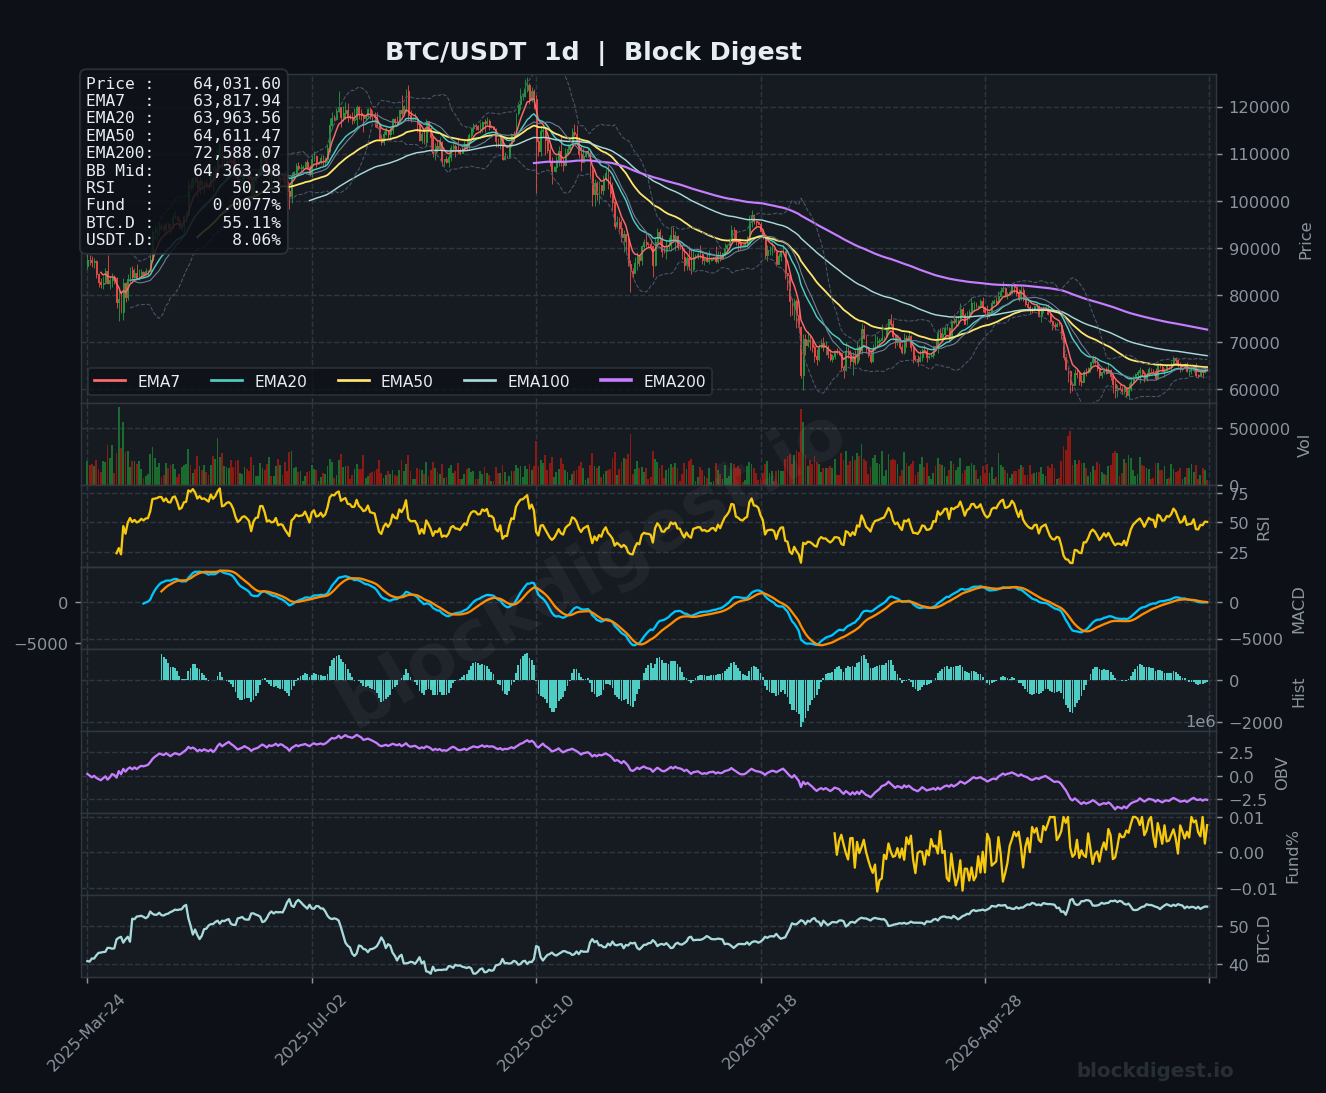
Bitcoin is trading at $64,031.60, consolidating in a narrow range after a prolonged downtrend from the $110,000+ highs seen earlier in the cycle. On the daily timeframe, price is sitting just below the EMA50 ($64,611) and EMA20 ($63,963), with both acting as immediate dynamic resistance and support respectively. Notably, the daily EMA200 remains far overhead at $72,588, underscoring the magnitude of the longer-term correction still in play. Price is hovering near the Bollinger Band midline ($64,363), reflecting a market in compression mode without a definitive directional bias.
Multi-Timeframe Confluence
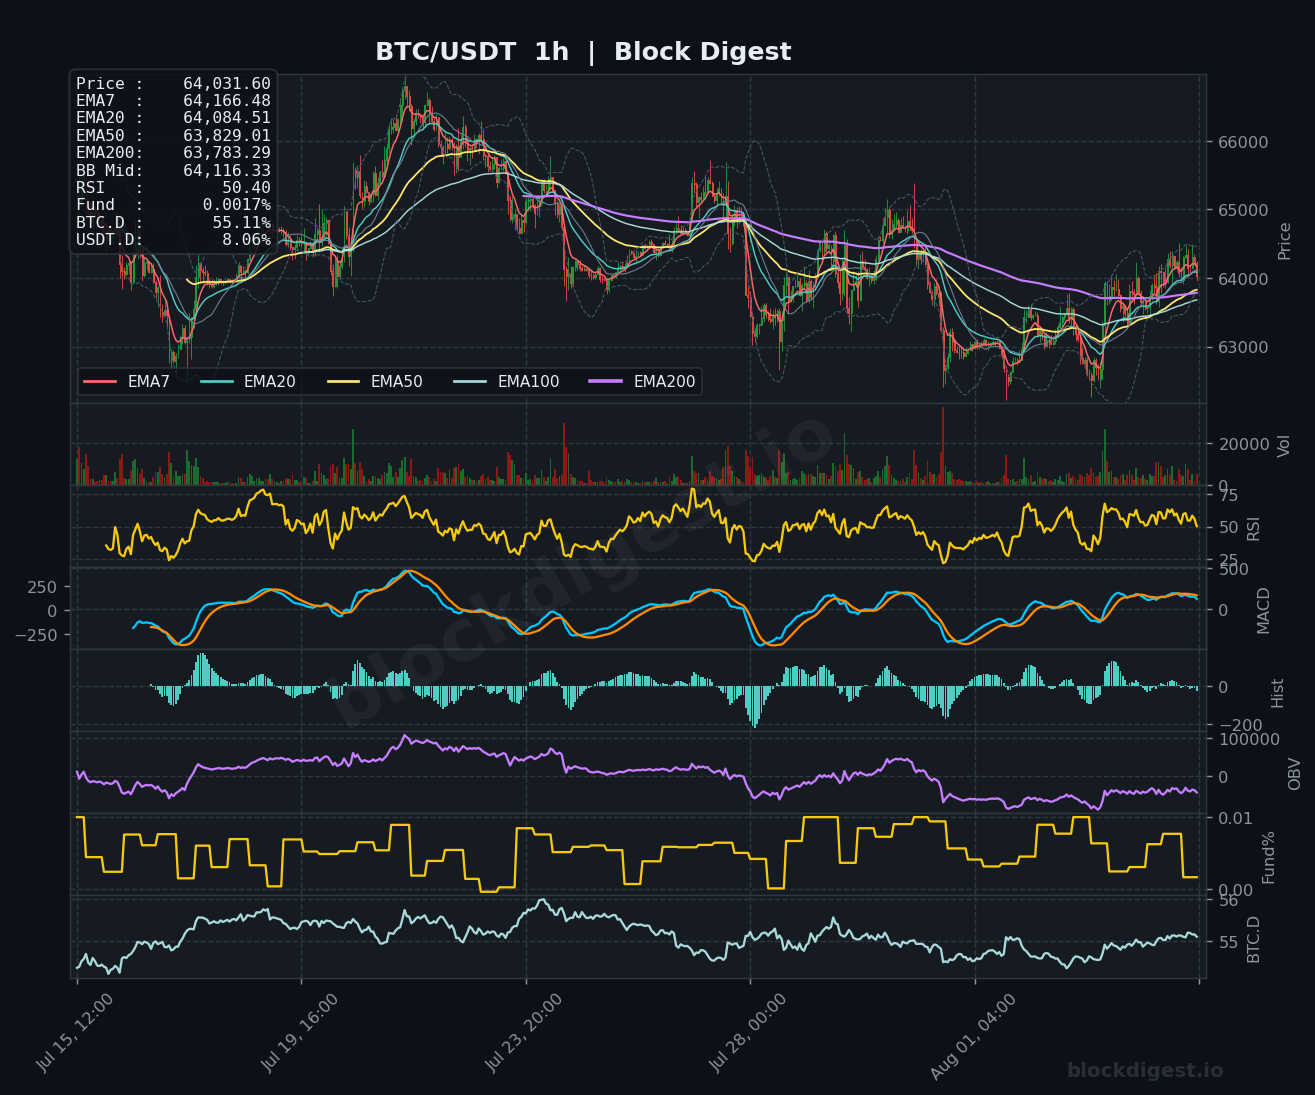
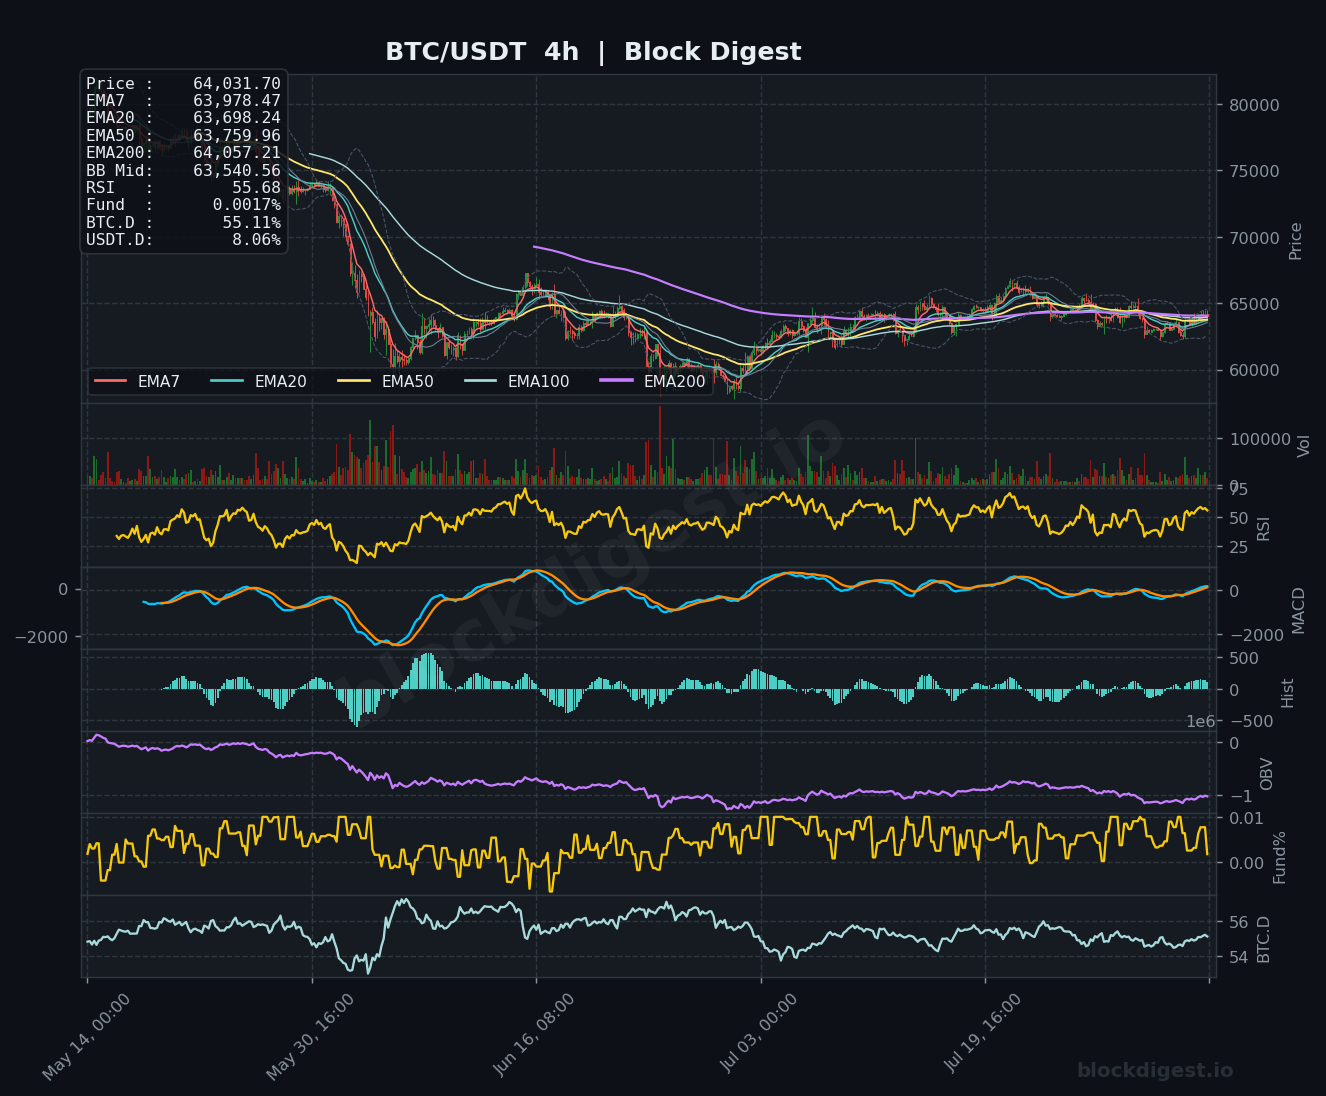
On the 1-hour chart, price at $64,031 sits fractionally below the EMA7 ($64,166) and EMA20 ($64,084), indicating micro-level indecision with the short-term trend slightly tilted bearish. The 4-hour chart paints a more constructive picture — price has recovered above the EMA7 ($63,978), EMA20 ($63,698), and EMA50 ($63,759), with all three now stacked in a mild bullish alignment beneath current price. However, the daily chart’s EMA50 at $64,611 represents the most meaningful overhead obstacle across all three timeframes, and a clean daily close above it would represent genuine multi-timeframe alignment. Until that happens, the short-term recovery from the recent $62,000–$63,000 lows remains a counter-trend bounce within a larger bearish structure.
Key Levels to Watch
- Resistance: $64,611 — Daily EMA50, the most significant near-term dynamic resistance; a sustained break here opens the door to further recovery
- Resistance: $65,000–$65,200 — Psychological round number and the upper boundary of the recent consolidation range visible on the 4-hour chart
- Resistance: $66,000–$66,500 — Prior swing high cluster from the 4-hour timeframe where price previously rejected sharply
- Support: $63,540 — 4-hour Bollinger Band midline, first meaningful intraday support on a pullback
- Support: $63,000–$63,200 — Recent demand zone where buyers stepped in during the latest leg lower; loss of this level would be technically significant
- Support: $61,500–$62,000 — Deeper support zone corresponding to the recent swing lows; a retest here would test broader market conviction
Momentum & On-Chain Signals
Our BD Pulse Score currently sits at 44/100, firmly in bearish territory, which aligns with what the charts are showing — a market that is stabilizing but not yet showing enough strength to be classified as a genuine recovery. The daily RSI at 50.23 is sitting almost exactly at the neutral midpoint, corroborating the lack of directional conviction, while the 4-hour RSI at 55.68 is slightly more encouraging, suggesting moderate upside momentum in the shorter term. The 4-hour MACD lines are converging near the zero level with a marginally positive histogram, hinting at a potential mild bullish crossover, but the daily MACD remains in negative territory with slow-building histogram bars that are not yet convincingly turning green. The BD Pulse OBV trend reading of +1 suggests marginal accumulation pressure, though the daily OBV chart has been declining steadily for months — a reminder that any near-term buying has not yet reversed the broader distribution cycle.
BTC Dominance & Market Sentiment
BTC dominance is holding at 55.11%, a relatively elevated level that reflects continued capital concentration in Bitcoin rather than broad altcoin rotation. USDT.D at 8.06% remains elevated, signaling that a meaningful portion of the market remains in cash or stablecoins — risk appetite is cautious rather than aggressive. This backdrop is somewhat supportive for BTC on a relative basis, as capital tends to flow into Bitcoin first before rotating into alts, but it also signals that the broader market has not yet committed to a new risk-on cycle.
Risk Scenarios
- Bullish case: A decisive 4-hour close above $64,611 (daily EMA50), confirmed by improving volume and the daily MACD histogram turning positive, would open a path toward $65,200 and eventually the $66,000–$66,500 resistance cluster. Continued strength in traditional equities, as seen with MSCI world index performance, could provide an additional macro tailwind for this scenario.
- Bearish case: Failure to reclaim and hold $64,000 on the 1-hour timeframe, followed by a breakdown below $63,200, would likely trigger a retest of the $61,500–$62,000 support zone. A BD Pulse Score deteriorating further below 40 combined with a weakening OBV trend would add conviction to the downside case.
Outlook
Bitcoin is at a technical inflection point, trading in a compressed range around $64,000 with the critical daily EMA50 at $64,611 serving as the immediate line in the sand. The BD Pulse Score of 44 and a neutral RSI near 50 both argue against high-conviction directional trades in either direction right now. The key trigger to watch over the next 24–48 hours is whether BTC can generate a clean daily close above $64,611 — a failure here risks a drift back toward $63,000 and below. Until the daily EMA structure begins to slope upward and price can establish itself above the EMA50, the prevailing structural bias remains cautiously bearish with a recovering undertone.
—
Disclaimer: This analysis is for informational purposes only and does not constitute financial advice. Cryptocurrency markets are highly volatile and unpredictable. All trading decisions should be made based on your own research and risk tolerance. Block Digest is not responsible for any financial losses incurred as a result of acting on this content.
Stay Ahead of the Market
Follow BlockDigest for crypto market intelligence, research and real-time updates.


