
Market Overview
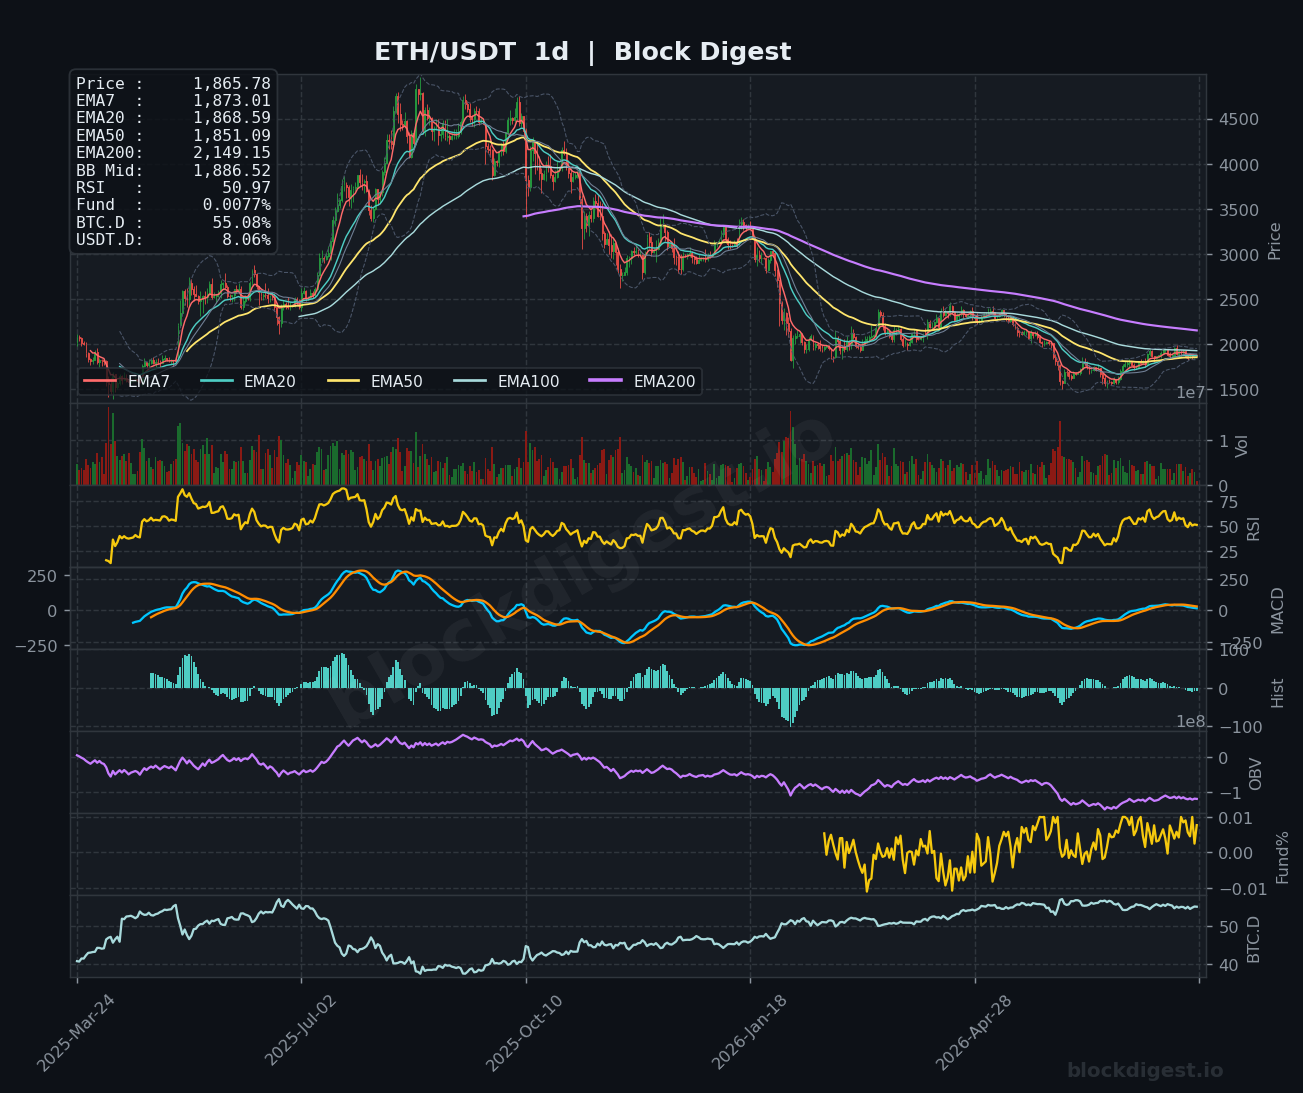
Ethereum is trading at approximately $1,866 as of August 5, 2026, sitting in a technically precarious position just beneath a cluster of short-term EMAs on the daily chart. Price is currently below the EMA7 ($1,873) and EMA20 ($1,868) on the daily timeframe, while maintaining a tenuous hold above the EMA50 ($1,851) — a level that has acted as a key dynamic support in recent weeks. The daily Bollinger Band midline sits at $1,886, placing ETH below its mean-reversion anchor and reinforcing a mild bearish bias in the near term. The dominant macro structure on the daily chart remains a prolonged downtrend from the 2025 highs, with the EMA200 at $2,149 acting as a distant but formidable overhead barrier.
Multi-Timeframe Confluence
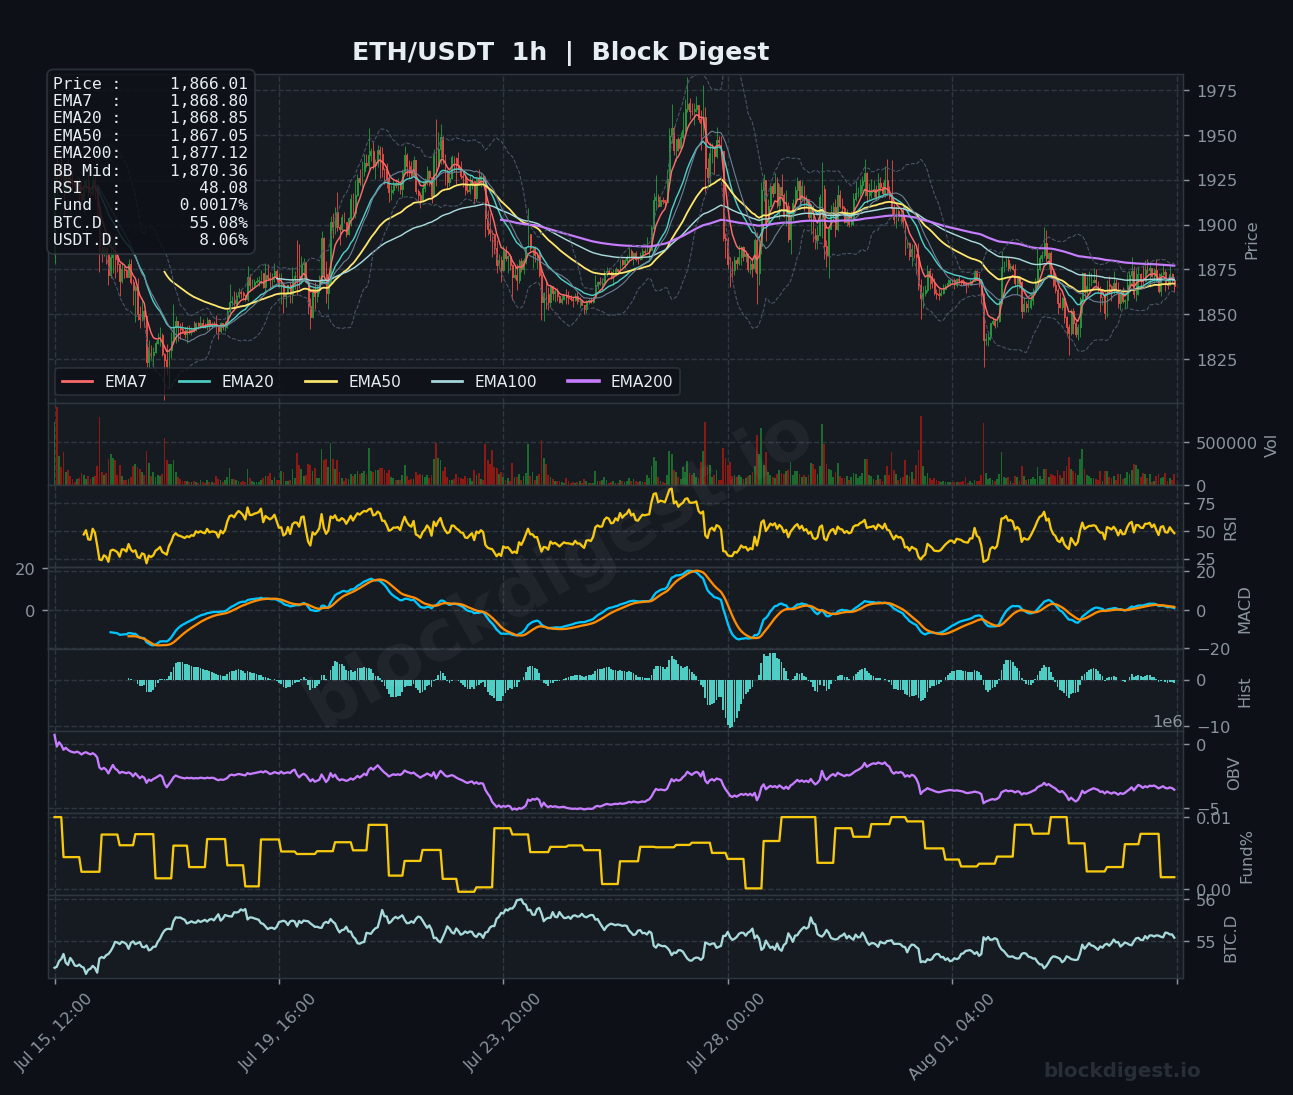
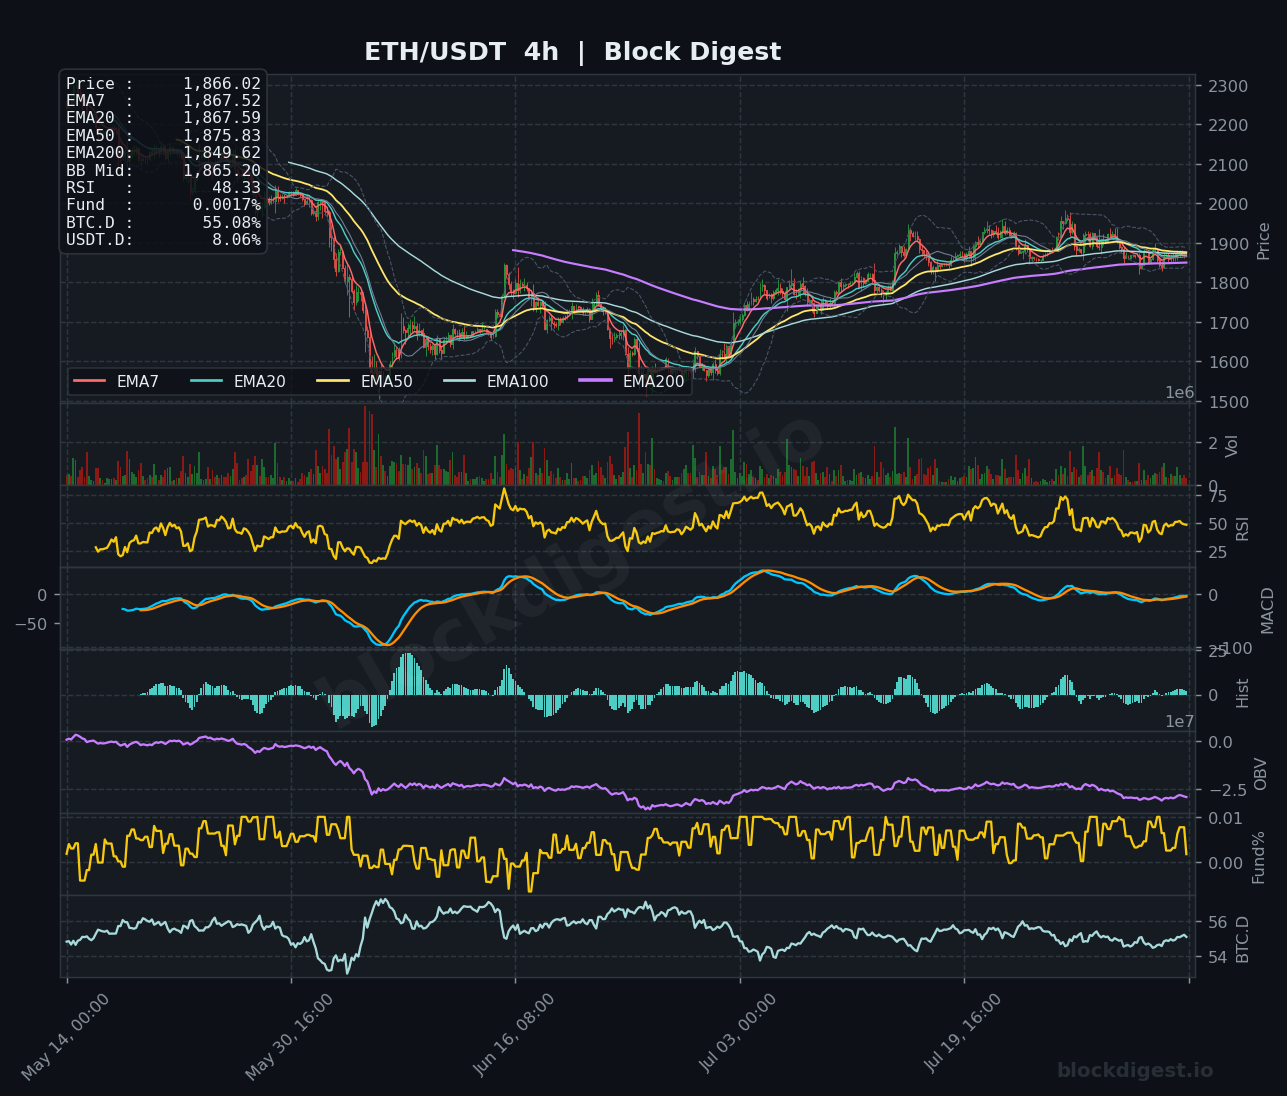
On the 4-hour chart, the EMA7 ($1,867) and EMA20 ($1,867) have converged nearly perfectly with price, signaling indecision and a lack of directional conviction at current levels. The 4H EMA50 at $1,875 aligns closely with the 1H EMA200 at $1,877, creating a well-defined resistance cluster in the $1,875–$1,880 range that has capped recent recovery attempts. On the 1-hour chart, price is trading just beneath all short-term EMAs in a tight range, consistent with the higher-timeframe picture of consolidation without a clear catalyst. Short-term momentum does not yet confirm a bullish reversal, keeping the bias tilted toward the downside until a decisive close above the $1,880 zone is achieved.
Key Levels to Watch
- Resistance: $1,875–$1,880 — Convergence of the 4H EMA50, 1H EMA200, and recent intraday highs; this zone has consistently rejected buyers over the past several sessions.
- Resistance: $1,900–$1,910 — Former support turned resistance and the upper Bollinger Band on the 4H chart; a reclaim here would meaningfully shift short-term structure.
- Resistance: $1,950–$1,960 — The daily Bollinger Band upper boundary and a significant prior consolidation range; recovering this level would challenge the prevailing downtrend.
- Support: $1,851 — Daily EMA50; a critical dynamic floor that, if lost on a daily close, would expose significantly lower levels.
- Support: $1,830–$1,835 — Prior swing lows visible on both the 4H and 1H charts; this area represents the last meaningful demand zone before open air below $1,800.
- Support: $1,790–$1,800 — Psychological support and the lower Bollinger Band on the daily chart; a breach here would mark a structural breakdown.
Momentum & On-Chain Signals
The RSI across timeframes is clustered near the neutral 50 line — the 1H reads 48.08, the 4H shows 48.33, and the daily sits at 50.97 — reflecting a market in equilibrium without clear directional momentum. Our BD Pulse Score of 44/100 corroborates this lean toward bearish pressure, and with the BD Pulse RSI at 50.03, bulls have not yet demonstrated the follow-through needed to reclaim trend leadership. MACD on the 4H timeframe shows the signal and MACD lines hugging near zero with a marginally negative histogram, indicating stalling momentum rather than an impending reversal. The OBV trend on the 1H chart has been declining from its recent peak, suggesting quiet distribution rather than accumulation at these levels — a cautionary signal for those anticipating a near-term bounce.
BTC Dominance & Market Sentiment
BTC dominance holds at 55.11%, a level that continues to suppress altcoin outperformance broadly, and ETH is feeling the weight of this dynamic directly. USDT.D at 8.06% is not at extreme levels, suggesting the market hasn’t entered full-scale risk-off mode, but neither is there a strong rotation of stablecoin capital into ETH. Until BTC dominance shows a meaningful pullback, ETH is likely to remain range-bound or face continued relative underperformance.
Risk Scenarios
- Bullish case: A sustained hourly close above $1,880 — clearing the EMA cluster and 4H EMA50 — would open a path toward $1,900–$1,910, with confirmation of broader recovery if volume expands on the move. The stalling of Clarity Act concerns and continued institutional accumulation (such as BitMine’s ongoing ETH buying) could provide the fundamental catalyst needed to ignite that push.
- Bearish case: A daily close below the EMA50 at $1,851 would be a significant technical breakdown, likely accelerating toward the $1,830–$1,835 support cluster. Failure there would expose the $1,790–$1,800 zone, particularly if BTC dominance continues to climb or broader macro sentiment deteriorates.
Outlook
ETH is at a decision point, consolidating beneath a dense resistance band between $1,875 and $1,880 while resting on daily EMA50 support at $1,851 — a narrow range that will likely resolve with conviction over the next 24–48 hours. The weight of evidence tilts modestly bearish: multiple timeframes show RSI below or barely at 50, OBV is trending down on shorter timeframes, and the BD Pulse Score at 44 reinforces a lack of bullish momentum. The key trigger to watch is a clean break and hold above $1,880 on meaningful volume, which would invalidate the near-term bearish lean; conversely, any daily close beneath $1,851 shifts the probability toward a retest of the $1,830s. Until a clearer catalyst emerges — whether from Clarity Act progress, a shift in BTC dominance, or a pickup in on-chain demand — the prudent read is cautious neutrality with a slight downside tilt.
—
Disclaimer: This analysis is for informational purposes only and does not constitute financial advice. Cryptocurrency markets are highly volatile and unpredictable. All trading decisions should be made based on your own research and risk tolerance. Block Digest is not responsible for any financial losses incurred as a result of acting on this content.
Stay Ahead of the Market
Follow BlockDigest for crypto market intelligence, research and real-time updates.


