
Market Overview
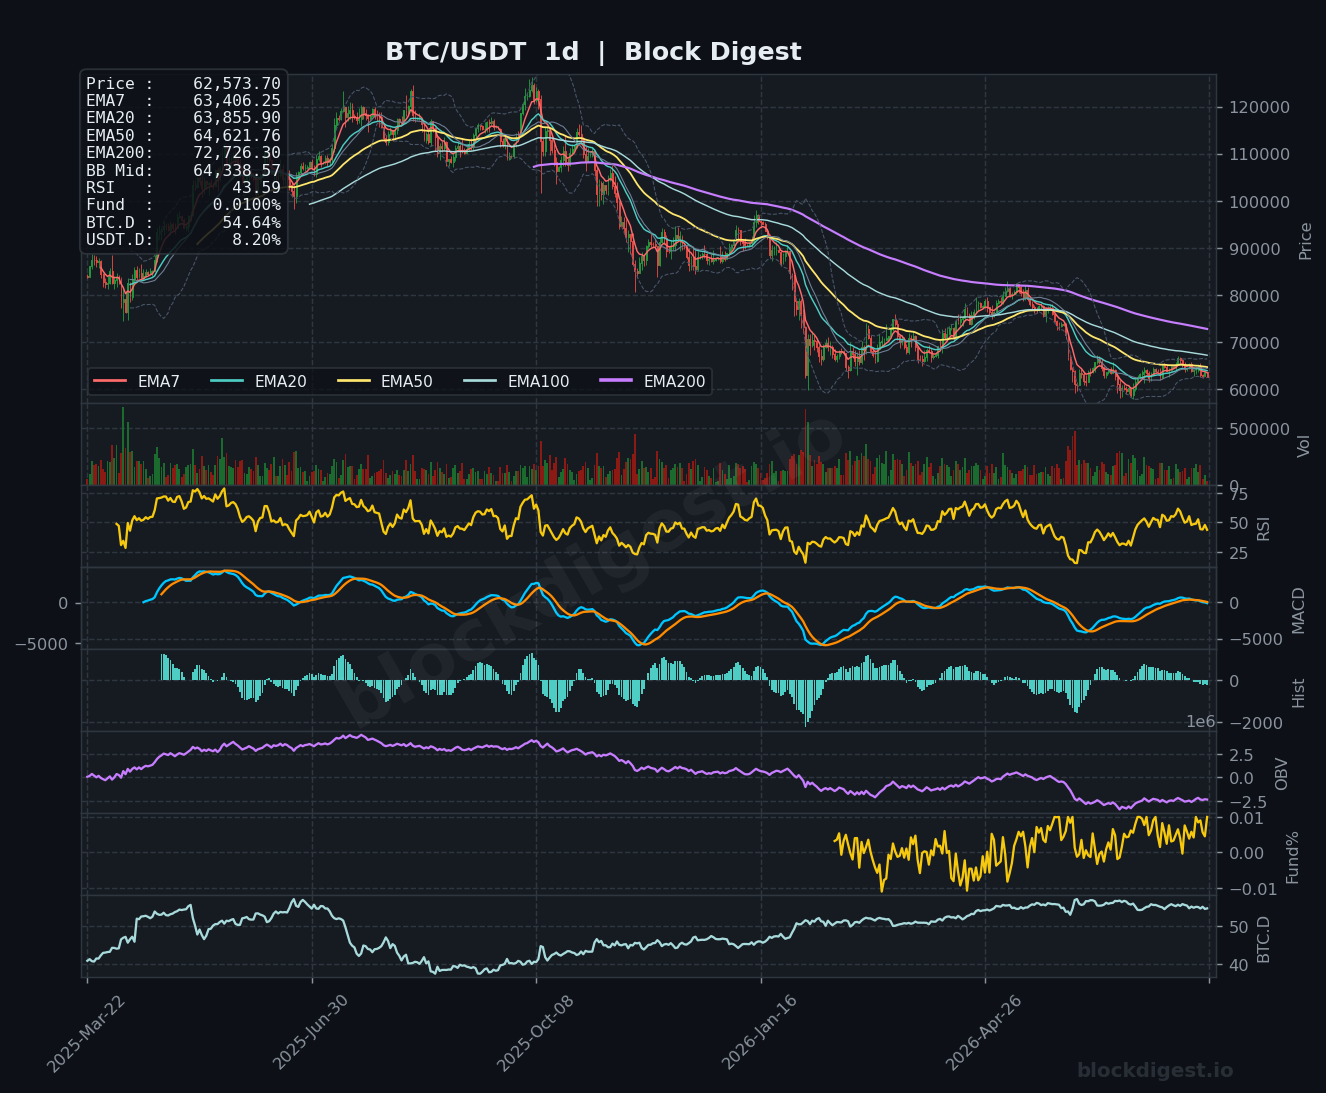
Bitcoin is trading at $62,573 as of August 3, 2026, situated beneath a stacked bearish EMA formation across all major timeframes. On the daily chart, price sits well below the EMA7 ($63,406), EMA20 ($63,856), EMA50 ($64,622), and a sharply declining EMA200 at $72,726 — a configuration that underscores the dominant downtrend that has been in effect since last cycle’s highs. Price is currently hugging the lower Bollinger Band on the daily (BB Mid: $64,339), signaling sustained selling pressure with no immediate mean-reversion catalyst visible. The recent weekly range of $62,240–$65,559 reflects choppy, indecisive action rather than a clean trend reversal attempt.
Multi-Timeframe Confluence
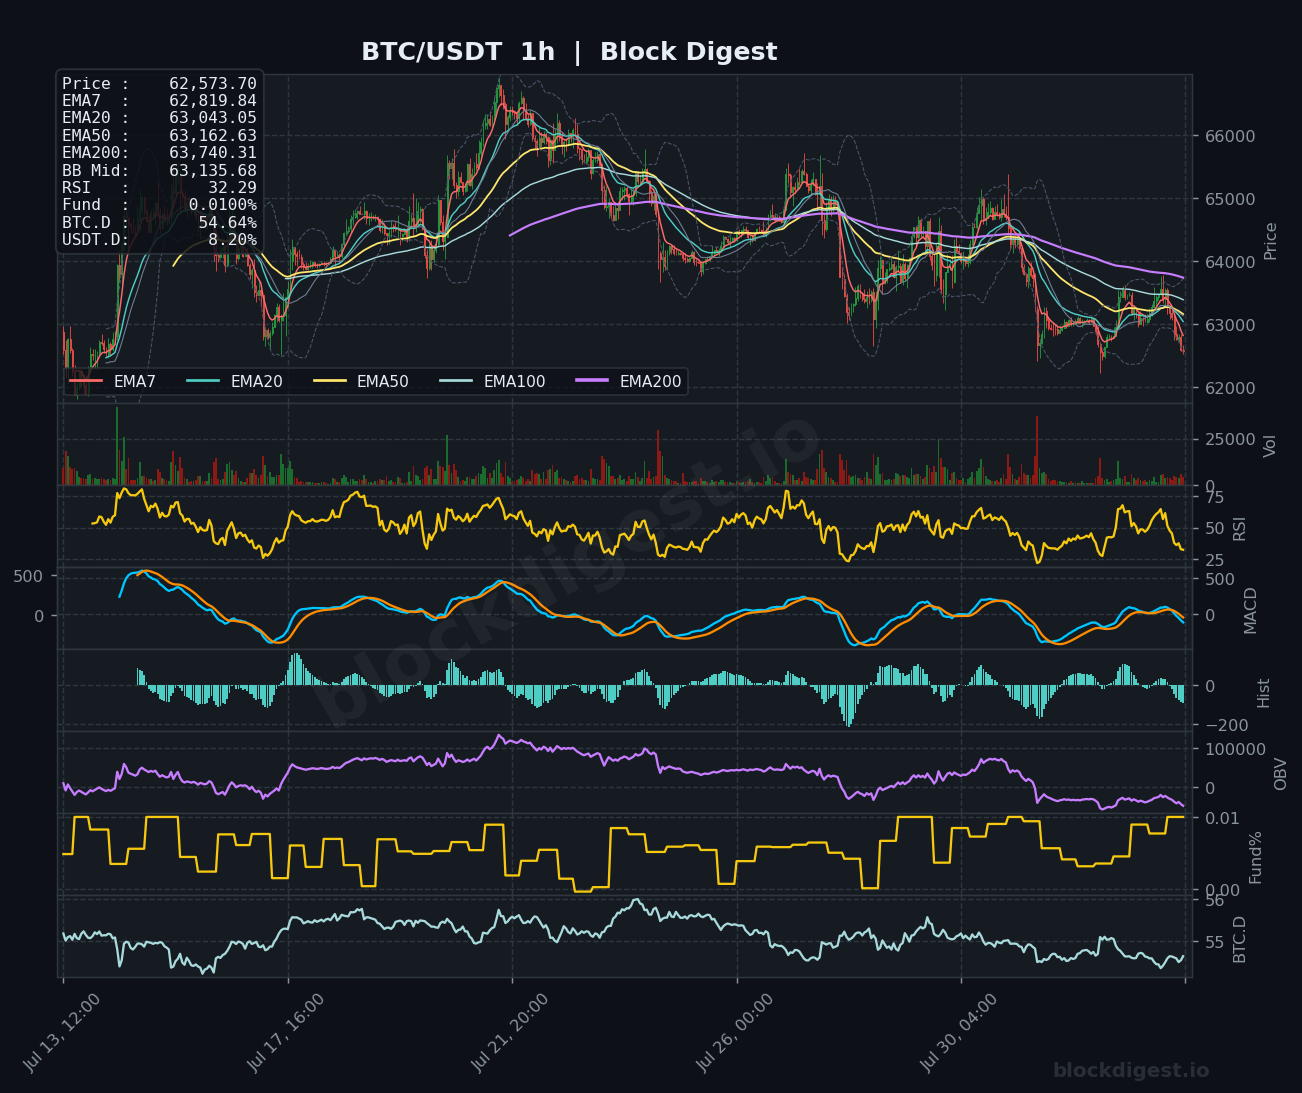
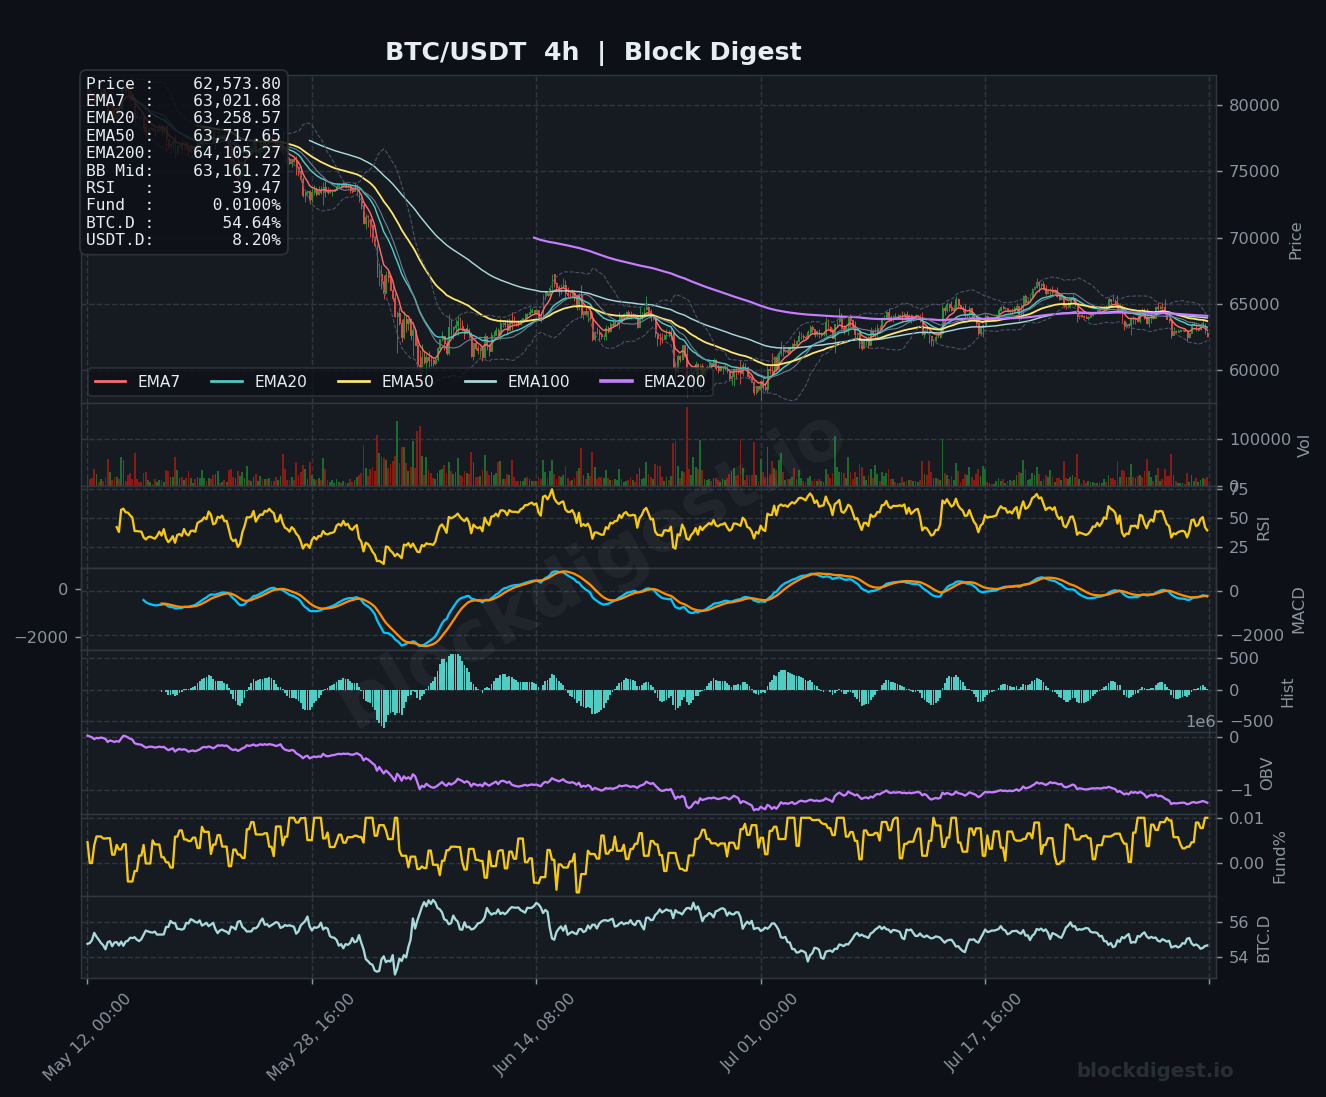
Across all three timeframes, the structure is uniformly bearish, with price trading below every meaningful EMA on the 1h, 4h, and 1d charts simultaneously — a rare degree of top-down alignment that reinforces the path of least resistance to the downside. On the 4h chart, the EMA7 ($63,022), EMA20 ($63,259), EMA50 ($63,718), and EMA200 ($64,105) are all stacked above current price, forming a dense overhead resistance cluster between $63,000 and $64,100. The 1h chart similarly shows price beneath all key EMAs, with the EMA200 at $63,740 acting as a near-term ceiling. Short-term momentum on the hourly — with RSI at 32.29 — is approaching oversold territory, but this has not yet translated into any meaningful divergence that would suggest a near-term relief bounce is imminent.
Key Levels to Watch
- Resistance: $63,000–$63,260 — Confluence of 4h EMA7/EMA20 and 1h EMA20/EMA50; this dense cluster is the first wall any recovery attempt must clear
- Resistance: $63,740–$64,105 — 1h EMA200 and 4h EMA200 overlap, representing the upper boundary of the near-term bearish structure
- Resistance: $65,000–$65,559 — Round psychological level coinciding with the 7-day high; a reclaim here would mark a structural shift
- Support: $62,240 — The 7-day low and most recent swing low; a decisive breach opens the door to the next leg lower
- Support: $61,000–$61,500 — Prior consolidation zone and potential area of demand visible on the daily structure
- Support: $59,500–$60,000 — Major psychological and historical support level; losing this would constitute a significant macro breakdown
Momentum & On-Chain Signals
Block Digest’s proprietary BD Pulse score sits at 34/100 — firmly in bearish territory — and the daily RSI of 43.59 confirms the market has not yet reached oversold exhaustion at the macro level, leaving room for further downside before a meaningful floor is established. On the 4h chart, the MACD remains in negative territory with the signal line suppressed near zero and the histogram printing shallow negative bars, indicating weak but persistent selling pressure. The 1h RSI at 32.29 is flirting with oversold conditions, which could produce a short-term technical bounce, though our OBV Trend reading of 1 suggests on-chain volume accumulation has not yet confirmed a genuine demand shift. Funding rates remain mildly positive at +0.0089%, meaning the majority of leveraged traders are still leaning long — a positioning dynamic that could accelerate any downside move if stops are triggered.
BTC Dominance & Market Sentiment
BTC dominance stands at 54.65% — consistent across all three chart timeframes — reflecting a market where capital remains relatively anchored in Bitcoin rather than rotating aggressively into altcoins, though dominance has been declining from recent highs which hints at marginal risk-off rotation. USDT.D at 8.20% indicates a meaningful pool of sidelined capital, which could re-enter the market as a tailwind if sentiment stabilizes, but for now it reads more as defensive positioning than pre-accumulation. Falling spot volume noted in broader market data, combined with bearish social engagement sentiment, reinforces the picture of a market in cautious wait-and-see mode.
Risk Scenarios
- Bullish case: A sustained hourly close above $63,260, followed by a reclaim of the 4h EMA cluster near $63,700–$64,100, would signal short-term trend reversal potential with an initial target back toward $65,000–$65,559. Improving volume and a BD Pulse score recovery above 50 would add meaningful confirmation to this thesis.
- Bearish case: A clean breakdown below the $62,240 recent swing low on elevated volume would confirm continuation of the downtrend, opening the path toward the $61,000–$61,500 support zone and potentially $59,500 on an accelerated flush. The ongoing ColdCard hack narrative — now totaling over 1,367 BTC stolen — adds a macro overhang that could weigh on retail sentiment and amplify any technical breakdown.
Outlook
The overall bias for August 3 remains cautiously bearish. Bitcoin is trapped beneath a dense EMA resistance cluster with no credible momentum catalyst yet visible on the higher timeframes, and the BD Pulse score of 34 reinforces that underlying market health has not improved. The critical trigger to watch in the next 24–48 hours is whether price can defend the $62,240 swing low — a failure here shifts the focus squarely to $61,000 and below. Conversely, any reclaim of the $63,260–$63,740 zone on solid volume would warrant reassessment of the short-term bearish thesis. Until such confirmation materializes, the prudent read is that this market remains in a corrective, risk-off phase with sellers firmly in control at current levels.
—
Disclaimer: This analysis is for informational purposes only and does not constitute financial advice. Cryptocurrency markets are highly volatile and unpredictable. All trading decisions should be made based on your own research and risk tolerance. Block Digest is not responsible for any financial losses incurred as a result of acting on this content.
Stay Ahead of the Market
Follow BlockDigest for crypto market intelligence, research and real-time updates.


