
Market Overview
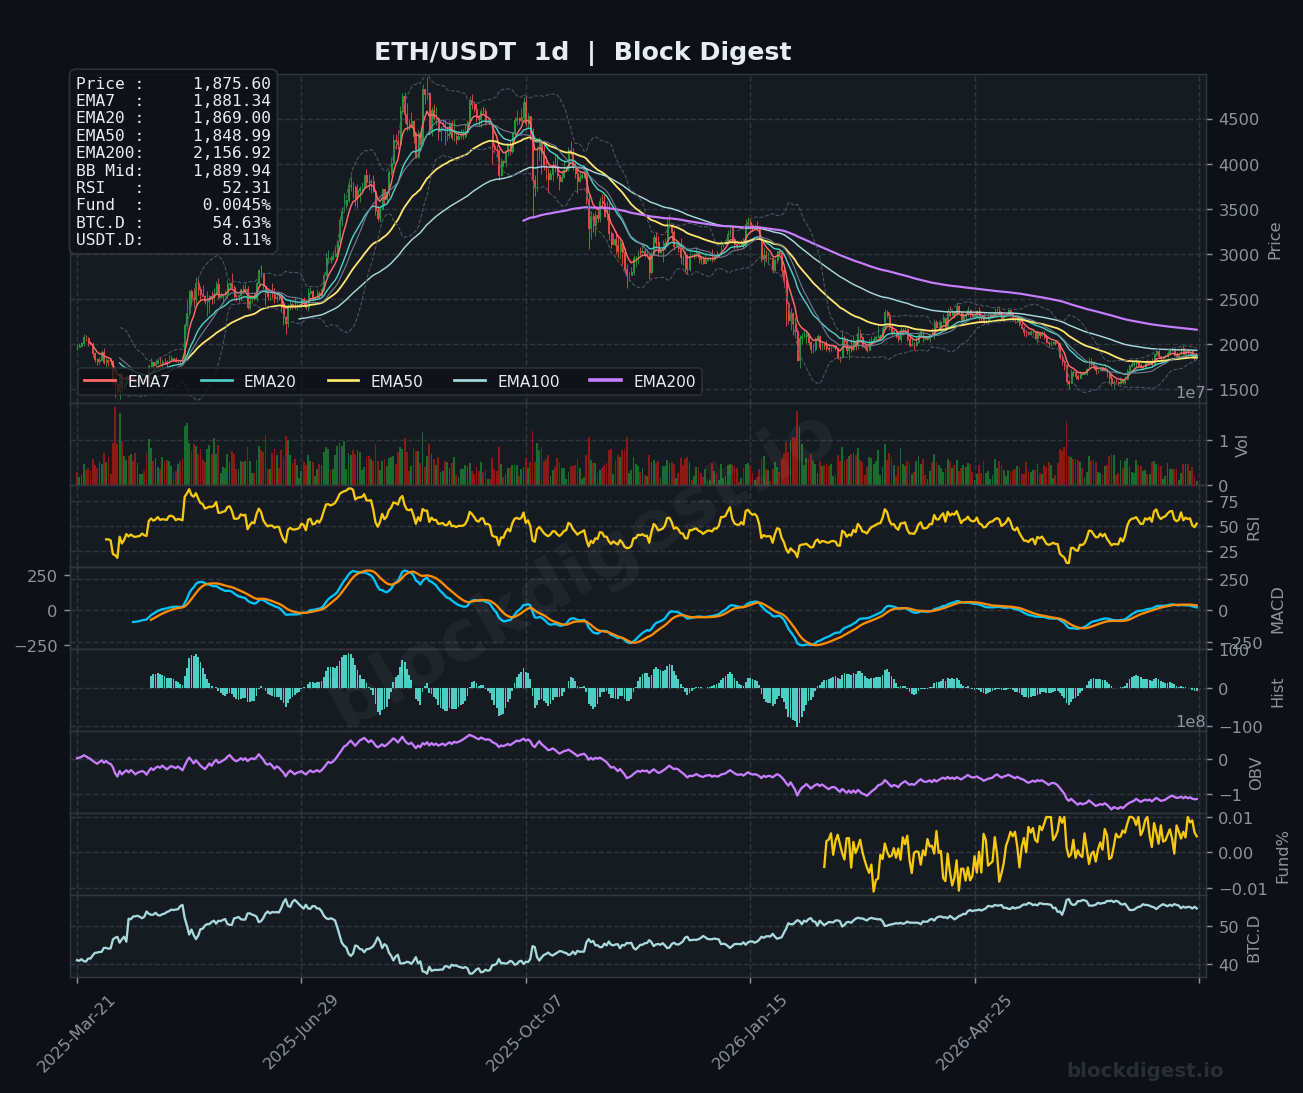
Ethereum is trading around $1,875.60 as of August 2, 2026, navigating a technically delicate zone following a broader market pullback that has seen ETH shed roughly 3.1% in 24 hours. On the daily timeframe, price sits in a congested region between the EMA7 ($1,881.34), EMA20 ($1,869.00), and EMA50 ($1,848.99), with the heavily suppressive EMA200 at $2,156.92 still looming well overhead — a reminder that the macro trend remains structurally bearish despite the recovery seen from cycle lows. The Bollinger Band midline on the daily at $1,889.94 is acting as immediate overhead resistance, and price continues to trade below it, suggesting the path of least resistance is still tilted to the downside. The daily candles have been compressing inside a narrowing range, hinting at a potential volatility expansion soon.
Multi-Timeframe Confluence
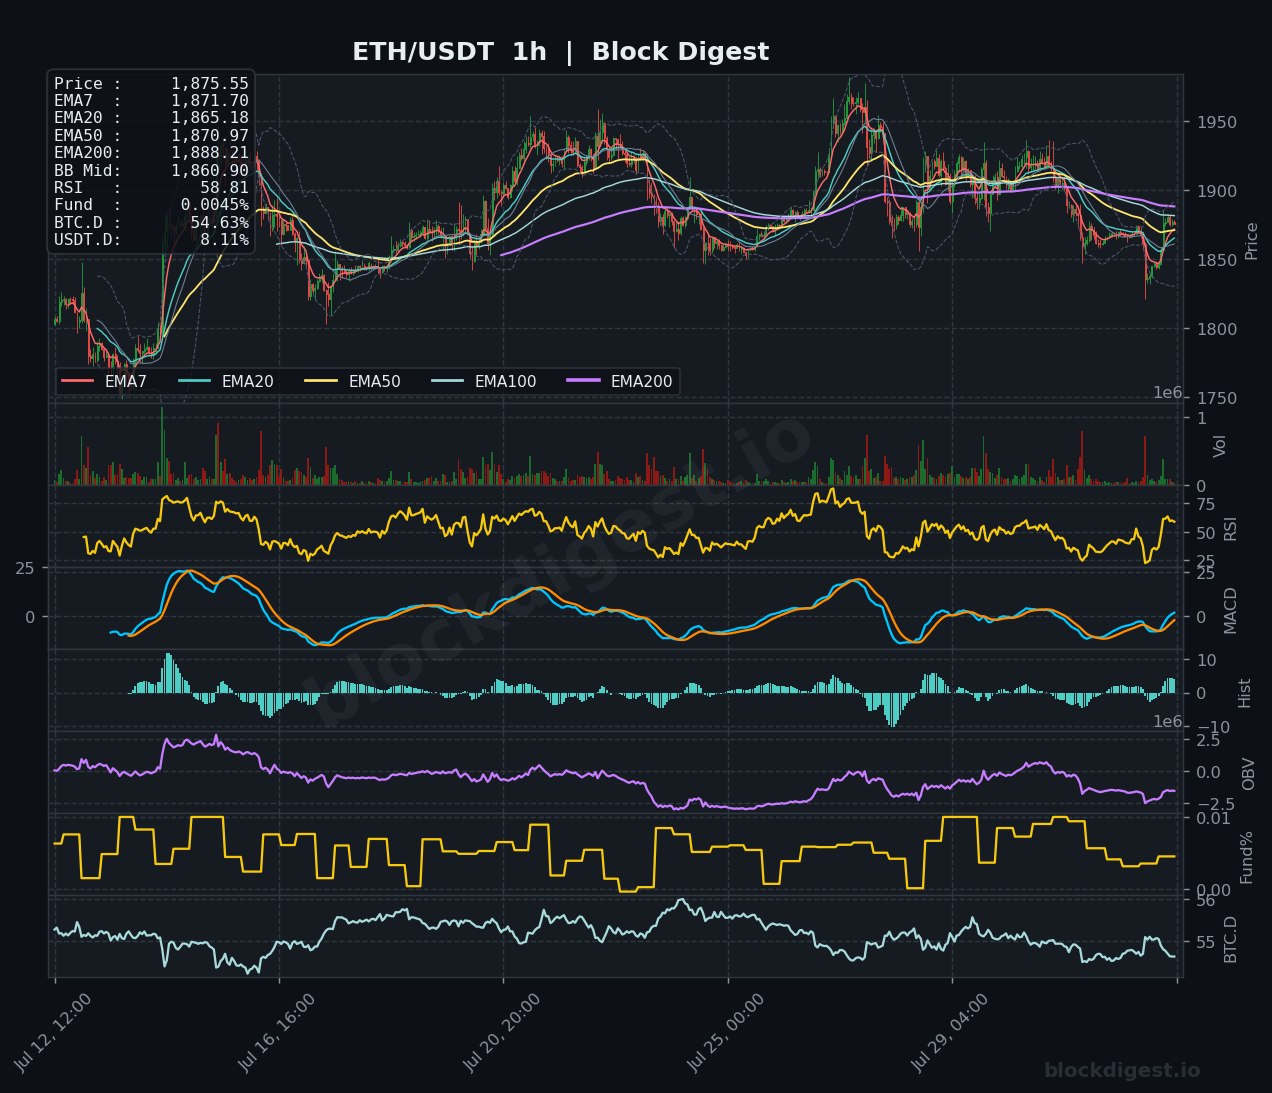
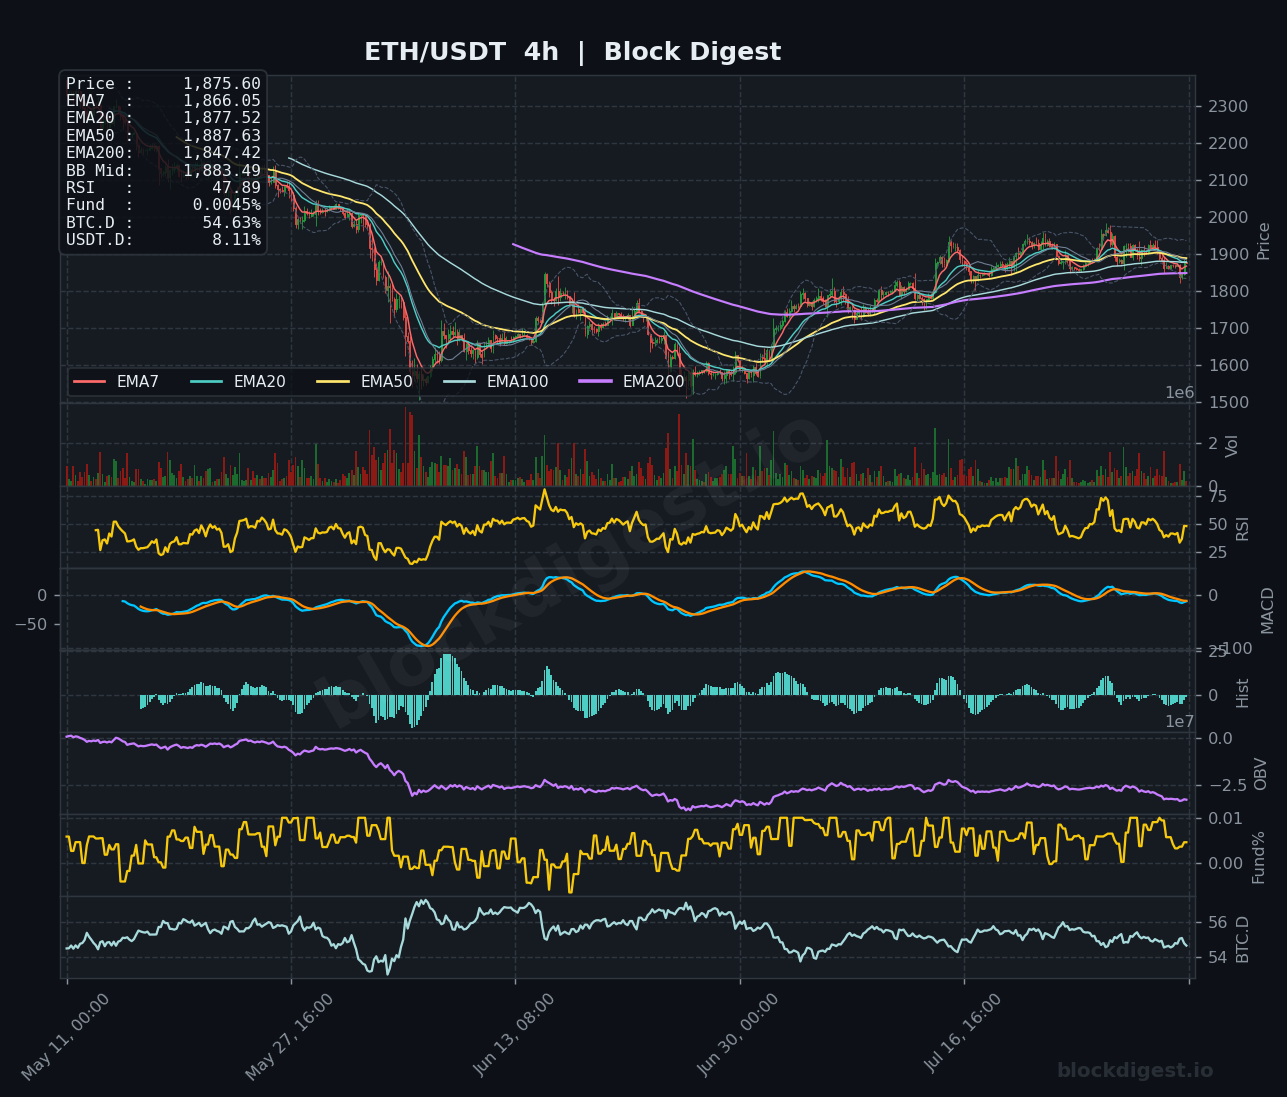
Across all three timeframes, the EMA stack is in a broadly bearish alignment at the macro level, yet the short-term picture shows some tentative stabilization. On the 1-hour chart, price at $1,875.55 has managed to recover back above the EMA7 ($1,871.70), EMA20 ($1,865.18), and EMA50 ($1,870.97), which is a mildly constructive near-term signal, though the EMA200 at $1,888.21 on this timeframe caps immediate upside. The 4-hour chart shows price sitting just below its EMA20 ($1,877.52) and EMA50 ($1,887.63), with those levels now acting as resistance — a bearish configuration that aligns with the daily trend. The convergence of the 4H BB midline ($1,883.49) and the 4H EMA50 around $1,887–$1,888 creates a tight resistance cluster that ETH must convincingly reclaim to shift short-term bias.
Key Levels to Watch
- Resistance: $1,887–$1,889 — Confluence of the 4H EMA50, 4H BB midline, and daily BB midline; a close above this zone would be the first meaningful bullish signal.
- Resistance: $1,910–$1,920 — Recent swing high region on the 4H chart and where the 1H EMA200 ($1,888) extends toward local supply; also aligns with where price failed on the most recent rally.
- Resistance: $1,950–$1,960 — Structural ceiling visible on the 1H chart where prior distribution occurred; reclaiming this level would mark a more meaningful trend shift.
- Support: $1,848–$1,850 — Daily EMA50 ($1,848.99) and recent consolidation base; a loss of this level on a daily close would be technically significant.
- Support: $1,820–$1,825 — Intermediate demand zone visible on the 4H chart corresponding to prior accumulation during the recovery leg; likely to attract buyers on a deeper dip.
- Support: $1,780–$1,800 — Key psychological level and stronger structural support from prior price action; a break below would put the broader recovery thesis at serious risk.
Momentum & On-Chain Signals
The RSI picture tells a mixed but cautious story: the 1-hour RSI has recovered to 58.81, suggesting short-term momentum is stabilizing, but the 4H RSI at 47.89 and the daily RSI at 52.31 both sit in neutral-to-slightly-bearish territory without directional conviction. Block Digest’s proprietary BD Pulse Score of 41/100 reflects this same hesitation — firmly in bearish territory and consistent with a market that lacks strong institutional buying pressure. On the 4H and daily MACD, the signal lines remain close to zero with a histogram that is trending shallow negative, indicating the bounce lacks strong momentum backing. The OBV trend registered at -1 on our BD Pulse model is particularly telling: despite the price holding above key daily EMAs, volume-weighted accumulation is not confirming the recovery, pointing more toward distribution than genuine demand building.
BTC Dominance & Market Sentiment
BTC dominance is currently sitting at 54.63% per the charts (broadly confirmed by the market-wide figure of 56%), which continues to suppress altcoin performance relative to Bitcoin — a headwind ETH cannot ignore. USDT dominance at 8.11% reflects that a meaningful portion of capital remains parked on the sidelines in stablecoins, consistent with the fear sentiment noted across markets following the Fed-driven momentum reversal. Morgan Stanley’s launch of spot ETH and SOL ETPs on NYSE Arca is a positive structural development for institutional adoption, but it has yet to translate into on-chain accumulation that would meaningfully shift ETH’s near-term positioning.
Risk Scenarios
- Bullish case: A decisive hourly or 4H close above $1,889–$1,900 with rising volume would signal a reclaim of the key EMA cluster, opening a path toward $1,920 and eventually $1,950. Sustained improvement in the BD Pulse Score above 50 combined with OBV trend reversal would add conviction to this scenario.
- Bearish case: A break and daily close below the $1,848–$1,850 EMA50 support on the daily chart would confirm renewed selling pressure, exposing the $1,820 and $1,780 demand zones. Continued BTC dominance expansion above 55–56% would amplify downside risk for ETH specifically.
Outlook
ETH finds itself at a genuinely pivotal junction on August 2, 2026 — the near-term 1H EMA structure has stabilized, but the 4H and daily pictures remain cautious, with price caught beneath a dense cluster of resistance between $1,887 and $1,910. The BD Pulse’s bearish reading of 41/100 and negative OBV trend suggest that despite the slight intraday recovery, smart money is not yet positioning aggressively on the long side. The next 24–48 hours hinge critically on whether ETH can reclaim and hold $1,889 on a 4H close; failure to do so keeps the door open for a retest of $1,848 and below. The overall bias remains cautiously bearish to neutral, with any bullish thesis requiring both price and volume confirmation before warranting meaningful conviction.
—
Disclaimer: This analysis is for informational purposes only and does not constitute financial advice. Cryptocurrency markets are highly volatile and unpredictable. All trading decisions should be made based on your own research and risk tolerance. Block Digest is not responsible for any financial losses incurred as a result of acting on this content.
Stay Ahead of the Market
Follow BlockDigest for crypto market intelligence, research and real-time updates.


