
Market Overview
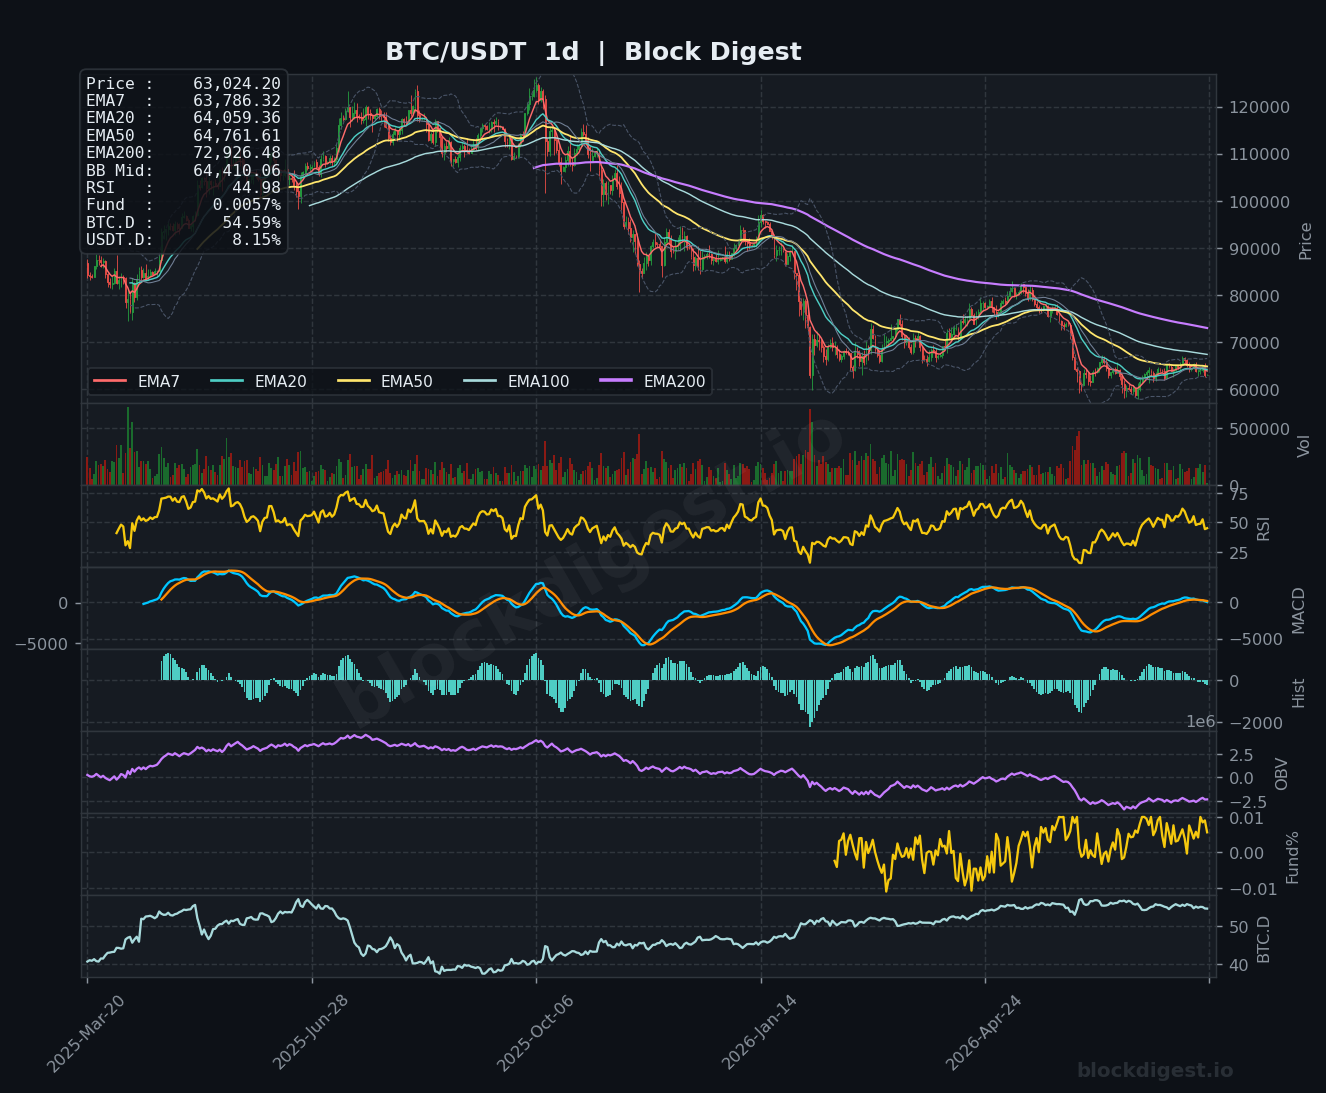
Bitcoin is trading at approximately $63,024 as of August 1, 2026, down roughly 3% over the past 24 hours and sitting in a structurally weak position across all major timeframes. On the daily chart, price is trading well below the EMA200 at $72,926 — a level that has acted as a gravitational ceiling throughout the broader downtrend — and has now slipped beneath the EMA7 ($63,786), EMA20 ($64,059), and EMA50 ($64,761) in a full bearish stack. The Bollinger Band midline on the daily sits at $64,410, and price has broken decisively below it, suggesting the path of least resistance remains to the downside. The dominant daily trend is bearish, with the current structure reflecting a distribution phase that has been in place since the macro highs above $100K.
Multi-Timeframe Confluence
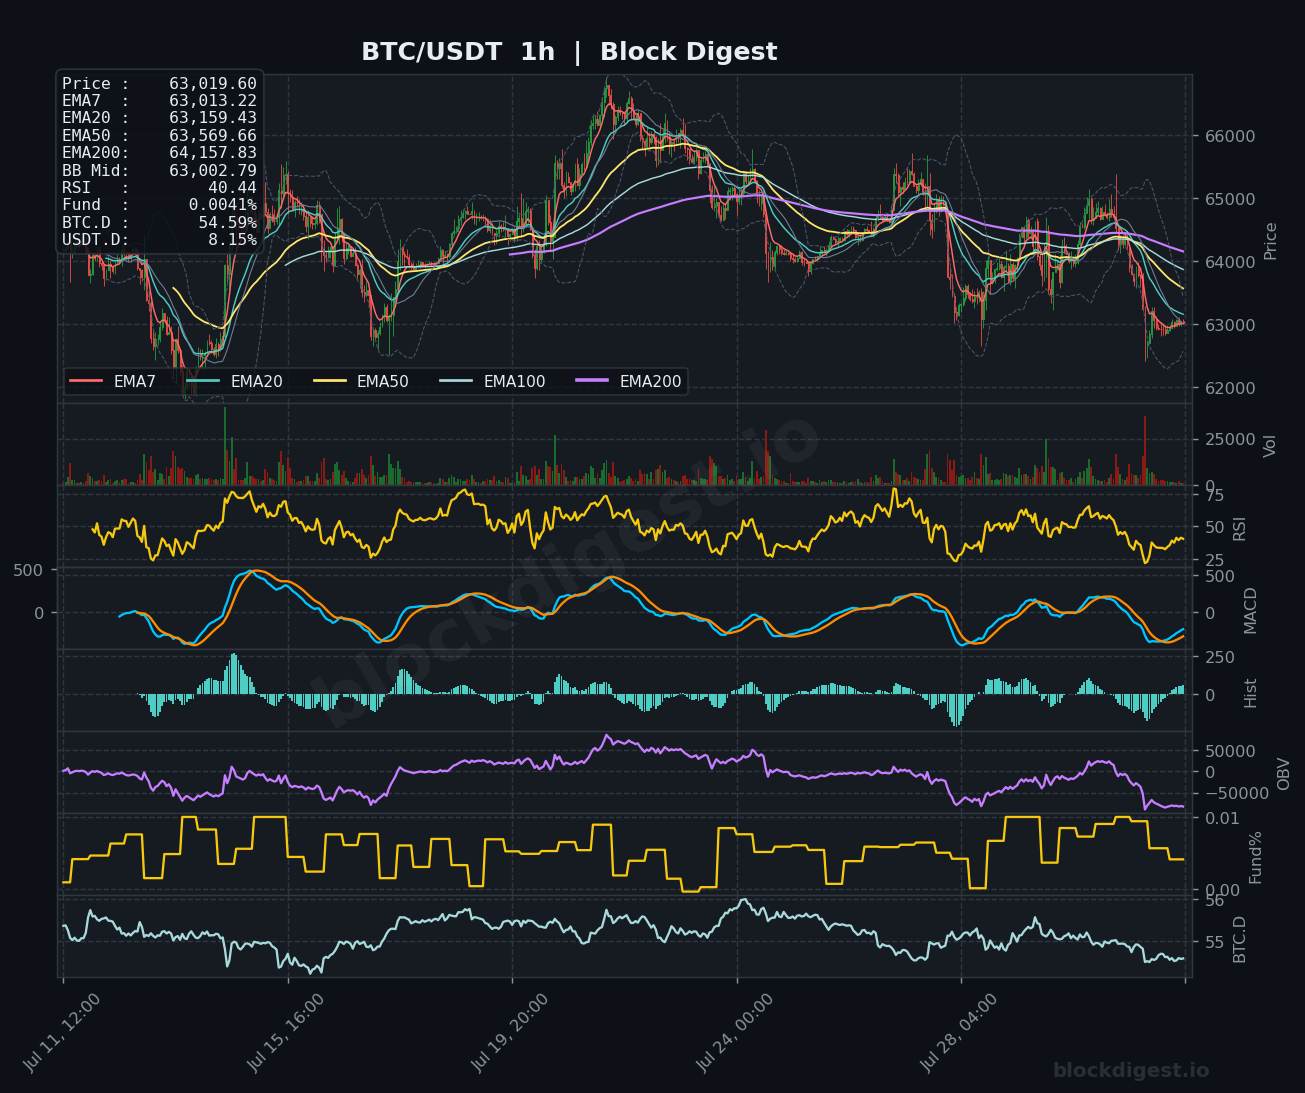
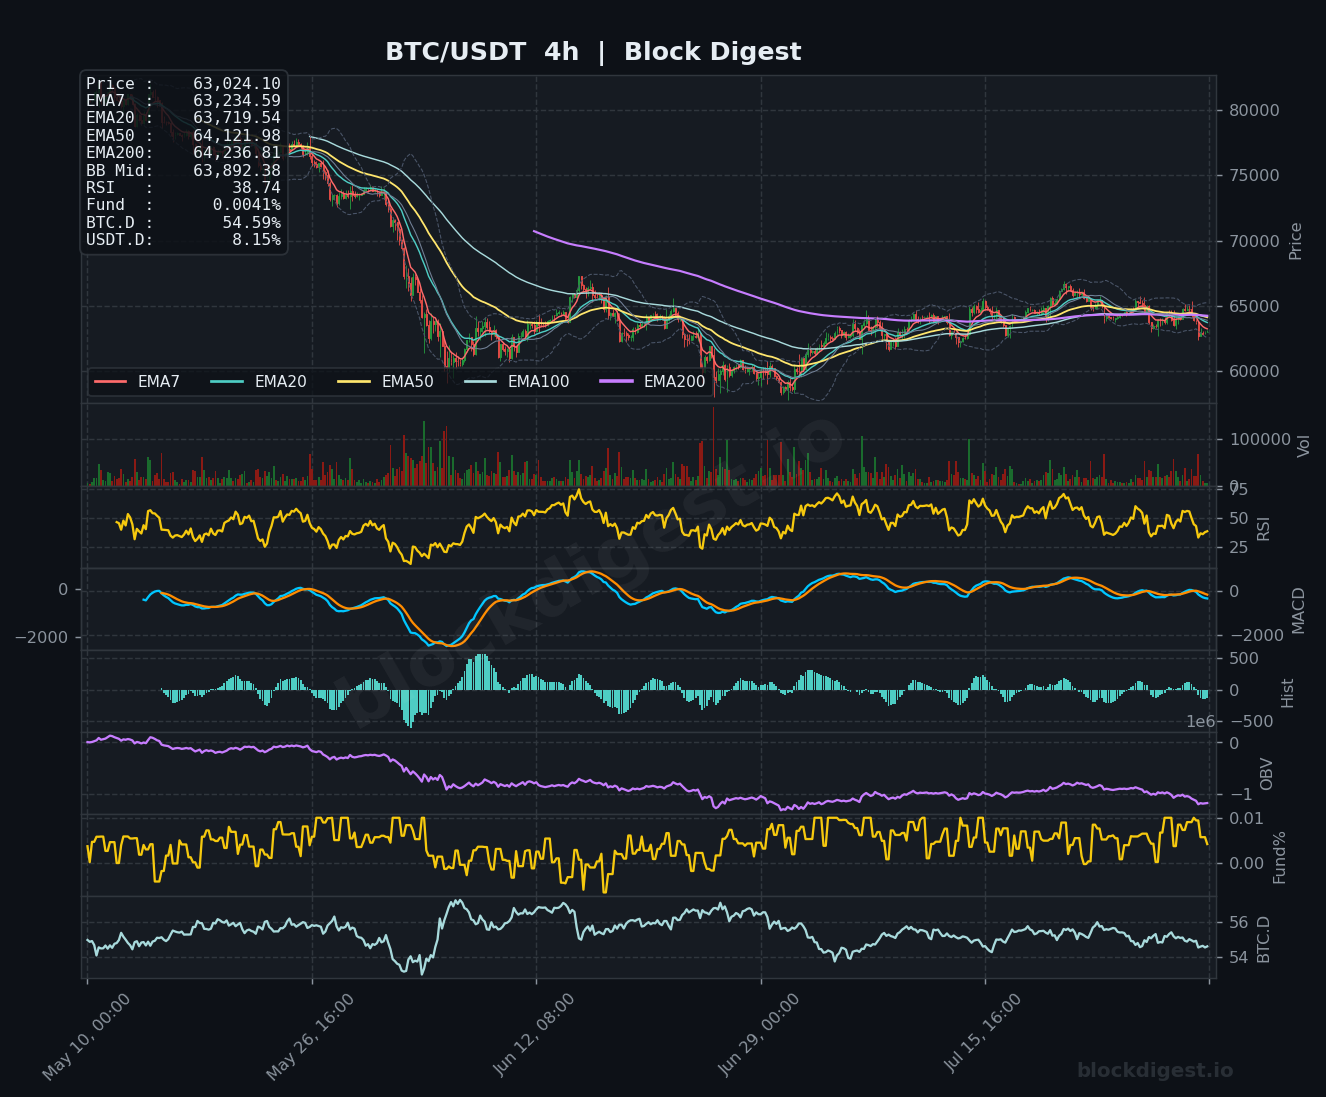
Across all three timeframes, the EMA structure is uniformly bearish — short-term EMAs are stacked below longer-term ones and price is failing to reclaim any meaningful moving average. On the 4-hour chart, price is trading beneath the EMA7 ($63,234), EMA20 ($63,719), EMA50 ($64,121), and EMA200 ($64,236), with the Bollinger Band midline at $63,892 capping attempted recoveries. The 1-hour chart paints a similarly bleak picture, with price at $63,019 lagging below all EMAs and the BB midline at $63,002 now being tested as the only immediate reference point. There is strong multi-timeframe confluence pointing to continued selling pressure, with no meaningful bullish divergence across any of the three charts to suggest an imminent reversal.
Key Levels to Watch
- Resistance: $63,719–$63,892 — the 4h EMA20 and BB midline cluster form a first line of overhead supply that sellers have defended repeatedly; $64,059–$64,236 — the daily EMA20 and 4h EMA200 converge here, representing the critical zone bulls must reclaim to shift short-term momentum; $64,761 — the daily EMA50, which has acted as dynamic resistance throughout the recent bearish phase
- Support: $62,500–$62,642 — current spot price and recent session lows represent near-term floor, aligning with the lower Bollinger Band on the 1h; $61,500–$61,800 — a structural demand zone visible on the 4h chart that provided a bounce during a prior test; $60,000 — a major psychological round number and the last significant swing low that, if broken, would open the door to a deeper retracement
Momentum & On-Chain Signals
The RSI on the 1-hour chart has deteriorated to 40.44, while the 4-hour RSI sits at 38.74 and the daily RSI reads approximately 44.98 — all below the neutral 50 level, confirming broad momentum weakness without yet reaching technically oversold extremes. The MACD on both the 4h and daily timeframes shows the signal line beginning to curl downward again after a brief mid-cycle consolidation, with histograms flipping negative — a bearish cross on the 4h is developing. Our proprietary BD Pulse Score has dropped to 24 out of 100, firmly in Extreme Bear territory, reinforcing what the charts are showing: this is not a healthy consolidation but a market under meaningful distribution pressure. The funding rate remains a modest positive at +0.0064%, suggesting longs are still paying shorts, which, combined with a Long/Short account ratio of 2.21 (68.9% long), leaves the market exposed to further liquidation cascades if support levels fail.
BTC Dominance & Market Sentiment
BTC dominance currently sits at 54.59%, holding relatively firm even as Bitcoin itself sells off — a dynamic that typically signals altcoins are underperforming BTC and that broader risk appetite is contracting rather than rotating. USDT dominance at 8.15% remains elevated, indicating a meaningful portion of the market is sitting in stablecoins and has not re-entered risk assets, which is consistent with the cautious tone traders have adopted amid rising rate hike fears and geopolitical uncertainty around US-Iran tensions. This combination of high stablecoin dominance and sticky BTC dominance suggests the market is in a defensive posture with no clear catalyst yet to trigger a risk-on rotation.
Risk Scenarios
- Bullish case: A decisive hourly close back above the $63,892–$64,059 zone (4h BB mid and daily EMA20) on elevated volume would signal that sellers are exhausting and could open a recovery attempt targeting $64,761 (daily EMA50) and potentially $65,500. This scenario becomes more credible if Bitcoin ETF inflows resume and macro data comes in softer than expected, relieving rate hike pressure.
- Bearish case: A confirmed break and close below $62,500 on the daily would validate a continuation of the downtrend, exposing the $61,500 demand zone and, on sustained selling, the $60,000 psychological floor. Worsening geopolitical headlines, additional ETF outflows following the recent $225M exit, or a stronger-than-expected jobs print could accelerate this path.
Outlook
The overall bias heading into August 1 is cautiously bearish. Bitcoin has entered the month on the back foot, trading beneath every key daily EMA, with the BD Pulse Score at an extreme bear reading of 24/100 and the broader macro backdrop providing little near-term relief. The next 24–48 hours are critical: a failure to reclaim the $63,719–$64,059 resistance cluster on the 4h would likely invite a test of the $62,500 lows, while a sustained break of that zone could rapidly bring the $60,000 level into focus. Traders should monitor both the jobs data release and any fresh ETF flow data as the primary macro catalysts capable of shifting this setup in either direction. Until price reclaims and holds above the daily EMA20 at $64,059 on a closing basis, any intraday bounces should be treated as relief rallies within a broader downtrend.
—
Disclaimer: This analysis is for informational purposes only and does not constitute financial advice. Cryptocurrency markets are highly volatile and unpredictable. All trading decisions should be made based on your own research and risk tolerance. Block Digest is not responsible for any financial losses incurred as a result of acting on this content.
Stay Ahead of the Market
Follow BlockDigest for crypto market intelligence, research and real-time updates.


