Ethereum Daily Analysis: ETH consolidates at $1,842 above key moving averages
Market Overview
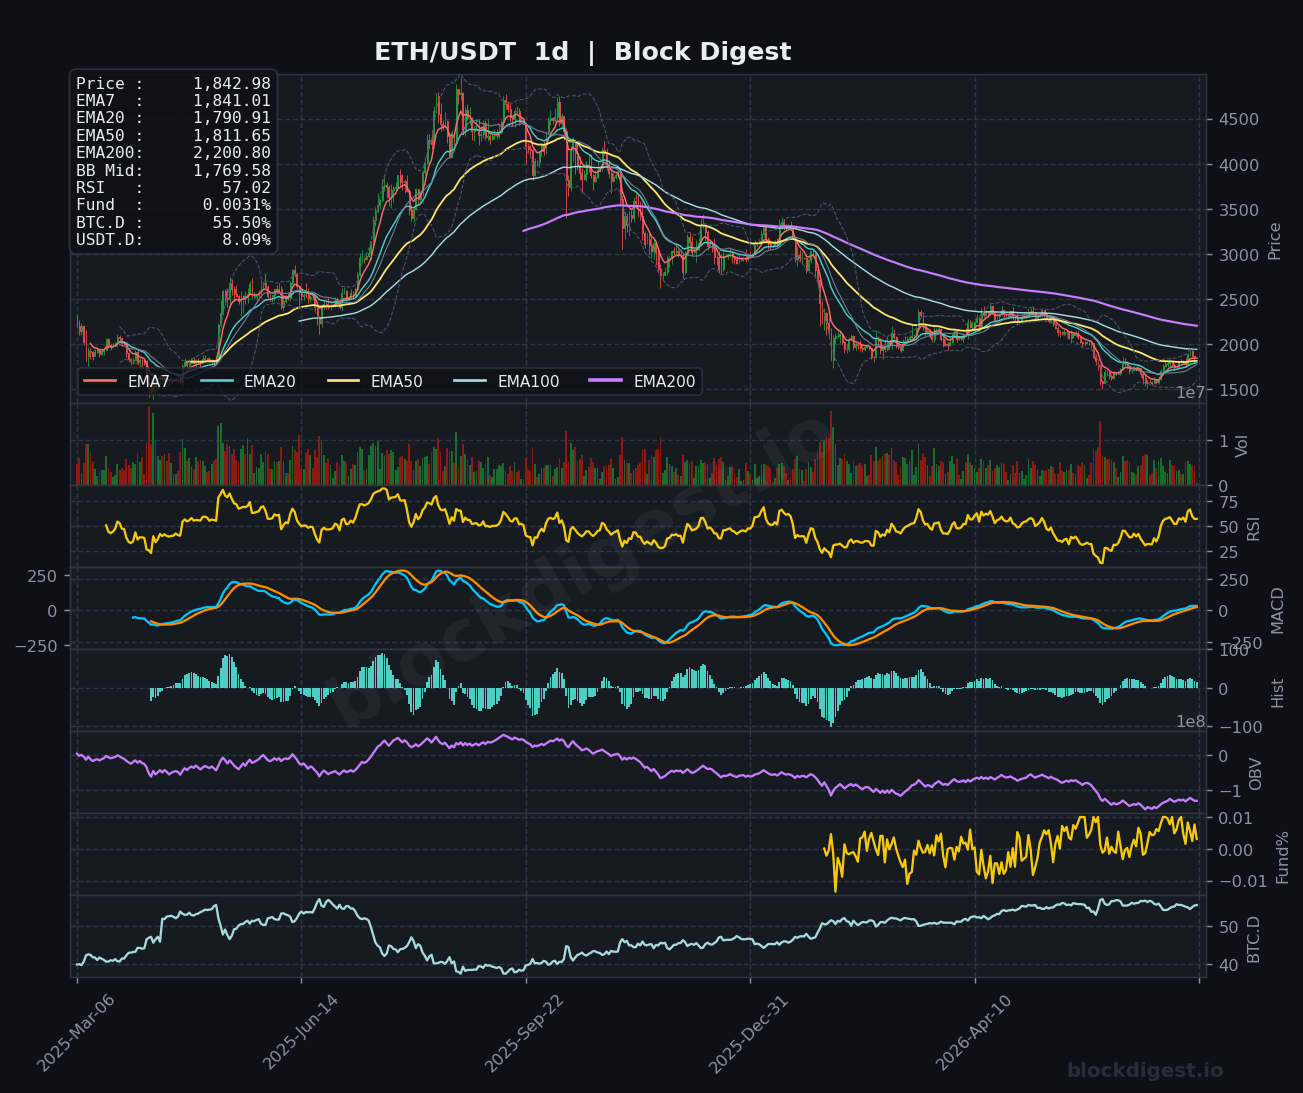
ETH/USDT is currently trading at $1,842.98, consolidating in a narrow range after a notable recovery from multi-month lows near $1,550 printed earlier in the cycle. On the daily timeframe, price has reclaimed both the EMA7 ($1,841.01) and EMA20 ($1,790.91), and is pushing above the EMA50 ($1,811.65) — a constructive development that suggests the intermediate-term structure is gradually improving. However, the daily EMA200 sits far overhead at $2,200.80, underscoring that the macro trend remains bearish and any recovery must be treated as a counter-trend move until proven otherwise. Price is trading above the daily Bollinger Band midline ($1,769.58), which is a mild positive, though the Bollinger Bands themselves remain wide, reflecting elevated uncertainty.
Multi-Timeframe Confluence
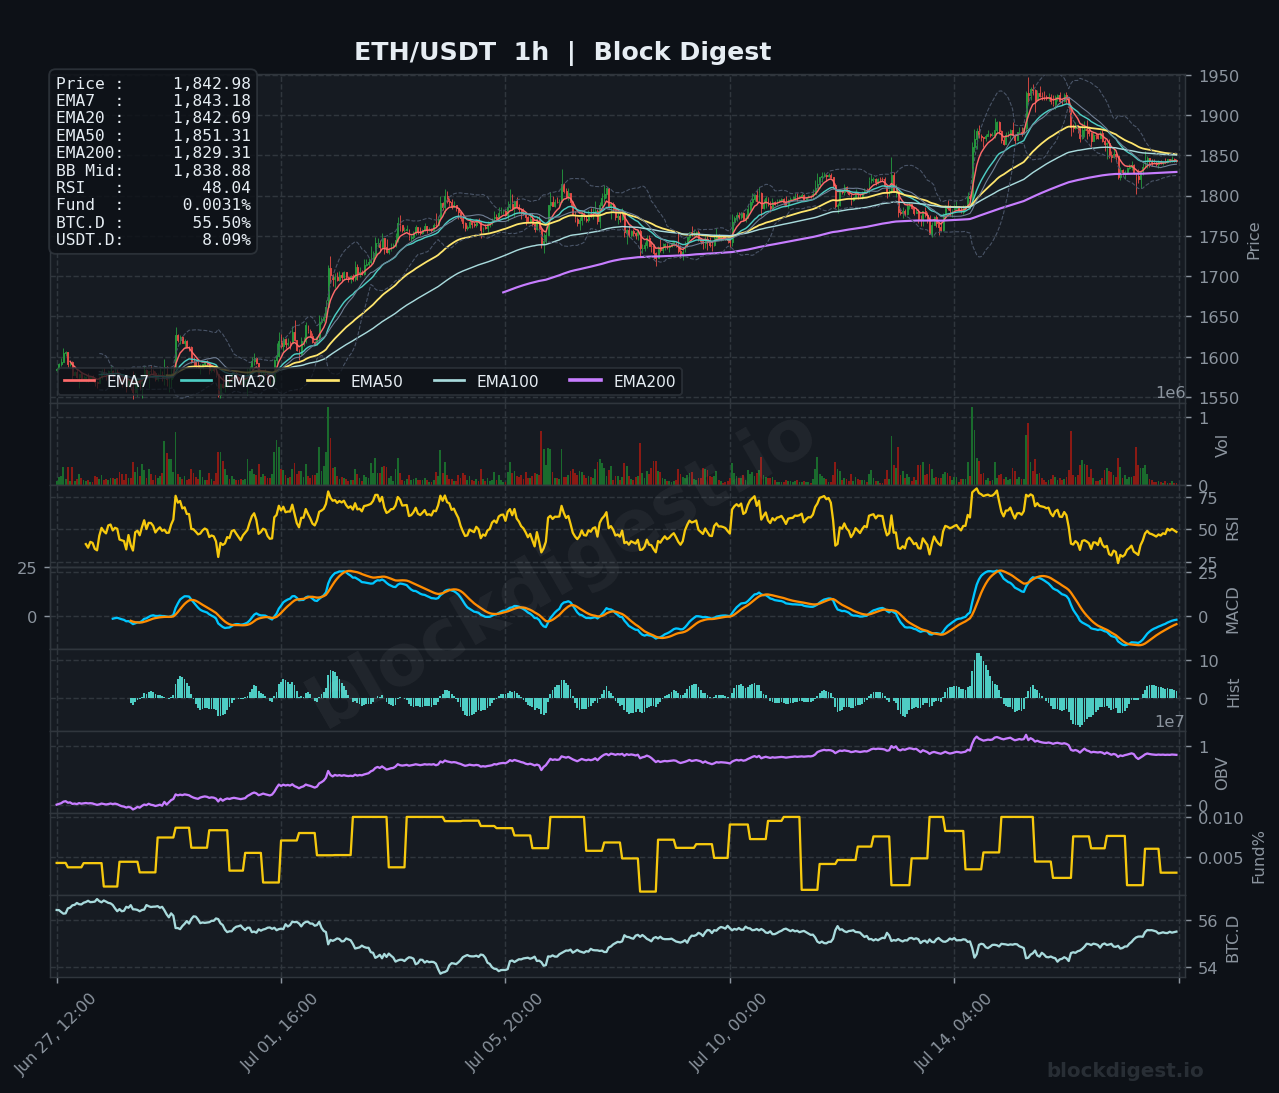
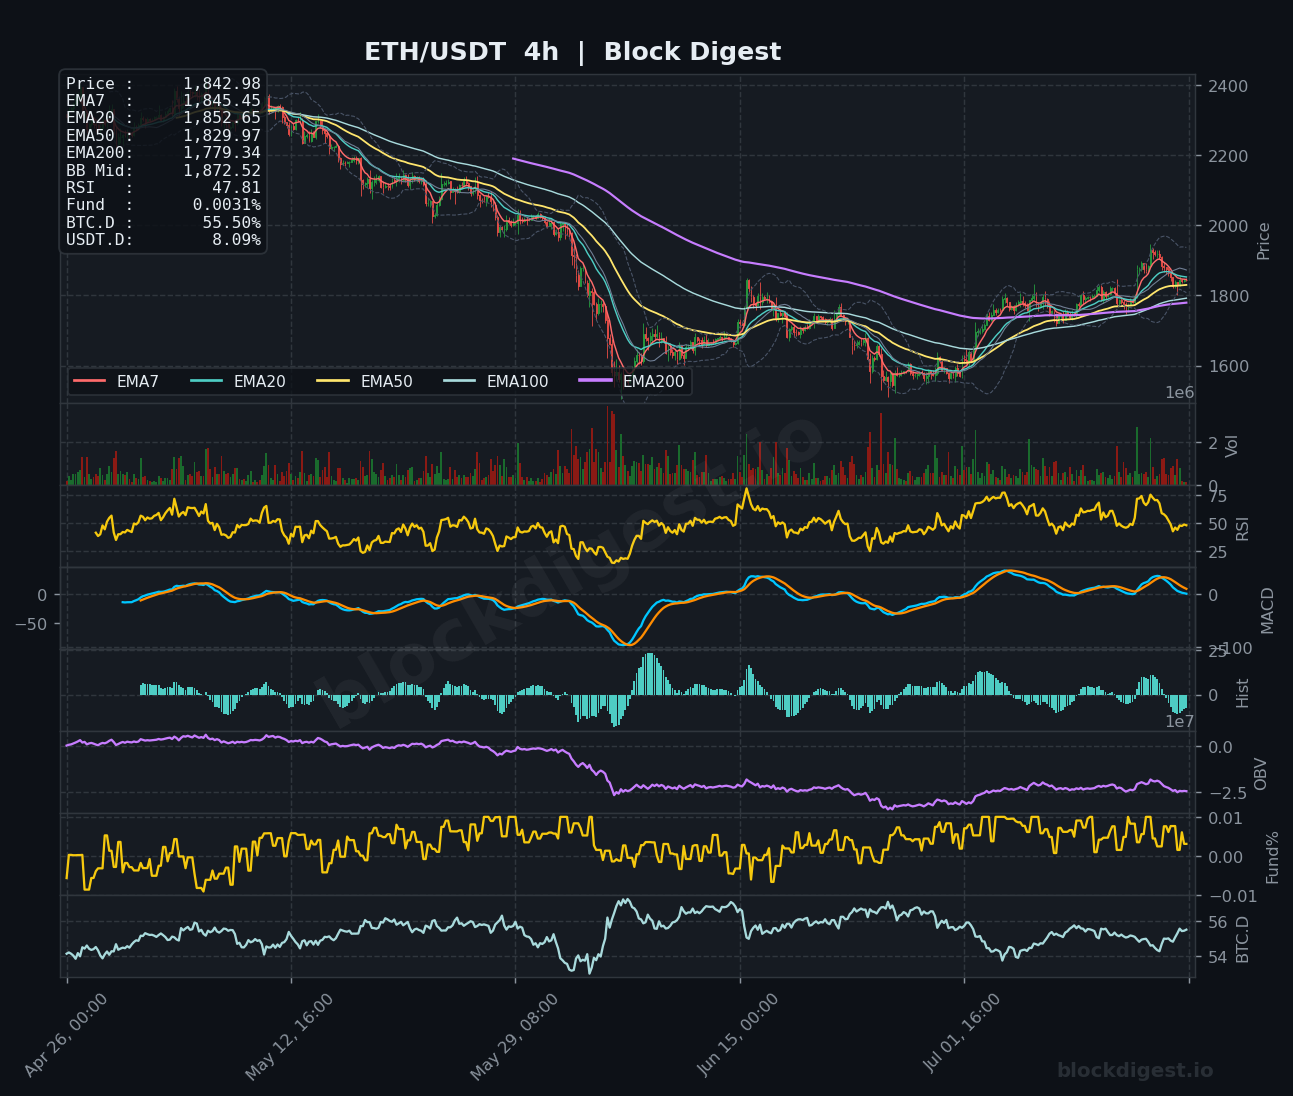
On the 1-hour chart, ETH is coiling tightly around the cluster of short-term EMAs (EMA7 at $1,843.18, EMA20 at $1,842.69), with price just below the EMA50 ($1,851.31) — a level that has acted as near-term resistance after the recent pullback from the $1,950 area. The 4-hour chart presents a more cautious picture: price remains below the BB midline ($1,872.52) and the EMA20 ($1,852.65), while the EMA200 on that timeframe ($1,779.34) is now acting as dynamic support following the recovery. All three timeframes agree that the $1,850–$1,875 zone is a critical battleground — bulls need to clear this range convincingly to unlock further upside, while failure here risks a retest of lower demand zones. The geopolitical headwinds from ongoing U.S.-Iran tensions are suppressing risk appetite and helping explain the stalling momentum at this resistance cluster.
Key Levels to Watch
- Resistance: $1,872.52 — 4H Bollinger Band midline and 4H EMA20 confluence; the immediate ceiling bulls must clear for momentum to resume
- Resistance: $1,900–$1,910 — recent swing high region where ETH briefly spiked before the geopolitically-driven selloff; reclaiming this area would shift near-term bias firmly bullish
- Resistance: $1,950–$1,960 — the 1H Bollinger Band upper boundary from the prior rally and a key supply zone visible on the 1H chart
- Support: $1,829.31 — 1H EMA200, the first meaningful dynamic support below spot; a close beneath this level would be a near-term warning sign
- Support: $1,790–$1,800 — daily EMA20 ($1,790.91) and a prior consolidation base; this zone provided meaningful demand during the recovery and remains critical for the bullish thesis
- Support: $1,769.58 — daily Bollinger Band midline; losing this on a closing basis would signal renewed distribution and likely invite a retest toward the $1,700 area
Momentum & On-Chain Signals
The RSI across all timeframes is neutral-to-soft: 48.04 on the 1H, 47.81 on the 4H, and a relatively more constructive 57.02 on the daily — the daily reading is the most encouraging, suggesting the broader recovery still has room to run without hitting overbought territory. The MACD on the 4H is compressing near zero after a bullish cross attempt, with the histogram flipping slightly negative, indicating momentum is fading at current resistance. On the daily, the MACD lines are slowly curling upward toward zero from deeply negative territory — a gradual but meaningful shift in medium-term momentum structure. OBV on the 1H has been steadily rising throughout the recovery phase, indicating net accumulation, though the 4H OBV remains in negative territory from the multi-month downtrend, a reminder that institutional-scale selling pressure has not fully reversed. The funding rate at 0.0031% is mildly positive but near neutral, suggesting the market is not overextended in either direction.
BTC Dominance & Market Sentiment
BTC.D stands at 55.50%, remaining elevated and reflecting continued capital preference for Bitcoin over altcoins including ETH in the current risk-off environment. USDT.D at 8.09% indicates a meaningful portion of market capital remains parked in stablecoins — participants are cautious and not fully rotating back into risk assets, consistent with the geopolitical uncertainty weighing on markets this week. For ETH specifically, sustained BTC dominance above 55% is a headwind; a meaningful altcoin rally would typically require BTC.D to begin declining toward the 53–54% range.
Risk Scenarios
- Bullish case: A decisive 4H close above $1,872.52 — clearing the 4H BB midline and EMA20 confluence — would validate the recovery structure and open the path toward the $1,900–$1,910 resistance zone. A de-escalation in Middle East tensions combined with continued soft inflation data could provide the catalyst for ETH to challenge $1,950 within the next 48–72 hours.
- Bearish case: Failure to hold the $1,829.31 (1H EMA200) level on a closing basis, particularly if accompanied by a geopolitical escalation or risk-off spike, would signal a failed recovery attempt and expose the $1,790–$1,800 zone. A breakdown below $1,769.58 (daily BB midline) on a daily close would materially strengthen the bearish thesis and shift the target toward the $1,700 handle.
Outlook
ETH/USDT is at a pivotal inflection point, consolidating just below a dense resistance cluster ($1,850–$1,875) after a sharp recovery from cycle lows. The daily timeframe offers cautious optimism — price is above key short-term EMAs and the daily RSI at 57 has room to extend — but the macro bearish structure defined by the EMA200 at $2,200.80 remains firmly intact, framing this as a counter-trend recovery until bulls prove otherwise. The key trigger to watch in the next 24–48 hours is a sustained 4H close above $1,872.52; confirmation of this level would invite a push toward $1,900–$1,910, while rejection reinforces the rangebound scenario. Geopolitical developments surrounding the Strait of Hormuz and any shifts in broader risk sentiment will remain a primary macro driver alongside technical structure.
Disclaimer: This analysis is for informational purposes only and does not constitute financial advice. Cryptocurrency markets are highly volatile and unpredictable. All trading decisions should be made based on your own research and risk tolerance. Block Digest is not responsible for any financial losses incurred as a result of acting on this content.