
Market Context
The broader altcoin market is navigating a cautious environment as BTC dominance holds at 55.38%, indicating that Bitcoin continues to command a significant share of total crypto capital with limited rotation into alts at scale. USDT dominance at 8.20% remains notably elevated, signaling that a meaningful portion of sidelined capital has yet to re-enter risk assets — a headwind for sustained altcoin rallies. Total crypto market cap sits at $2.18T with a 57.66% surge in 24-hour volume, suggesting short-term activity spikes rather than a broad structural shift in risk appetite.
Solana (SOL)
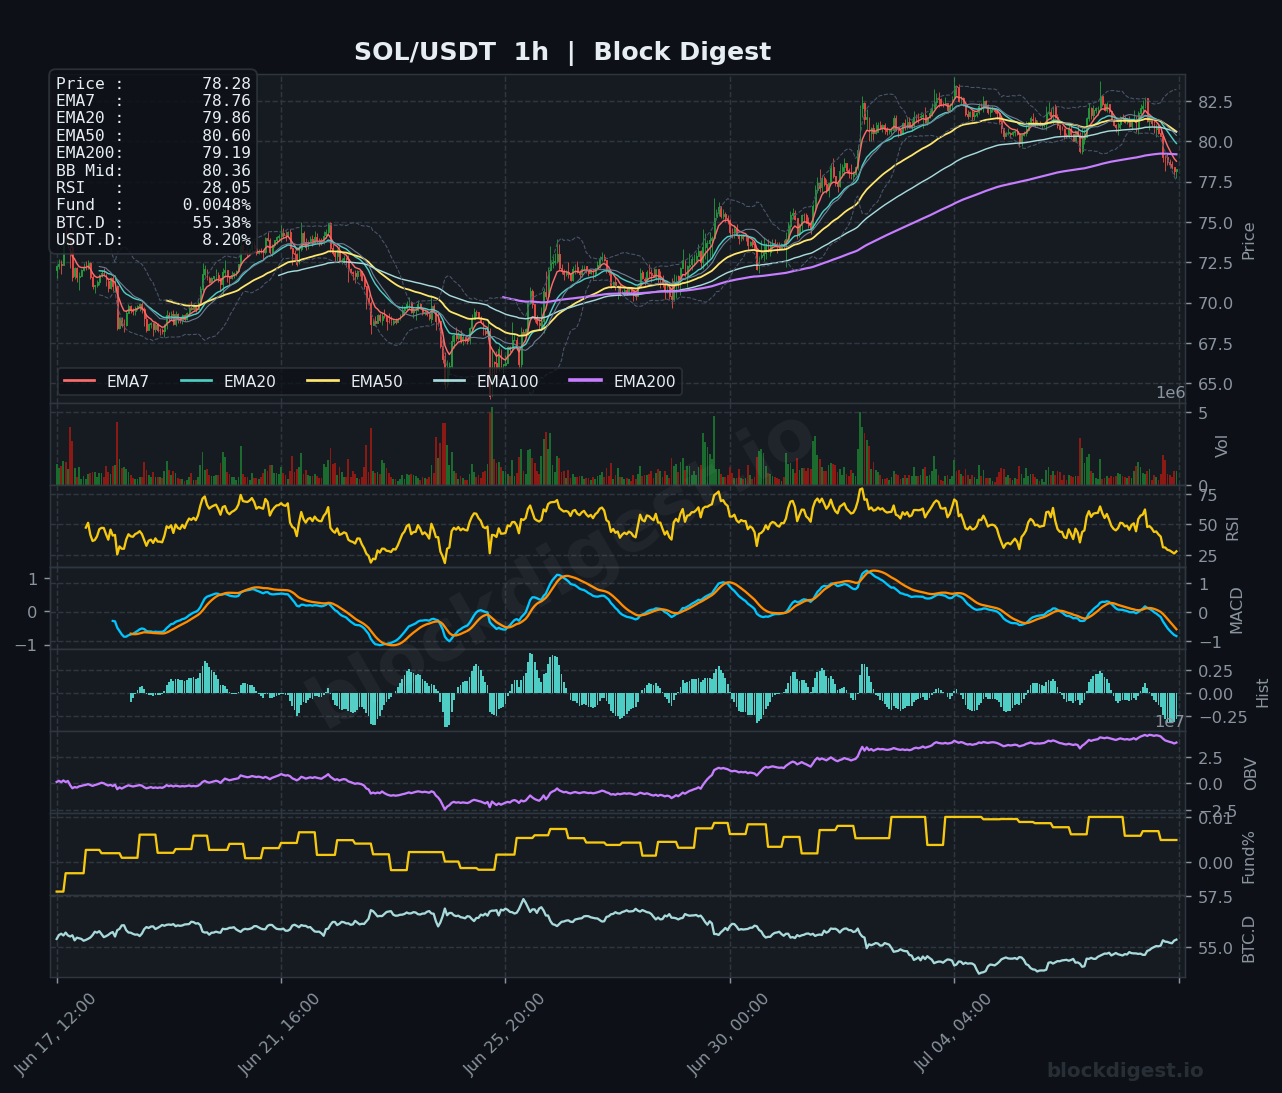
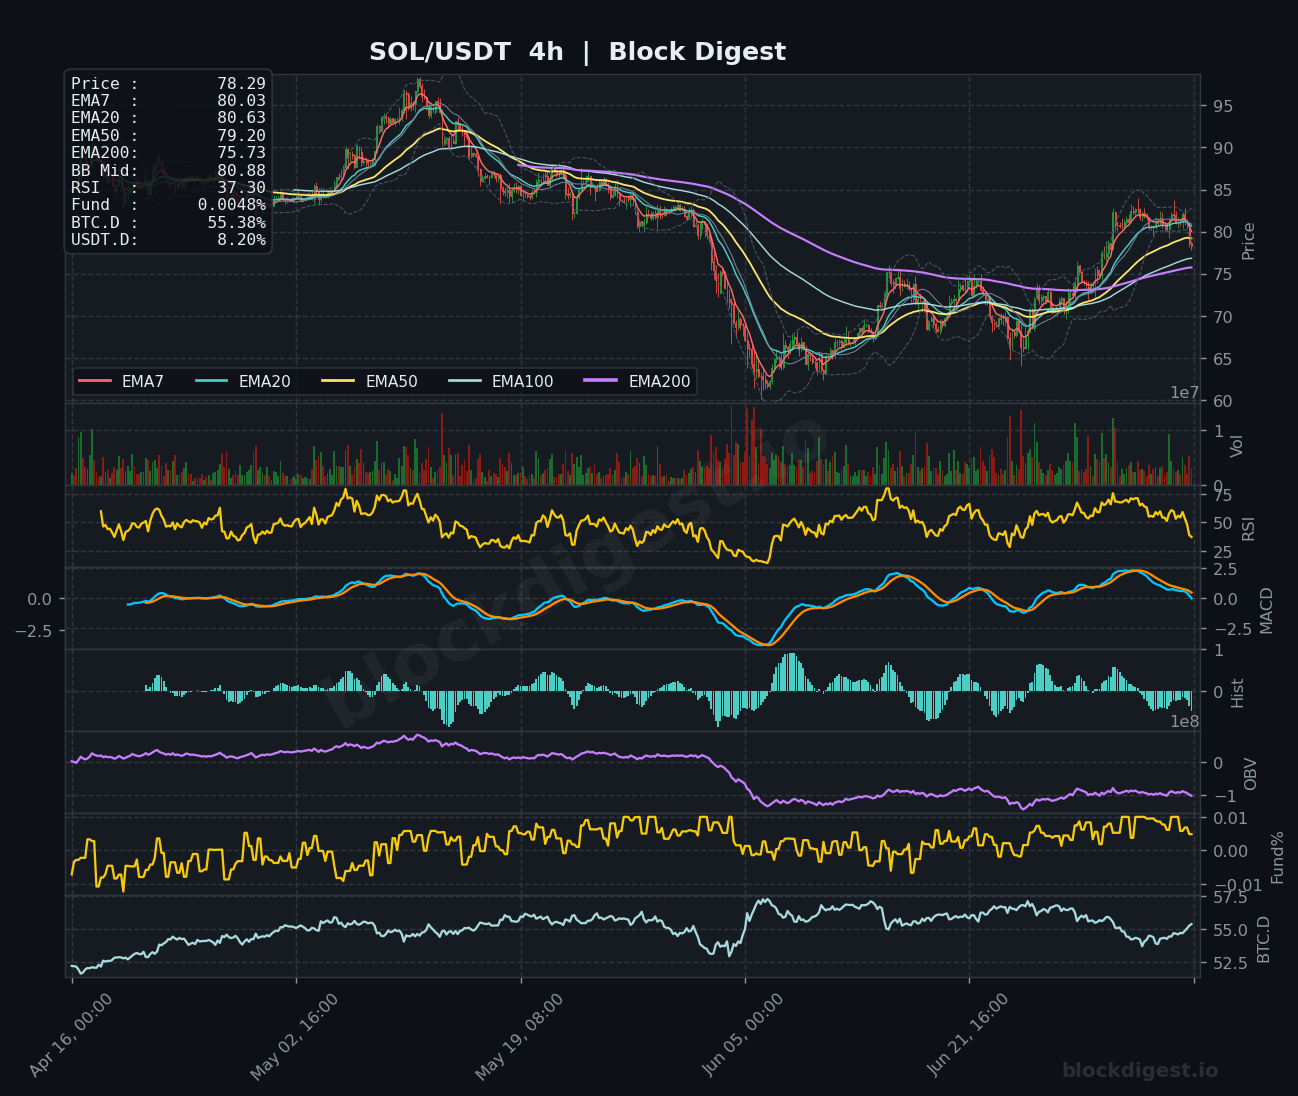
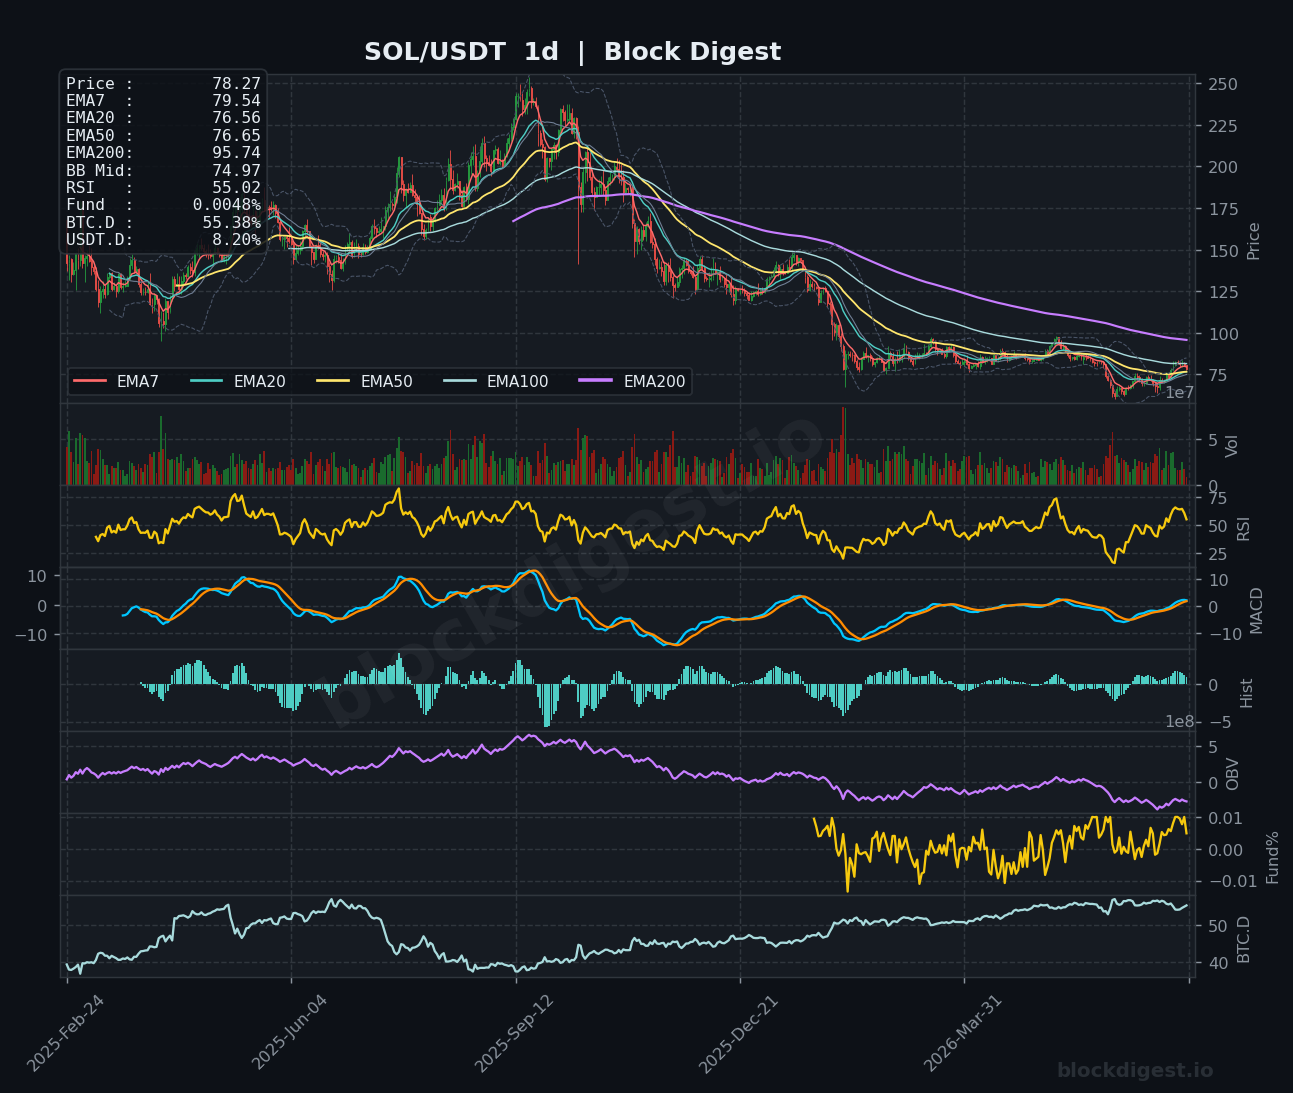
SOL is trading at approximately $78.28 after a sharp intraday pullback from the recent $82–$83 resistance zone, with the 1h RSI dropping to an oversold 28.05 — the most extreme short-term reading across today’s coverage universe. On the 4h chart, price is below all key EMAs (EMA7 at $80.03, EMA20 at $80.63, EMA50 at $79.20), and the MACD remains in bearish territory with a widening histogram, confirming near-term selling pressure. The daily chart offers some structural context: SOL has staged a meaningful recovery off its lows near $65, and the daily RSI at 55.02 is neutral-to-constructive, while the EMA20 ($76.56) and EMA50 ($76.65) are beginning to coil beneath price — a key support cluster to watch. Bias is cautiously bearish short-term, with a bounce candidate emerging near $76–$77; bulls need a reclaim of $80 to restore momentum.
XRP (XRP)
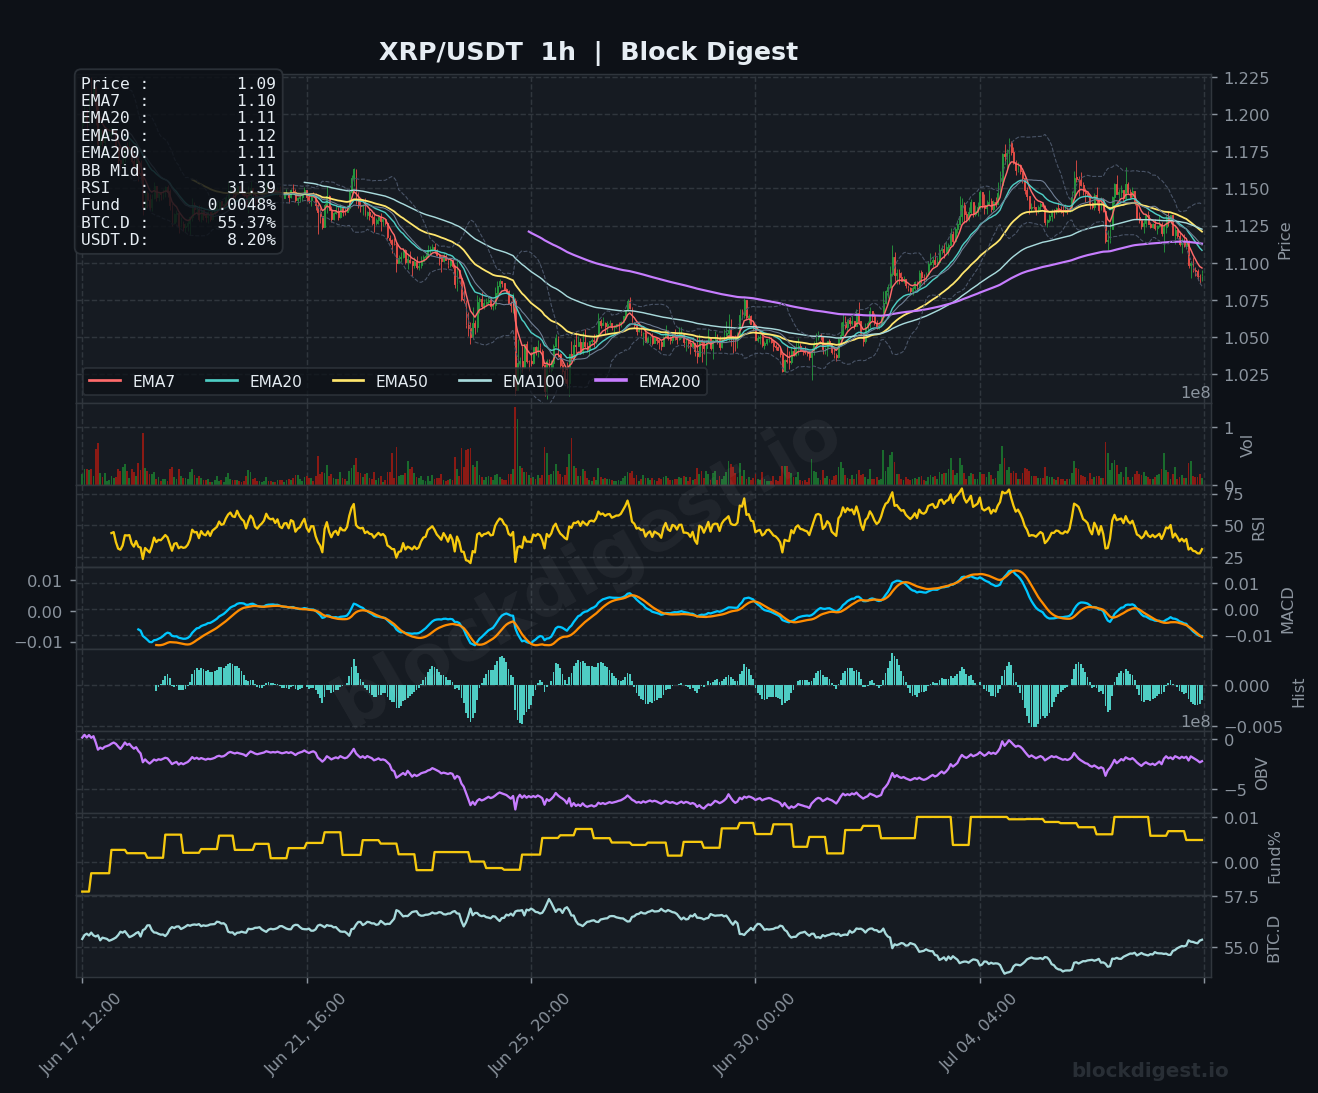
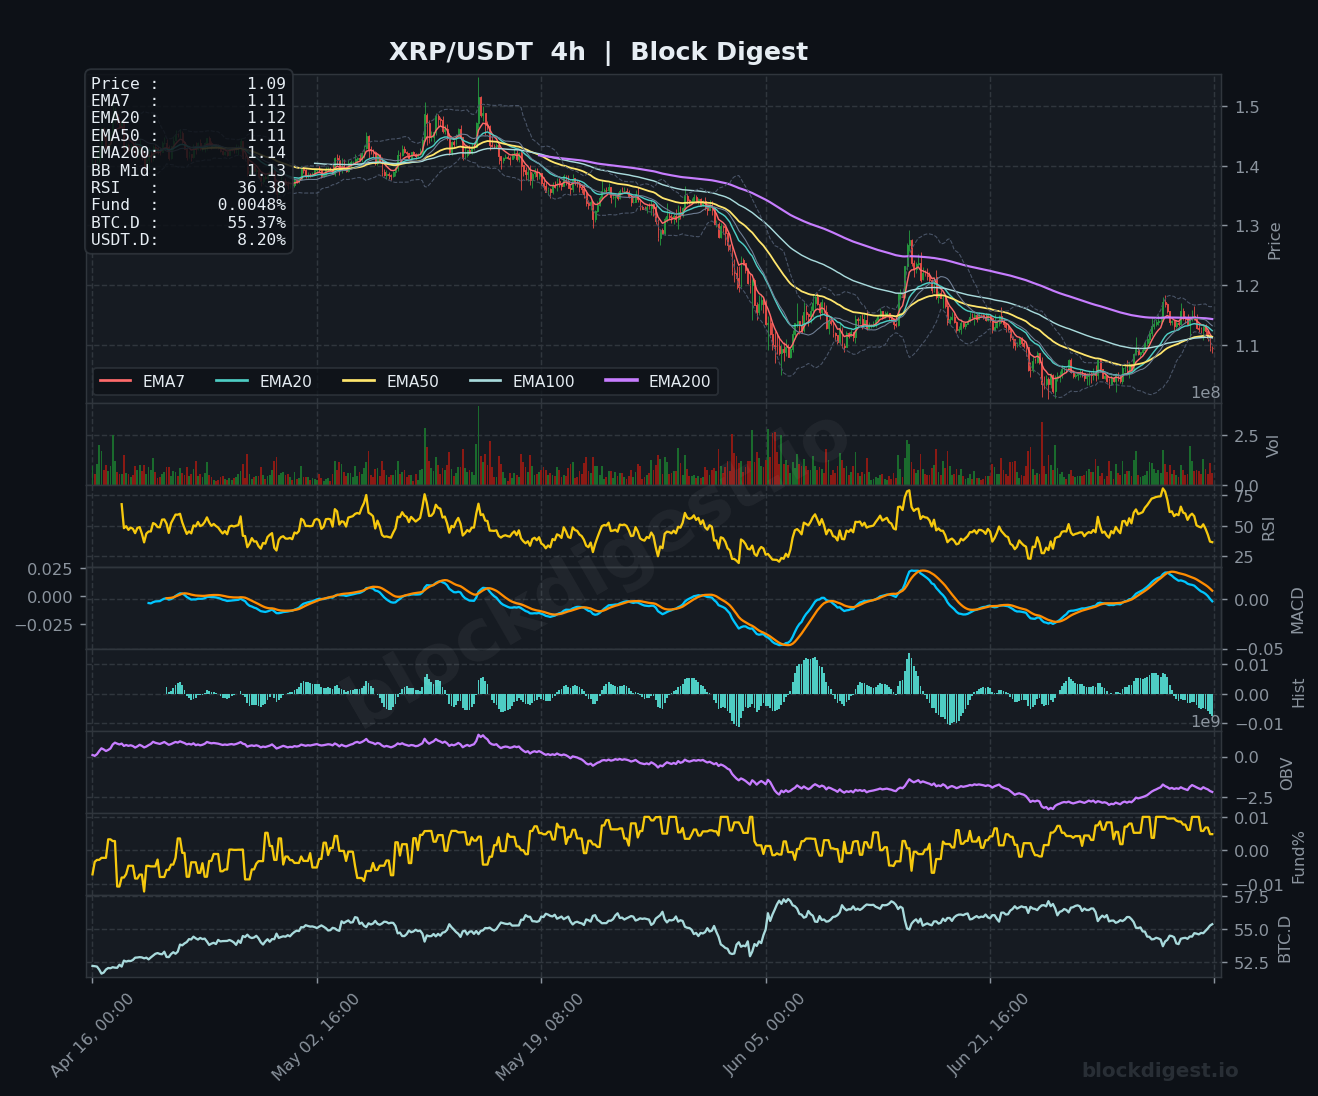
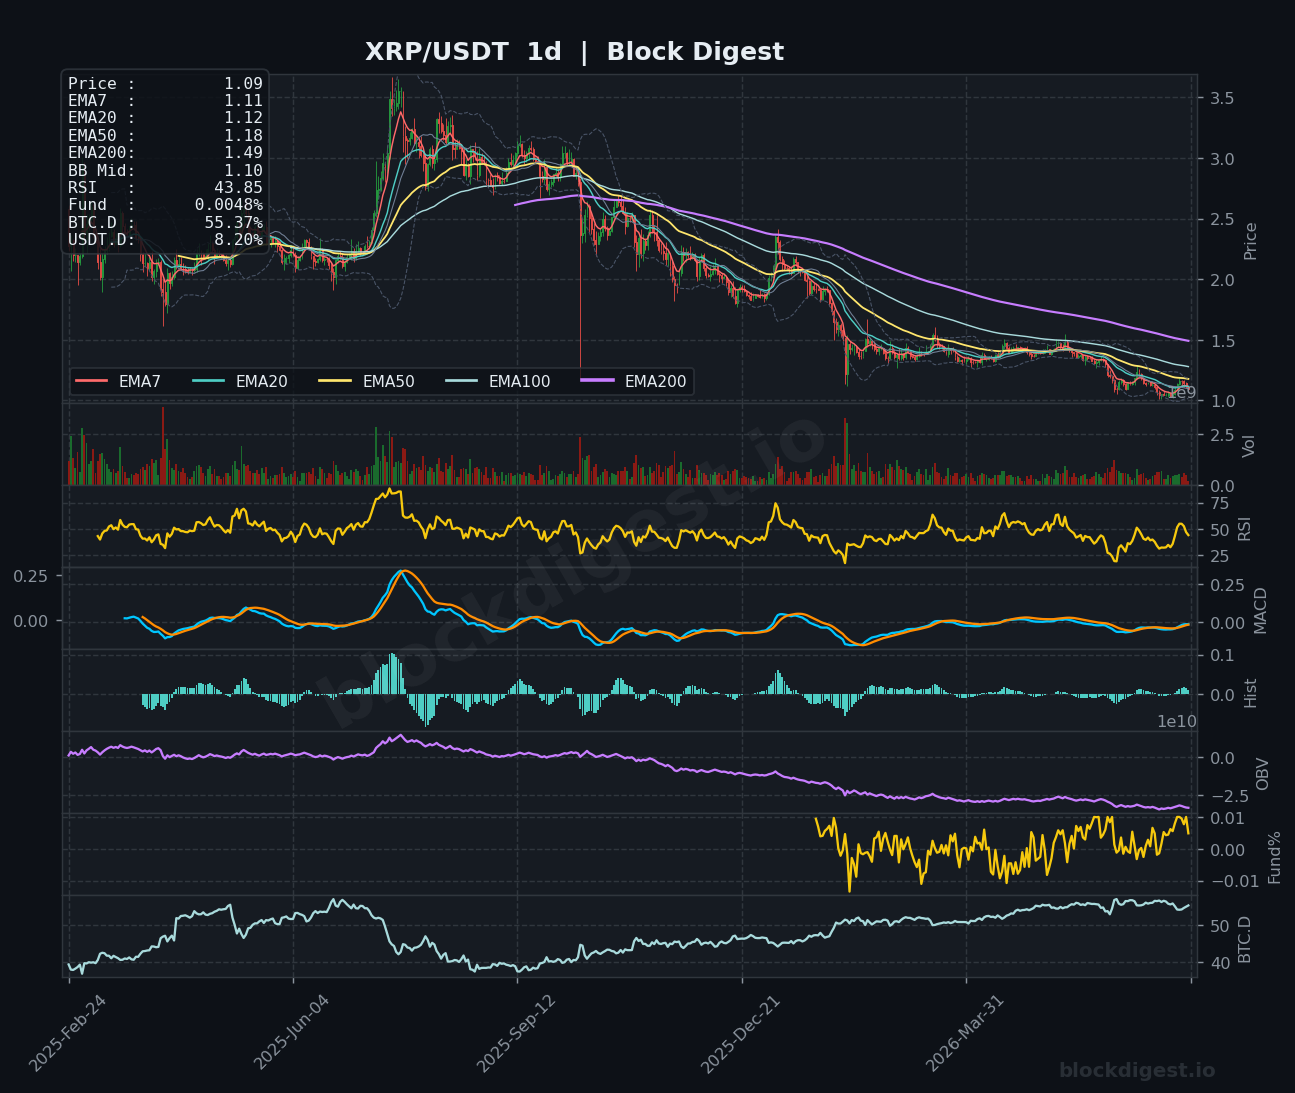
XRP is trading at $1.09, pulling back sharply from its recent high near $1.20 and now trading beneath all key short-term EMAs on the 1h chart (EMA7 $1.10, EMA20 $1.11, EMA50 $1.12), with RSI at a weak 31.39. The 4h structure is broadly bearish, with price trapped below a declining EMA stack and RSI at 36.38 struggling to reclaim the 40 level; the MACD signal line remains below zero after a shallow recovery attempt. On the daily, XRP’s RSI sits at 43.85 with the MACD compressing near zero — neither strongly bullish nor deeply bearish — while the EMA200 at $1.49 looms as a formidable long-term overhead resistance. Despite Ripple’s recent Luxembourg CASP regulatory authorization providing a fundamental tailwind, the near-term technical picture is bearish, with $1.05–$1.07 acting as the next meaningful support if sellers maintain control.
BNB (BNB)
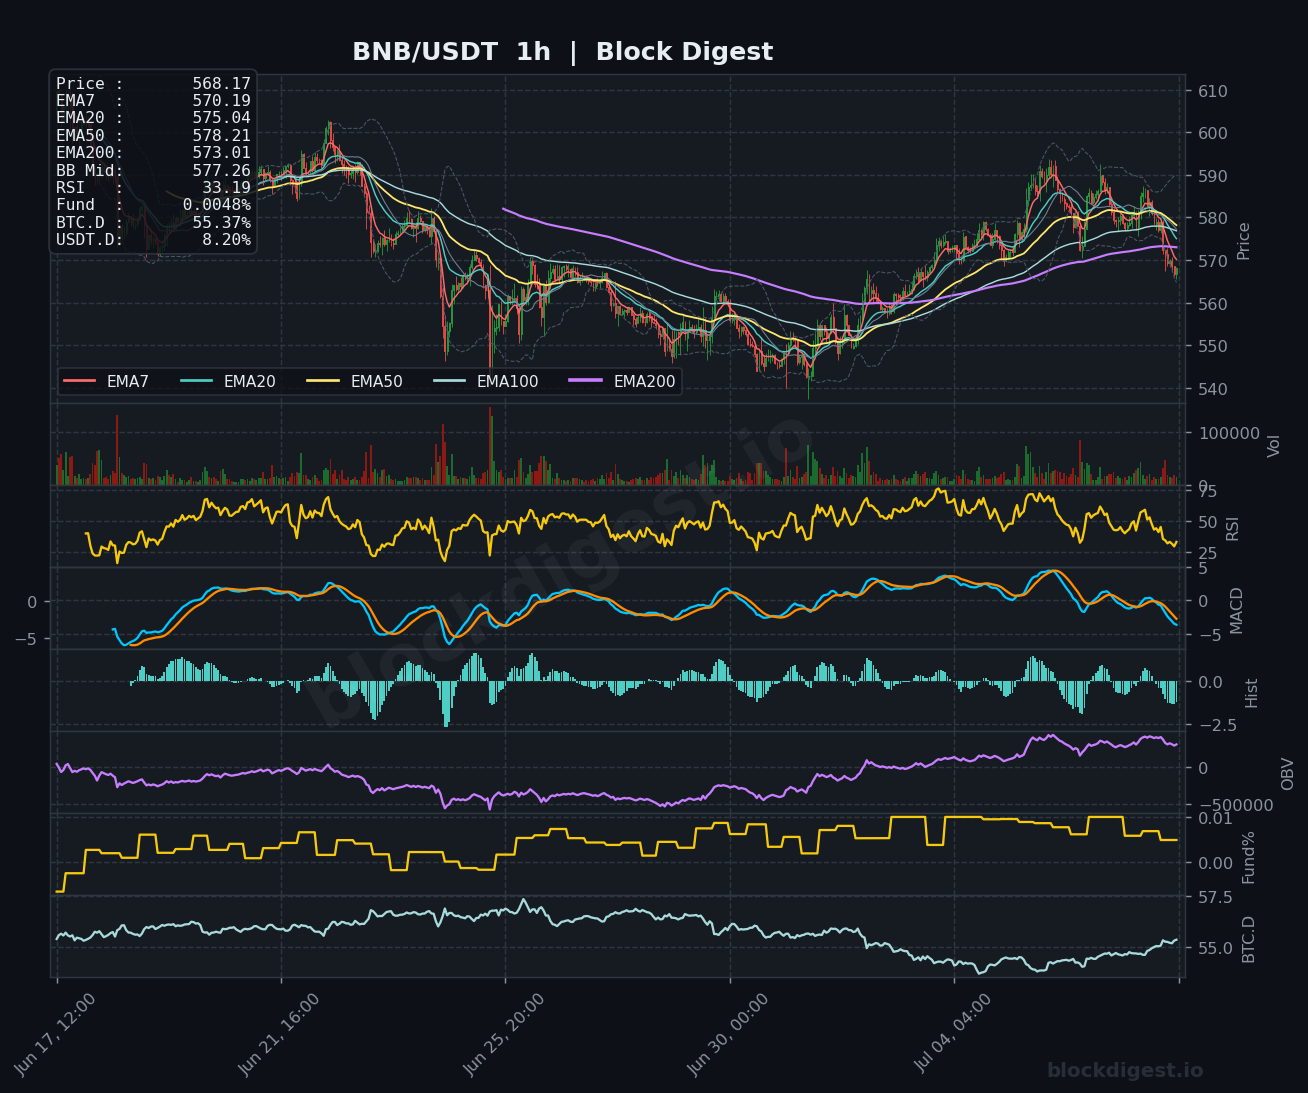
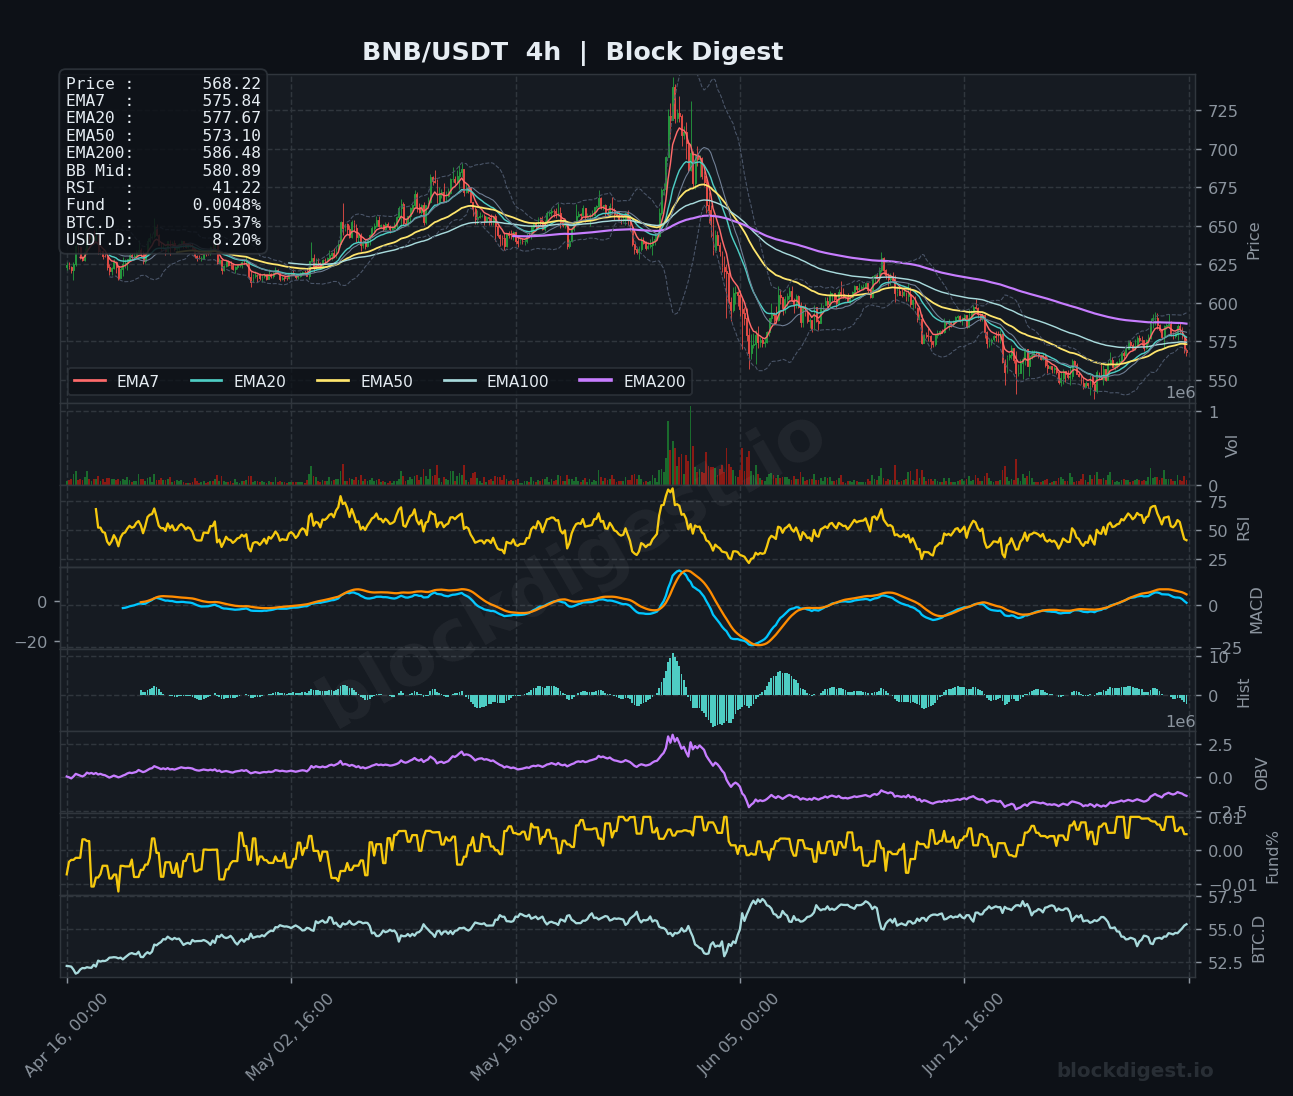
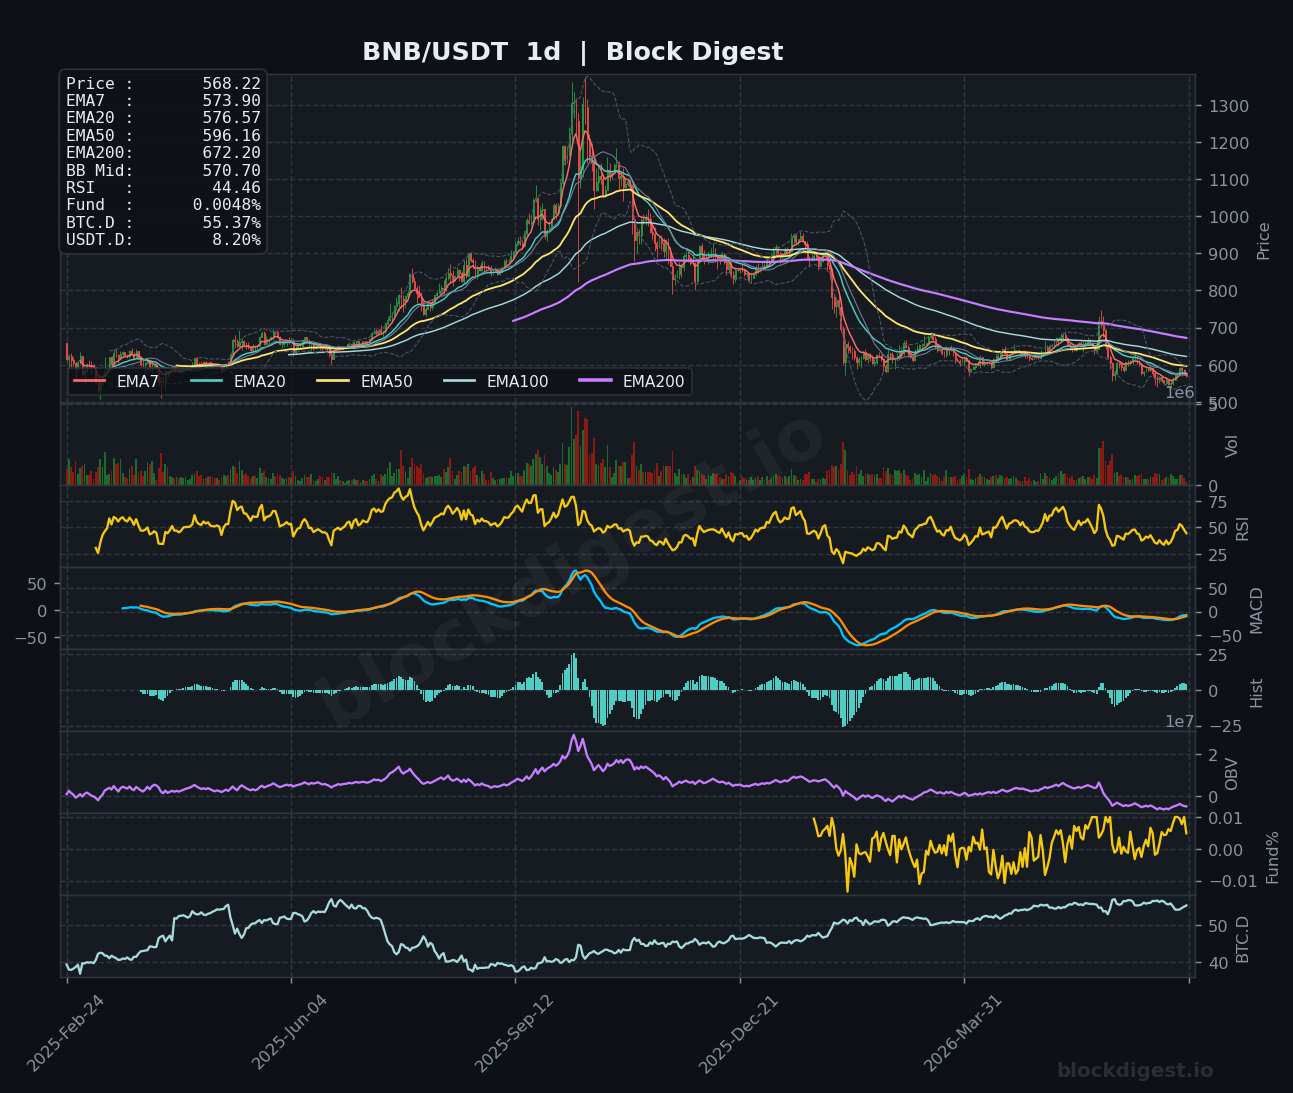
BNB is trading at approximately $568, slipping below the $570–$575 support cluster after a modest recovery from its multi-week lows near $545. The 1h chart shows RSI at 33.19 — nearing oversold territory — with price below all short-term EMAs and the MACD crossing back into negative histogram territory, suggesting the intraday bounce has faded. On the 4h timeframe, RSI at 41.22 shows improving but still-subdued momentum, and while the MACD signal has gradually crept back toward zero from deeply negative levels, the overall EMA structure remains bearish with the EMA200 at $586 acting as formidable overhead resistance. The daily chart reveals BNB is still firmly in a longer-term downtrend from its highs above $700, with the daily RSI at 44.46 and price well below the EMA50 ($596) and EMA200 ($672); a sustained hold above $570 is needed to avoid revisiting the $545–$550 floor.
Dogecoin (DOGE)
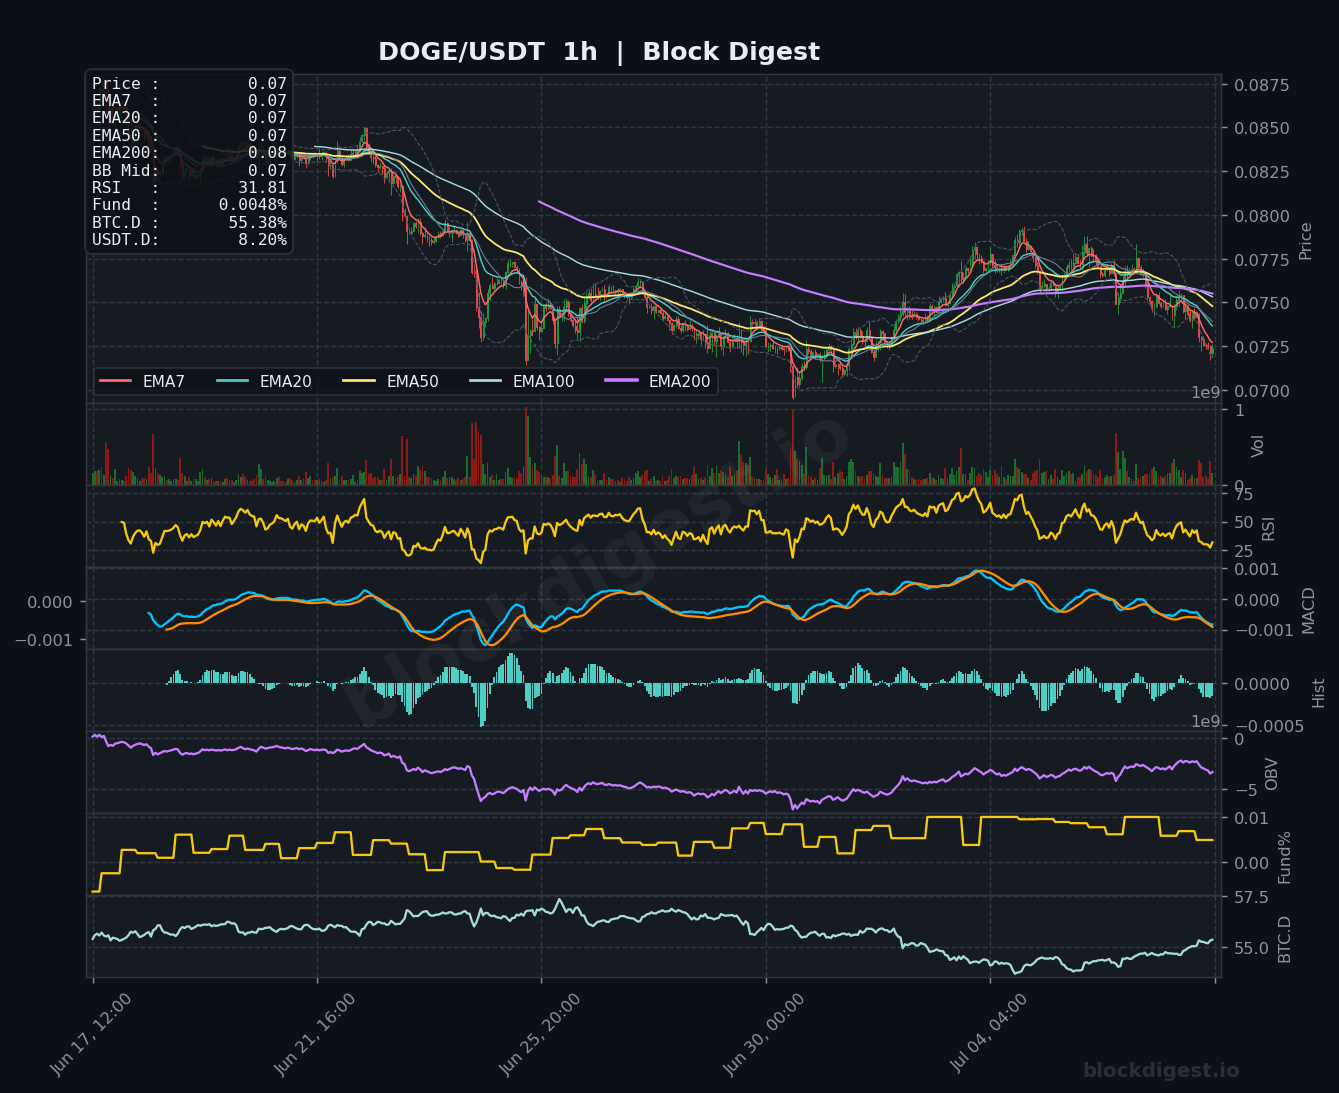
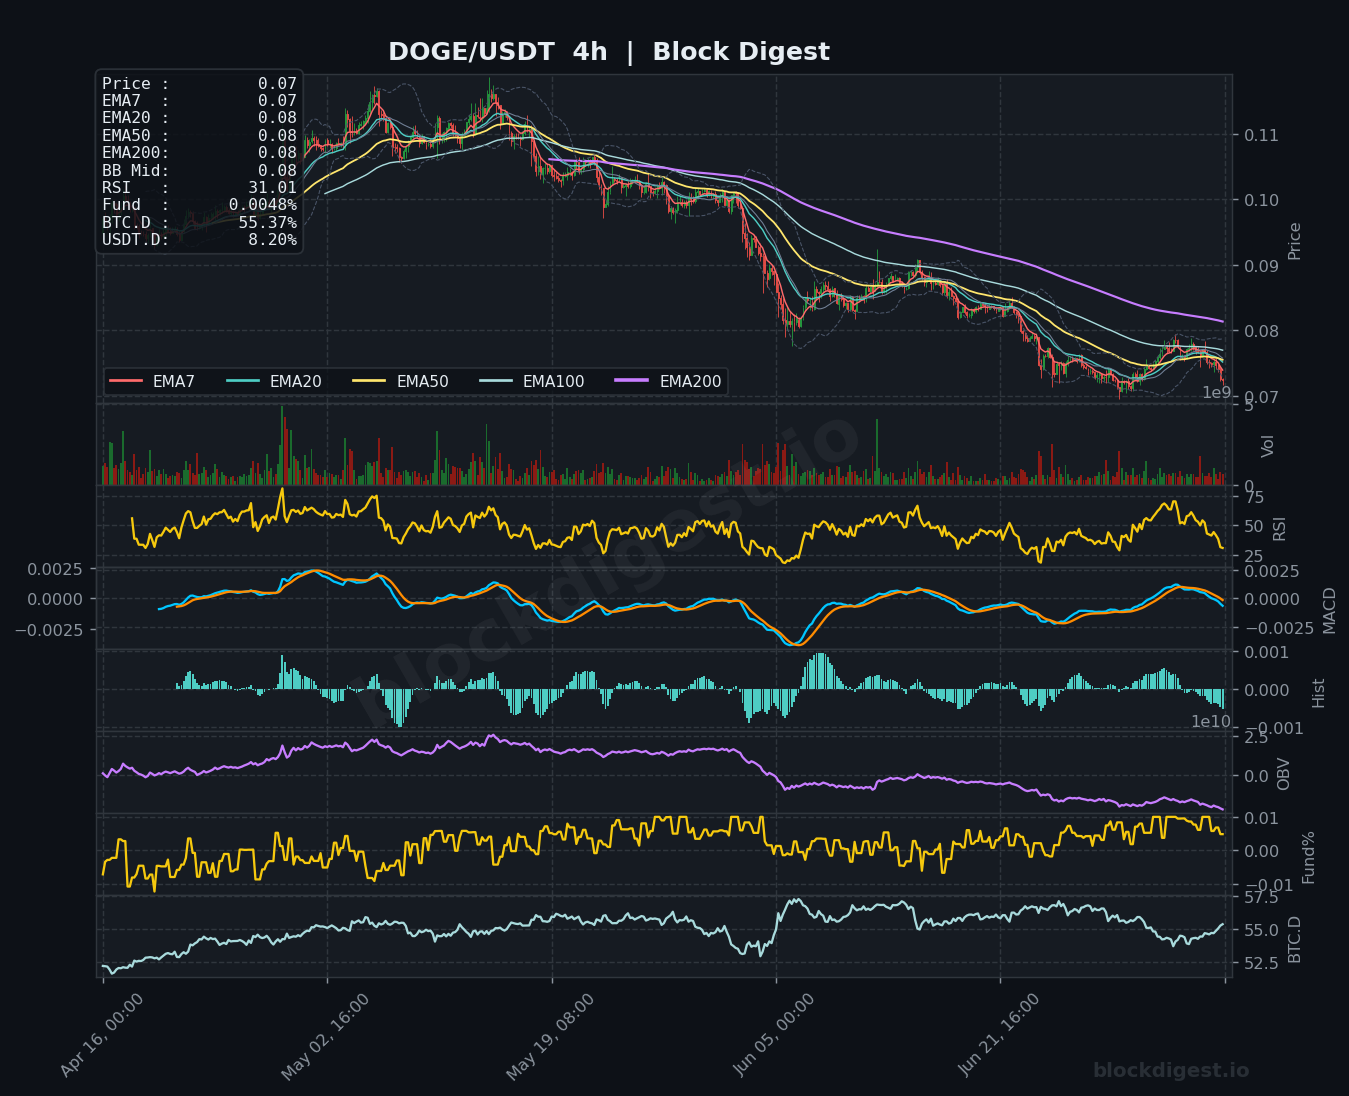
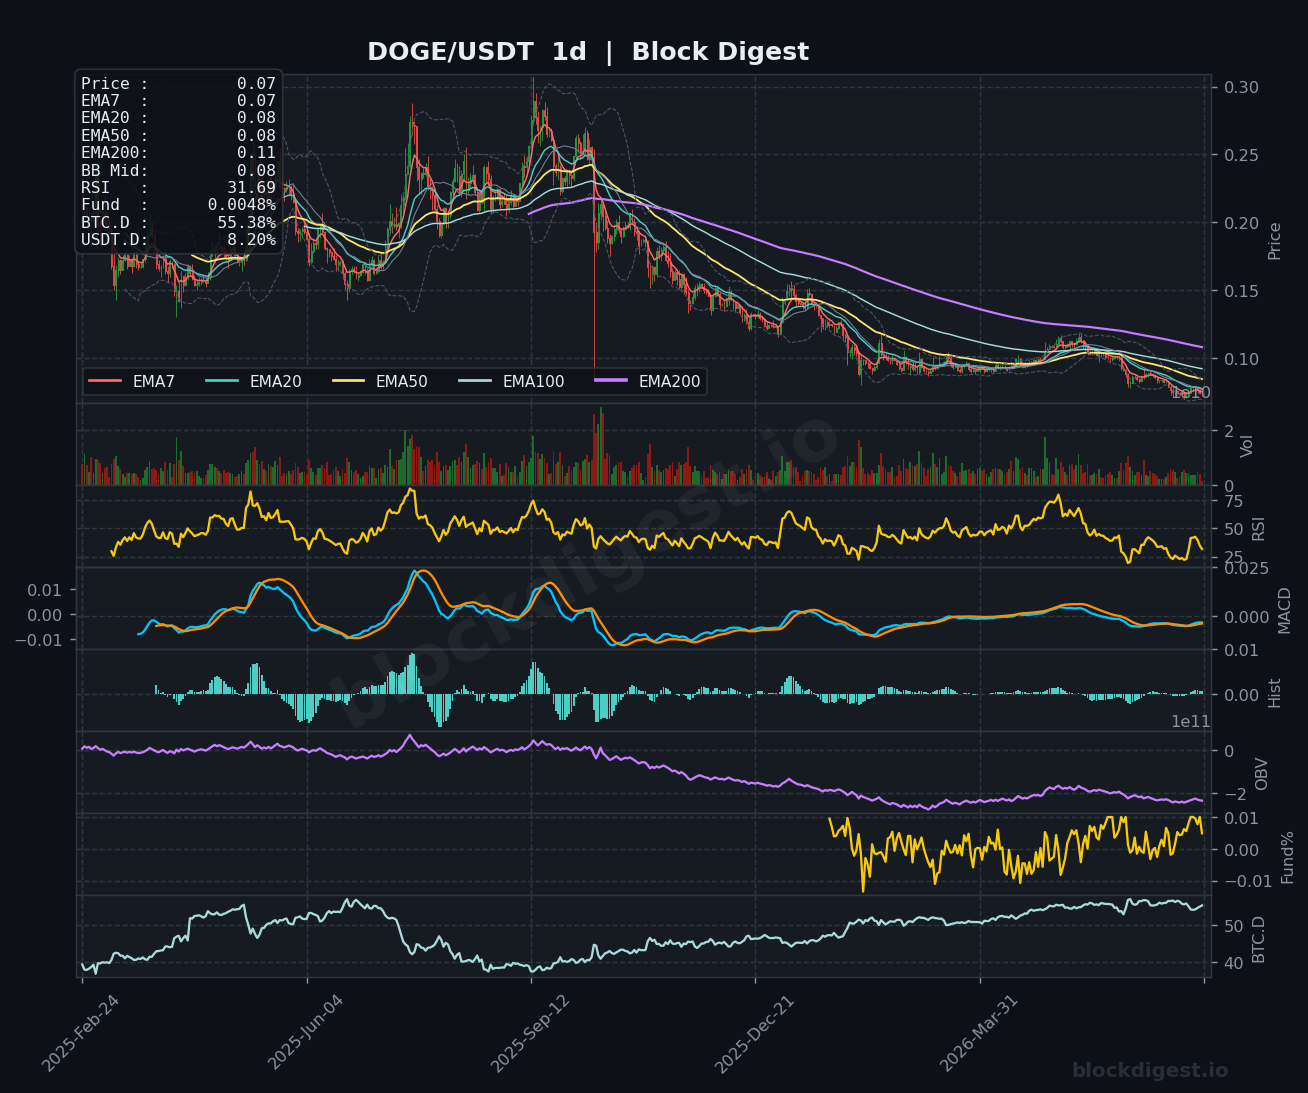
DOGE is trading at $0.0747, registering one of the weakest technical pictures across today’s coverage set with RSI readings near or below 32 across all three timeframes. The 1h chart shows price collapsing back through a full EMA stack, with the MACD crossing into bearish divergence and the histogram flipping red — signaling fresh short-term selling momentum. On the 4h, DOGE has been in a sustained downtrend since its peak above $0.11, and the current RSI of 31.01 is approaching oversold on a medium-term basis; however, the OBV trend remains decisively negative, indicating distribution rather than accumulation. The daily chart confirms a deeply bearish macro structure with DOGE sitting below all major moving averages and the EMA200 at $0.11 representing an extremely distant recovery target; near-term support is seen at $0.0700–$0.0720, and the short-term bias remains bearish with limited recovery catalysts visible.
Litecoin (LTC)
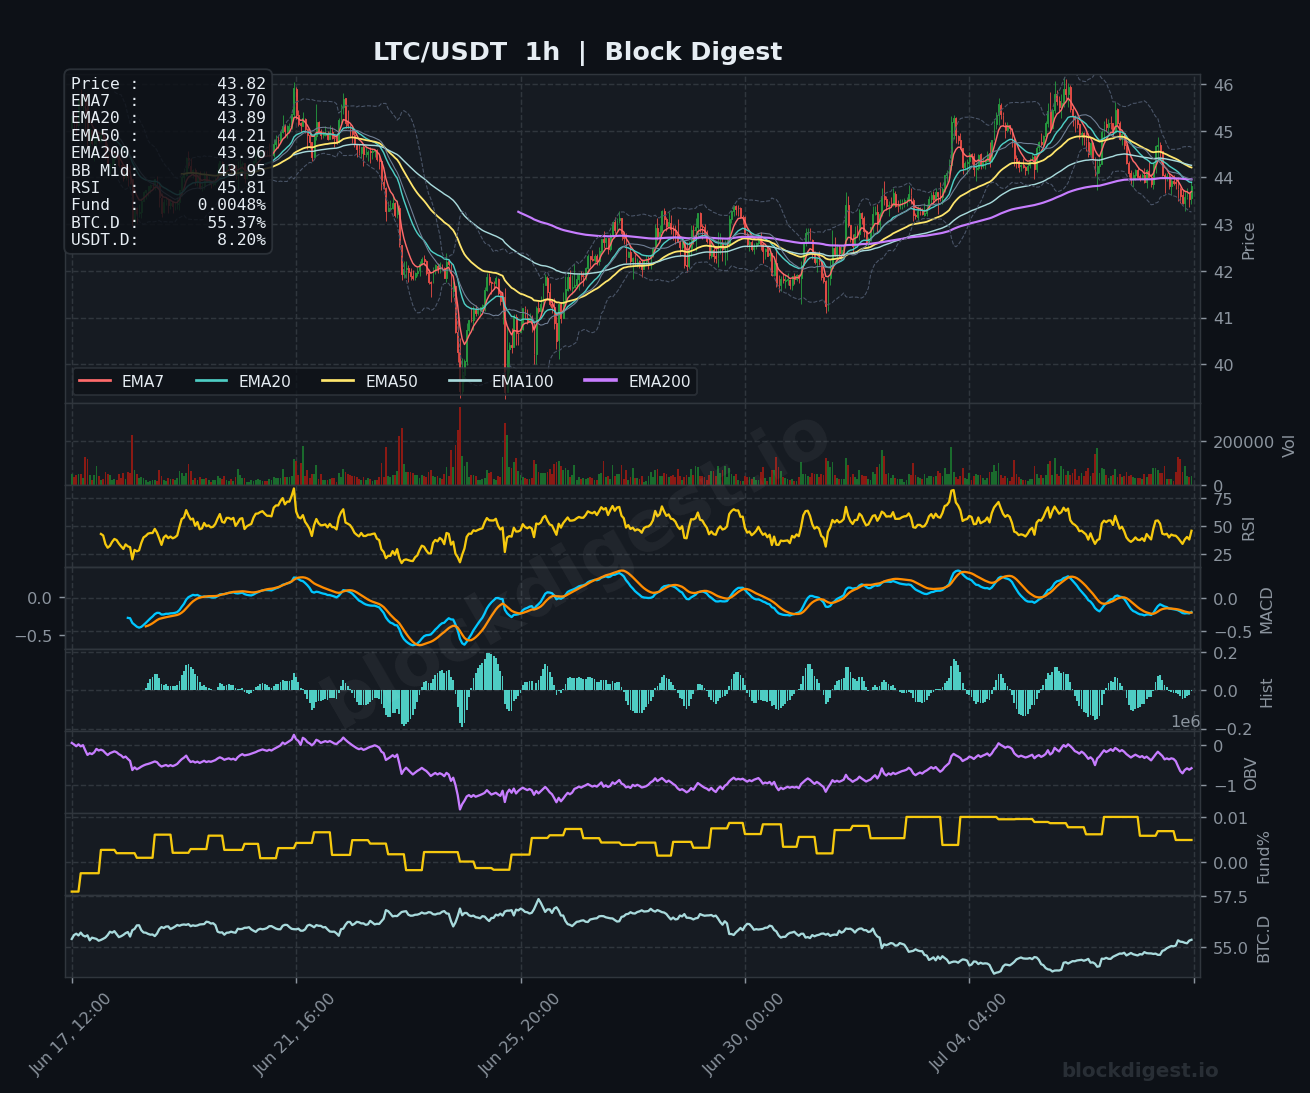
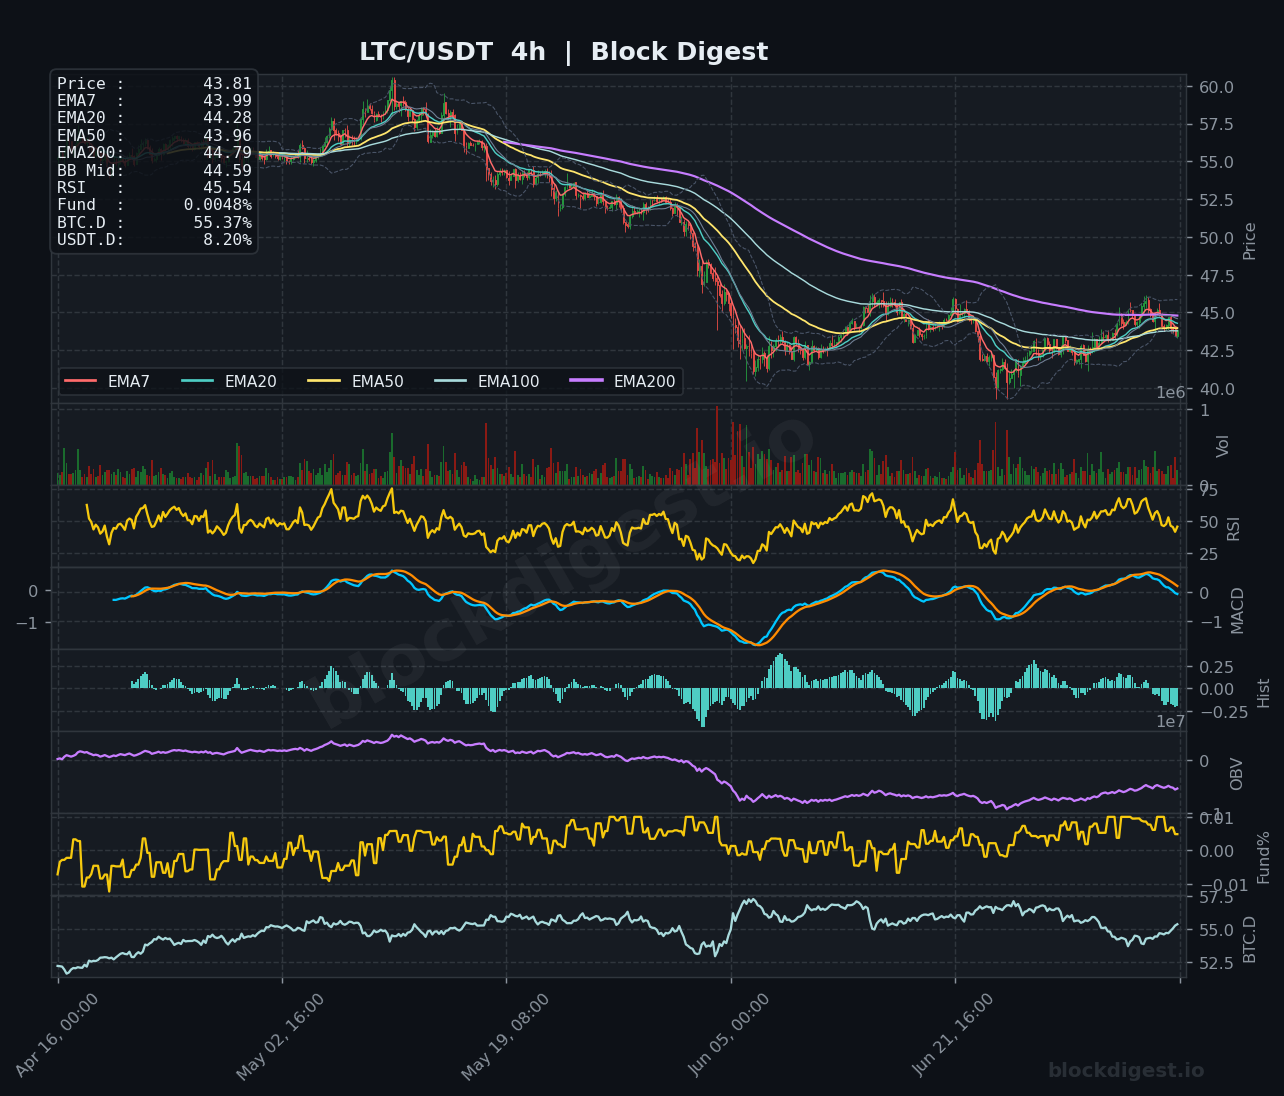
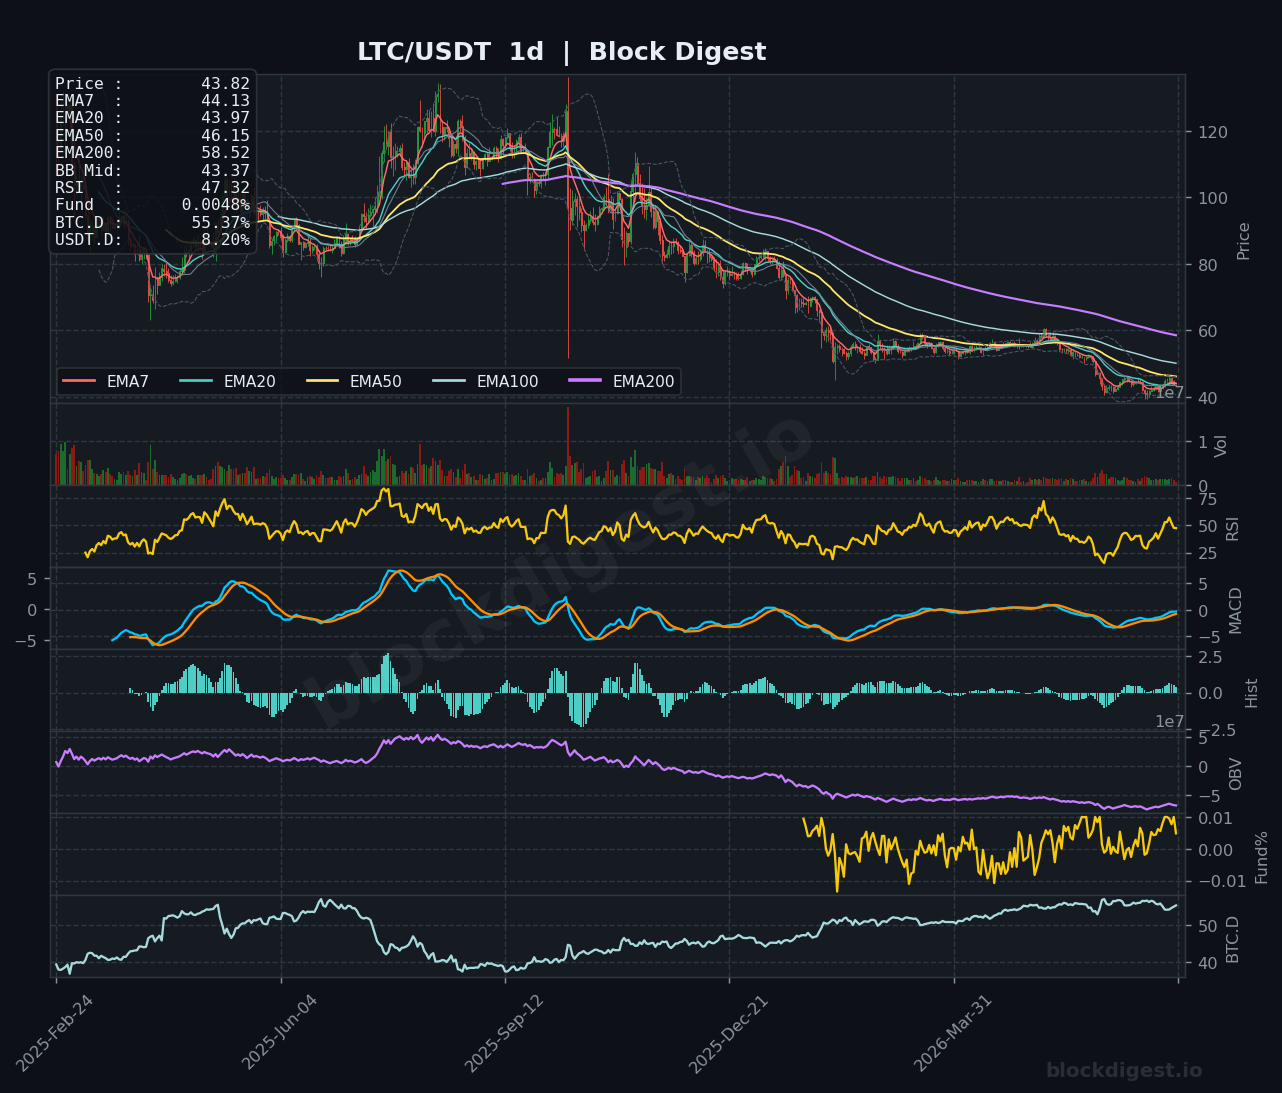
LTC is trading at $43.82, caught in a narrow consolidation range as the 1h chart shows RSI at 45.81 — the most balanced short-term reading in today’s set — and price sitting just beneath a tight EMA cluster (EMA7 $43.70, EMA20 $43.89, EMA50 $44.21). The 4h chart shows a MACD that has recovered from deeply negative territory and is now approaching the zero line, with RSI at 45.54 suggesting momentum is rebuilding without yet confirming a bullish bias; the $44.50–$45.00 zone represents immediate overhead resistance. On the daily, LTC’s RSI is neutral at 47.32 and the MACD histogram is showing small positive bars as the signal lines attempt a crossover — a potentially constructive development if sustained. Key levels to watch are $42.00 support below and $46.00–$47.00 resistance above; LTC’s relatively contained RSI readings across all timeframes suggest it is the most range-bound of today’s covered assets.
TRON (TRX)
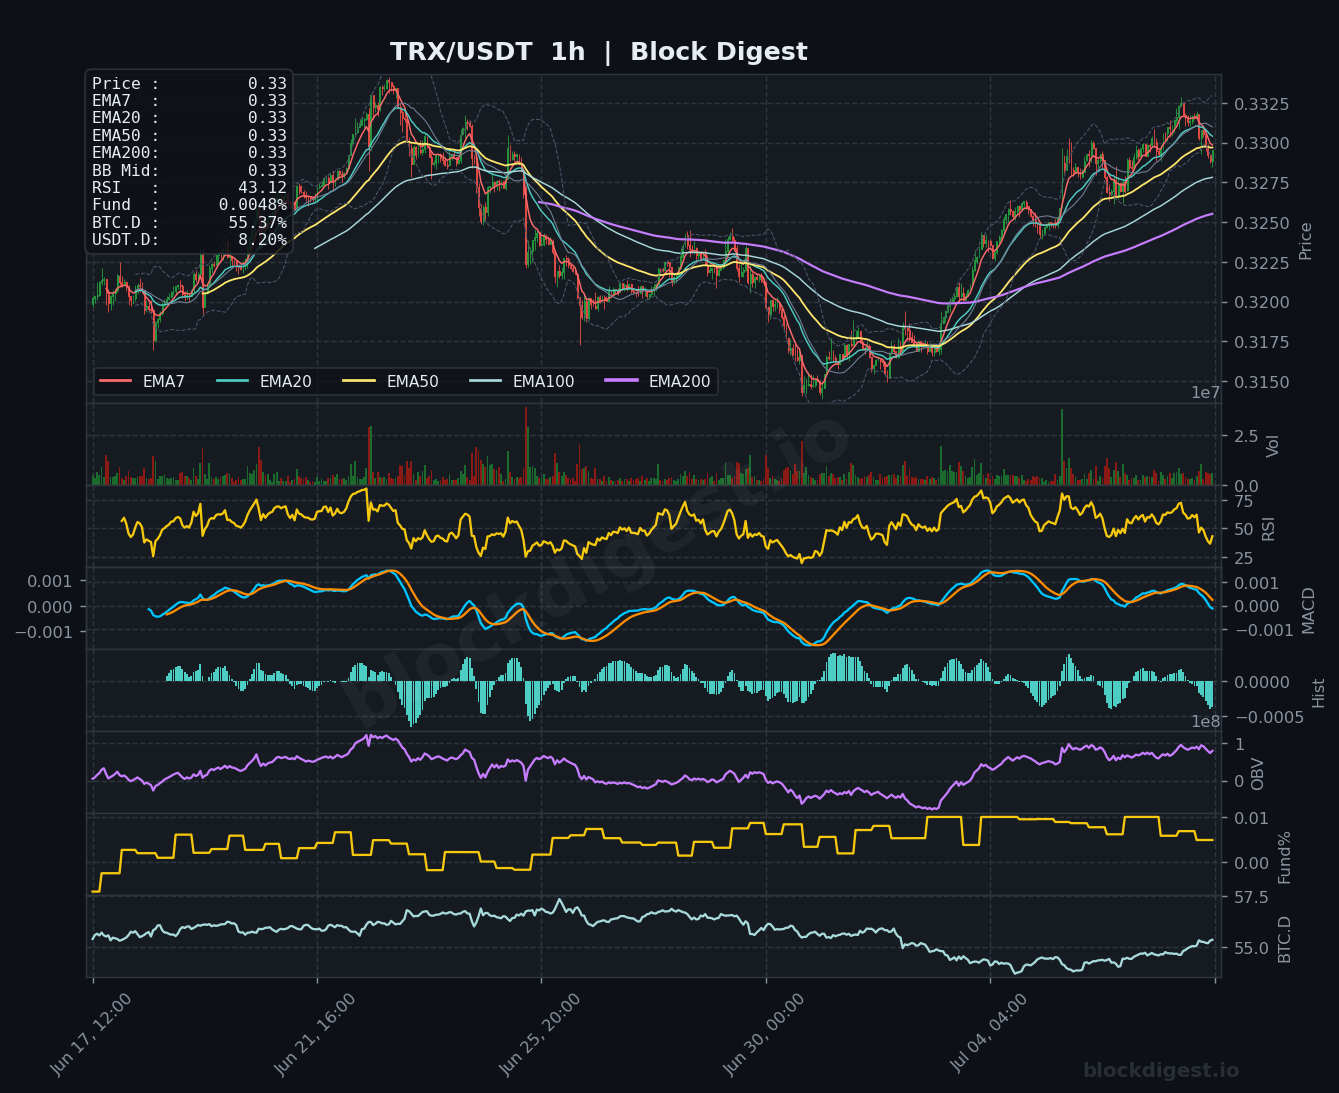
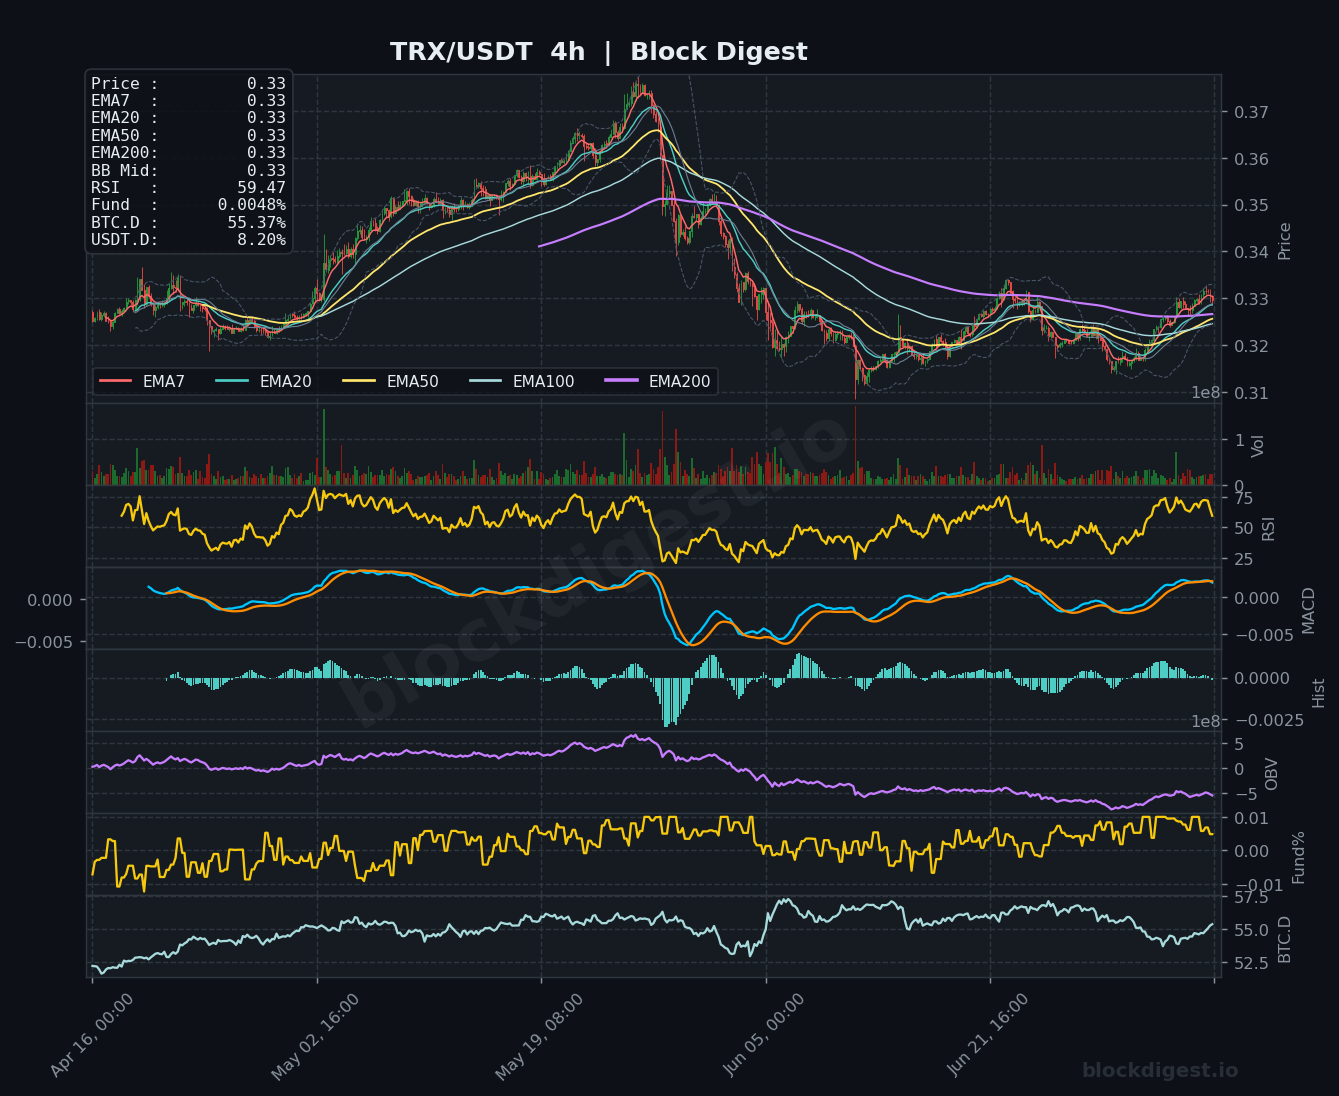
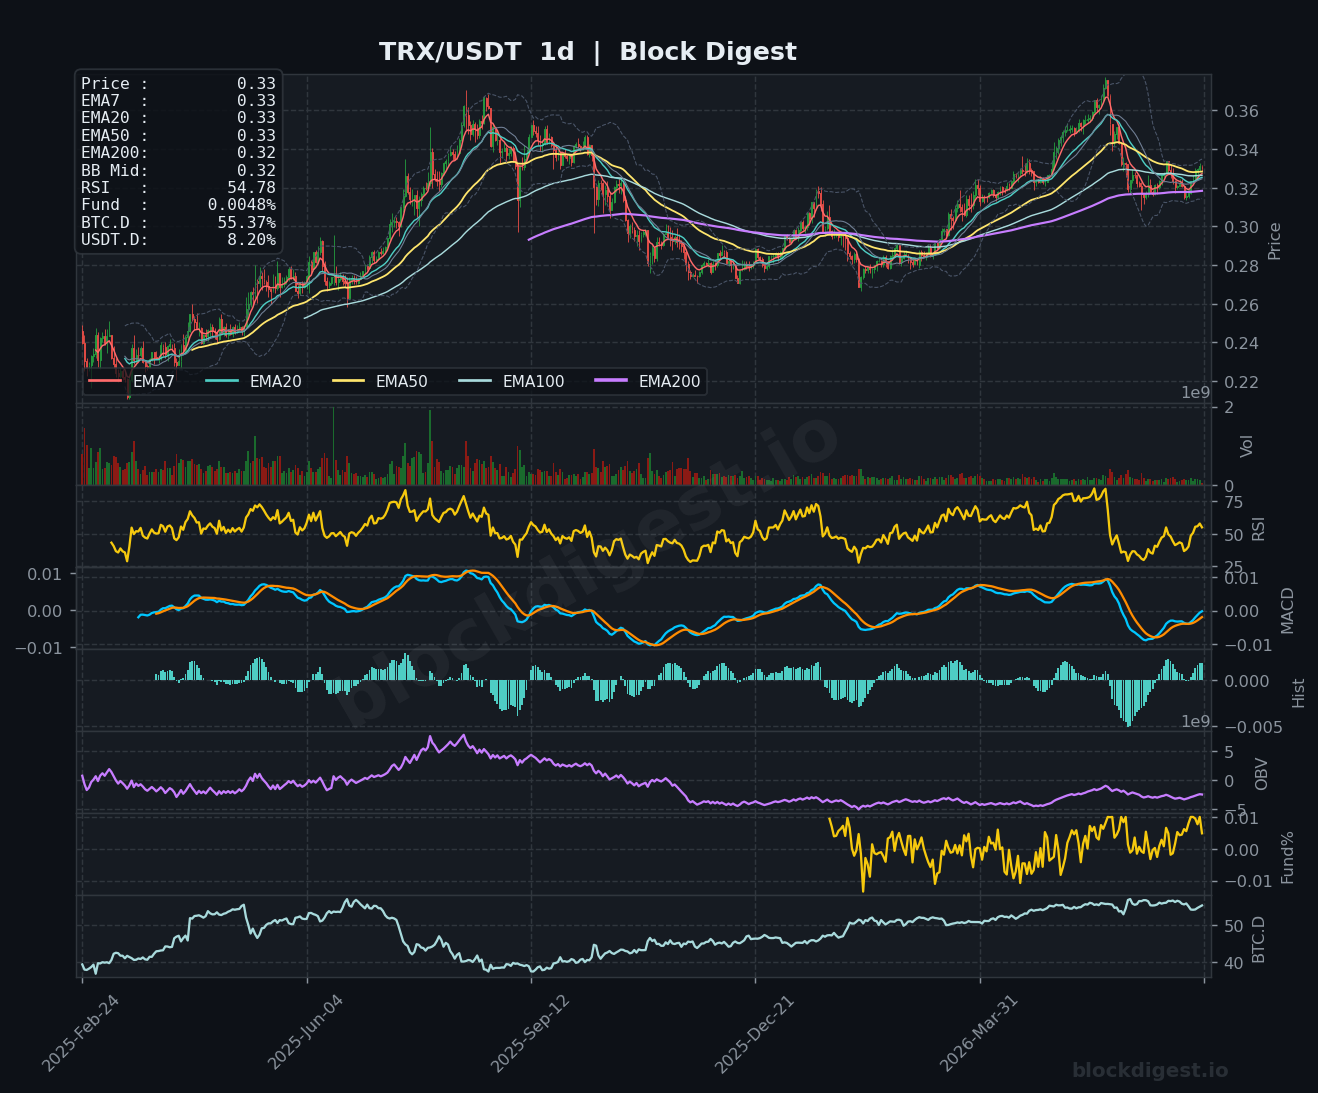
TRX stands out as the relative outperformer in today’s roundup, trading at $0.33 with a daily RSI of 54.78 — comfortably in neutral-to-bullish territory and the strongest daily reading across the group. The 1h chart shows RSI at 43.12 with the MACD making a mild bearish cross, indicating a short-term pause in a broader recovery, while the price is holding above the rising EMA200 ($0.3275 area) — a constructive technical sign. The 4h MACD has gradually recovered from its trough and is now narrowing toward zero with a slightly positive histogram reading, and RSI at 59.47 suggests room remains before overbought conditions are reached. OBV on the daily timeframe has been recovering steadily, and TRX’s EMA structure on the daily shows a bullish alignment with EMA20, EMA50, and EMA200 all clustered near current prices; near-term bias is mildly bullish with support at $0.3150 and resistance at $0.3350–$0.3400.
Altcoin Outlook
Today’s altcoin landscape is broadly mixed-to-bearish, with most assets experiencing short-term pullbacks and oversold RSI readings on lower timeframes following a period of recovery from multi-month lows. TRON presents the strongest technical setup across all timeframes, with a recovering MACD, constructive daily RSI, and relative price stability, while DOGE carries the weakest structure — deeply negative OBV, oversold momentum metrics, and no clear base-building behavior. SOL’s 1h RSI near 28 makes it a near-term mean-reversion candidate, but any recovery is contingent on BTC dominance easing and USDT.D retreating below the 8% threshold to unlock broader altcoin capital flows. Traders should watch the $76–$77 SOL support, $1.05 XRP floor, and $0.0700 DOGE support as bellwether levels — a simultaneous hold across these would suggest the broader altcoin structure is stabilizing ahead of a potential next leg.
Disclaimer: This analysis is for informational purposes only and does not constitute financial advice. Cryptocurrency markets are highly volatile and unpredictable. All trading decisions should be made based on your own research and risk tolerance. Block Digest is not responsible for any financial losses incurred as a result of acting on this content.
Stay Ahead of the Market
Follow BlockDigest for crypto market intelligence, research and real-time updates.


