
Market Overview
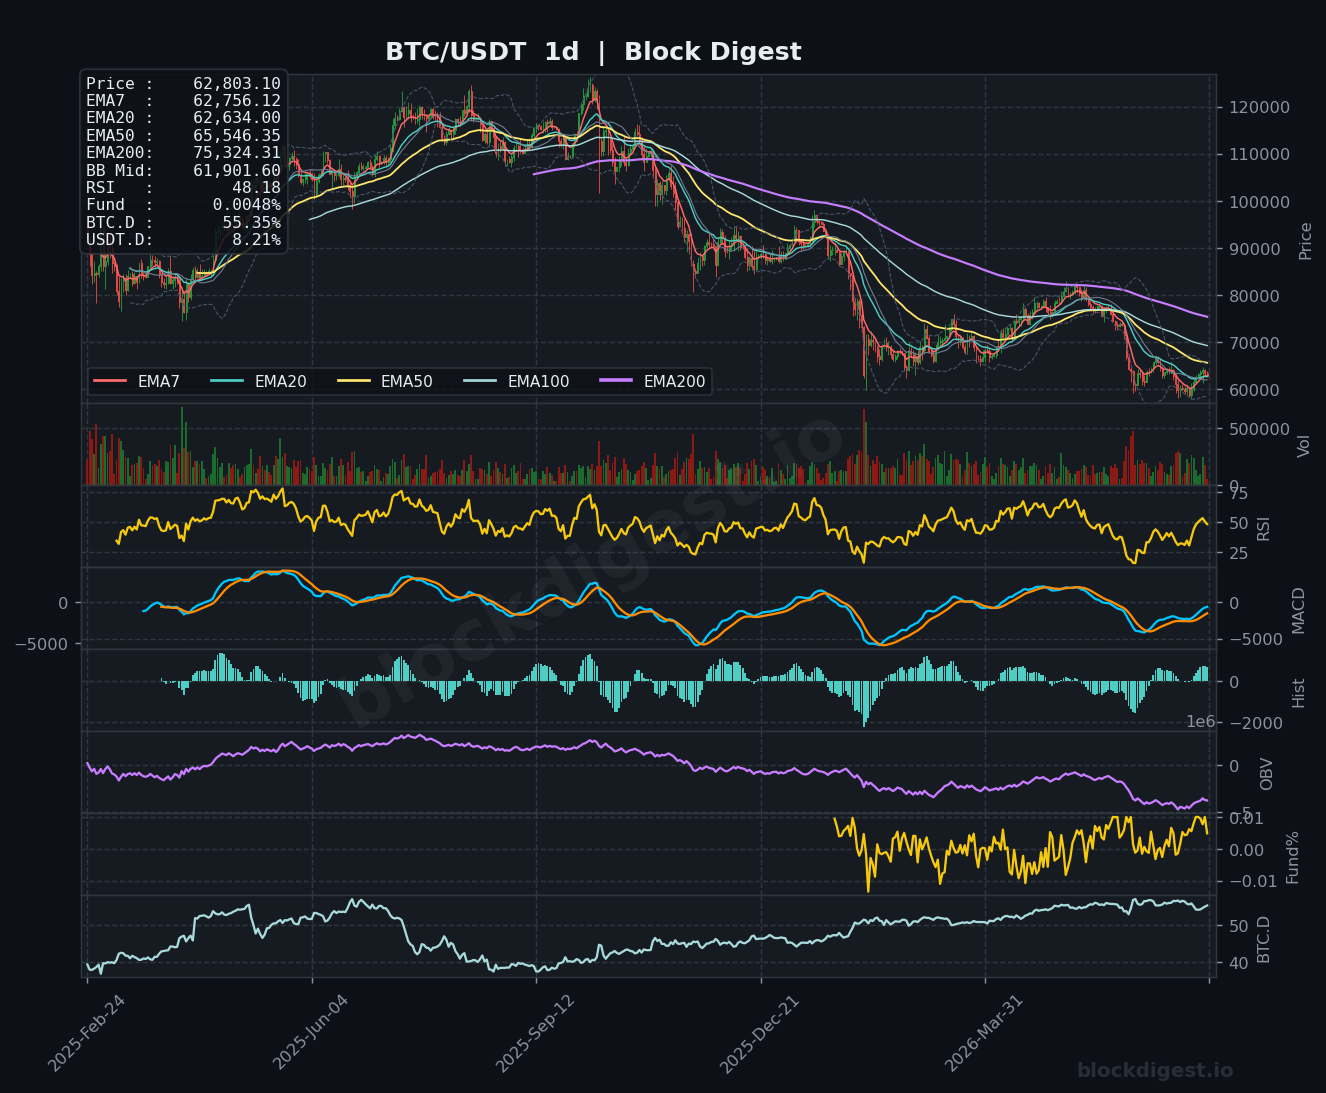
Bitcoin is currently trading at approximately $62,807, situated in a technically precarious position roughly 50% below its all-time high of $126,210 set in October 2025. On the daily timeframe, price action reflects a prolonged downtrend from those peak levels, with BTC now attempting a short-term recovery after finding a local bottom near the $58,000–$59,000 zone. Price is trading above the daily EMA7 ($62,756) and EMA20 ($62,634), suggesting a nascent short-term recovery attempt, but remains well below the EMA50 ($65,546) and the EMA200 ($75,324), which act as formidable overhead resistance. The daily Bollinger Band midline sits at $61,901, and price is currently pushing above it — a mild positive signal, though the broader band structure reflects continued compression and indecision.
Multi-Timeframe Confluence
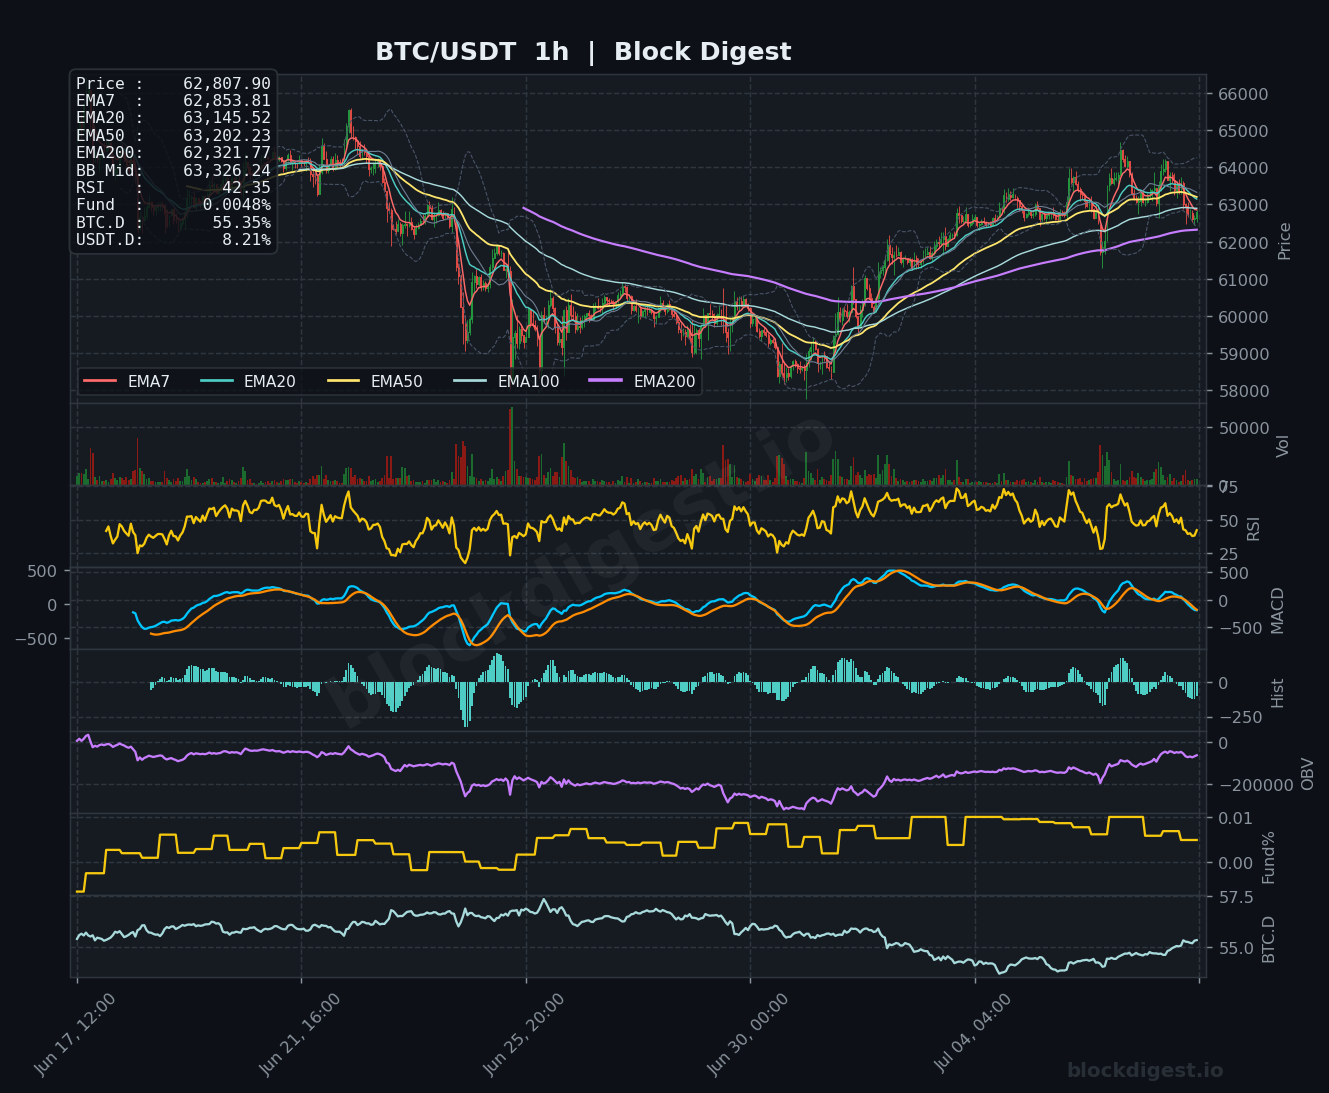
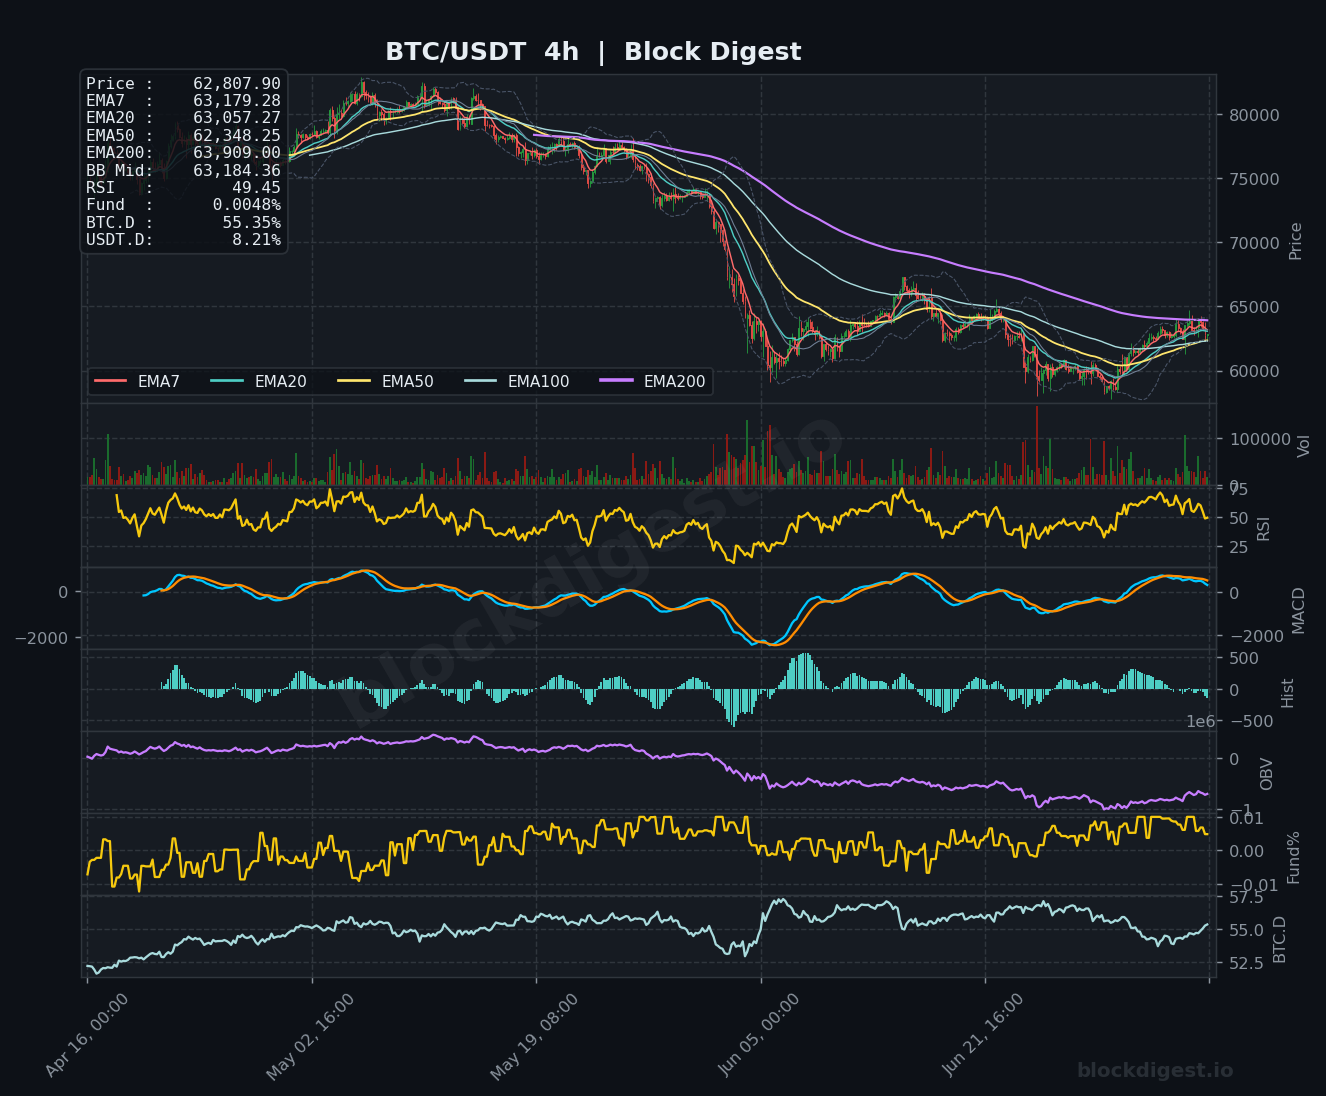
Across all three timeframes, the dominant macro structure remains bearish, with price trading beneath all major EMAs on the 4h and daily charts. On the 1h chart, BTC is trading below the EMA20 ($63,145), EMA50 ($63,202), and EMA200 ($62,321), with the short-term EMAs tightly clustered — indicating a consolidation phase rather than a decisive directional move. The 4h chart shows price attempting to recover within a compressed EMA cluster (EMA7: $63,179, EMA20: $63,057, EMA50: $62,348), but the EMA200 at $63,909 continues to press down as a key resistance ceiling. Notably, the $63,000–$63,200 zone represents strong multi-timeframe confluence resistance, where several EMAs across the 1h and 4h converge, making a clean breakout above this level a prerequisite for any sustained recovery narrative.
Key Levels to Watch
- Resistance: $63,200–$63,350 — Cluster of 1h EMA20/EMA50 and 4h EMA7/EMA20, along with the 1h Bollinger Band midline; repeated failures here reinforce near-term selling pressure.
- Resistance: $63,900–$64,100 — The 4h EMA200 at $63,909 aligns with recent swing highs visible on the 1h chart; a confirmed close above this level would be a notable structural shift.
- Resistance: $65,546 — Daily EMA50, a critical macro resistance level that has not been convincingly reclaimed since the broader downtrend began; must be cleared for any meaningful trend reversal.
- Support: $62,300–$62,350 — 4h EMA50 at $62,348 and 1h EMA200 at $62,321 converge here; immediate downside buffer on any retracement.
- Support: $61,900 — Daily Bollinger Band midline; a close below this level would shift short-term bias firmly back to bearish.
- Support: $59,000–$58,300 — Recent swing low demand zone; the area where buyers stepped in aggressively in late June, representing the last significant structural support before deeper downside exposure.
Momentum & On-Chain Signals
The RSI readings across timeframes tell a cautious story: the 1h RSI sits at 42.35 (below the neutral 50 level), the 4h RSI is near 49.45 (hovering at the mid-line with no clear directional momentum), and the daily RSI at 48.18 reflects a market that is neither oversold nor showing convincing recovery strength. The daily MACD remains in a slow bullish convergence phase — the signal and MACD lines are approaching each other but have not yet confirmed a positive crossover, while the histogram is showing shallow positive bars, suggesting momentum is tentatively rebuilding but unconvincingly so. OBV on the 4h chart has been declining persistently since the macro peak, and while it has flattened somewhat recently, there is no clear accumulation signal — distribution pressure remains in force. Funding rates at 0.0048% are mildly positive but effectively near neutral, indicating no significant leverage bias in either direction.
BTC Dominance & Market Sentiment
BTC.D currently reads at 55.35%, having gradually recovered from lower levels seen in mid-cycle, which indicates that capital remains concentrated in Bitcoin relative to altcoins — a risk-off posture within the crypto asset class. USDT.D at 8.21% remains elevated, suggesting a meaningful portion of market participants are sitting in stablecoins and have not yet rotated back into risk assets. Together, these readings paint a picture of cautious market sentiment: BTC is holding relative strength, but broad appetite for risk-on altcoin exposure remains subdued, limiting the likelihood of a broad market rally in the near term.
Risk Scenarios
- Bullish case: A decisive hourly or 4h close above $63,900 — clearing the 4h EMA200 — would open the path toward the $65,546 daily EMA50, which if reclaimed would signal a meaningful structural recovery and potentially target the $67,000–$68,000 range. This scenario would be strengthened by rising OBV, RSI pushing above 55 on the daily, and a confirmed MACD bullish crossover.
- Bearish case: Failure to hold the $62,300–$62,350 support cluster, followed by a daily close below the Bollinger Band midline at $61,901, would expose Bitcoin to a retest of the $59,000 swing low. A breach of that level with sustained selling volume would open downside toward the $56,000–$57,000 range.
Outlook
Bitcoin’s short-term setup on July 8, 2026 is best characterized as a low-conviction consolidation within a still-dominant macro downtrend, with price wedged between layered EMA resistance above and a recently established demand zone below. The most critical trigger to watch over the next 24–48 hours is whether BTC can mount and sustain a break above the $63,200–$63,909 resistance band; failure to do so increases the probability of a mean-reversion back toward the $61,900–$62,300 zone. The weekly +9% recovery from the $58,296 low is encouraging on the surface, but without momentum confirmation from RSI and MACD on the daily, and with OBV still in distribution territory, the recovery lacks structural conviction. A neutral-to-cautious bias is warranted until bulls can demonstrate a clean hold above the $63,900 level on at least the 4h timeframe.
Disclaimer: This analysis is for informational purposes only and does not constitute financial advice. Cryptocurrency markets are highly volatile and unpredictable. All trading decisions should be made based on your own research and risk tolerance. Block Digest is not responsible for any financial losses incurred as a result of acting on this content.
Stay Ahead of the Market
Follow BlockDigest for crypto market intelligence, research and real-time updates.


