Macro Market Overview
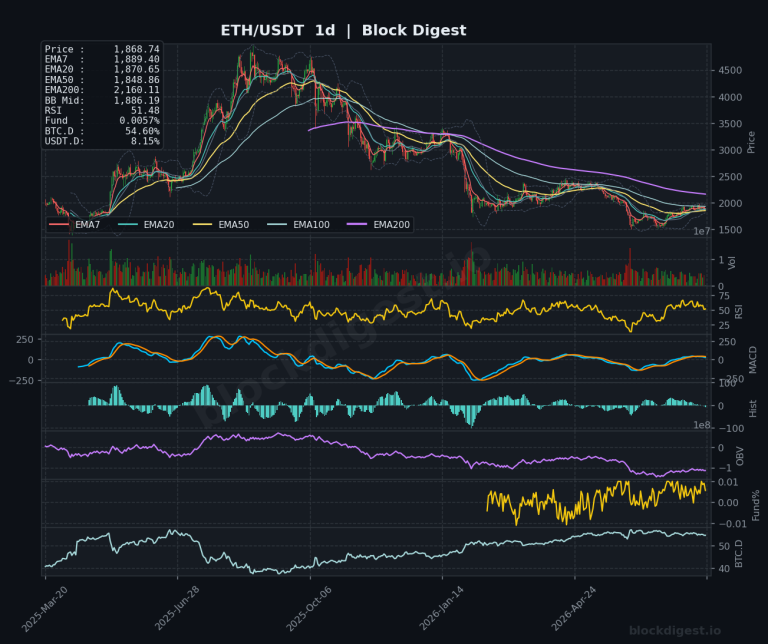
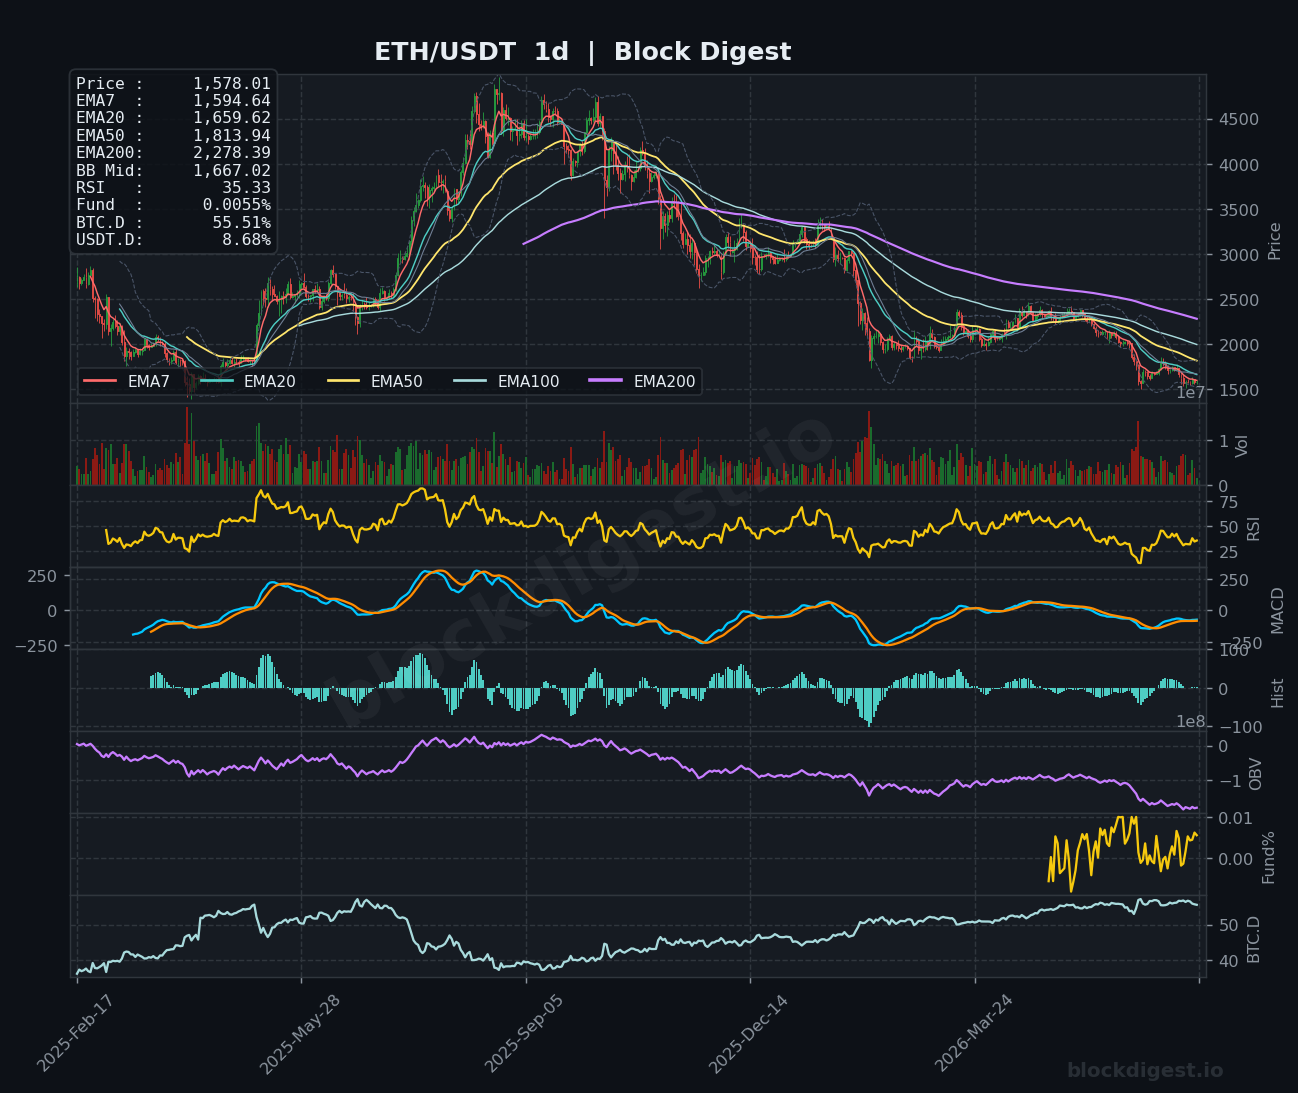
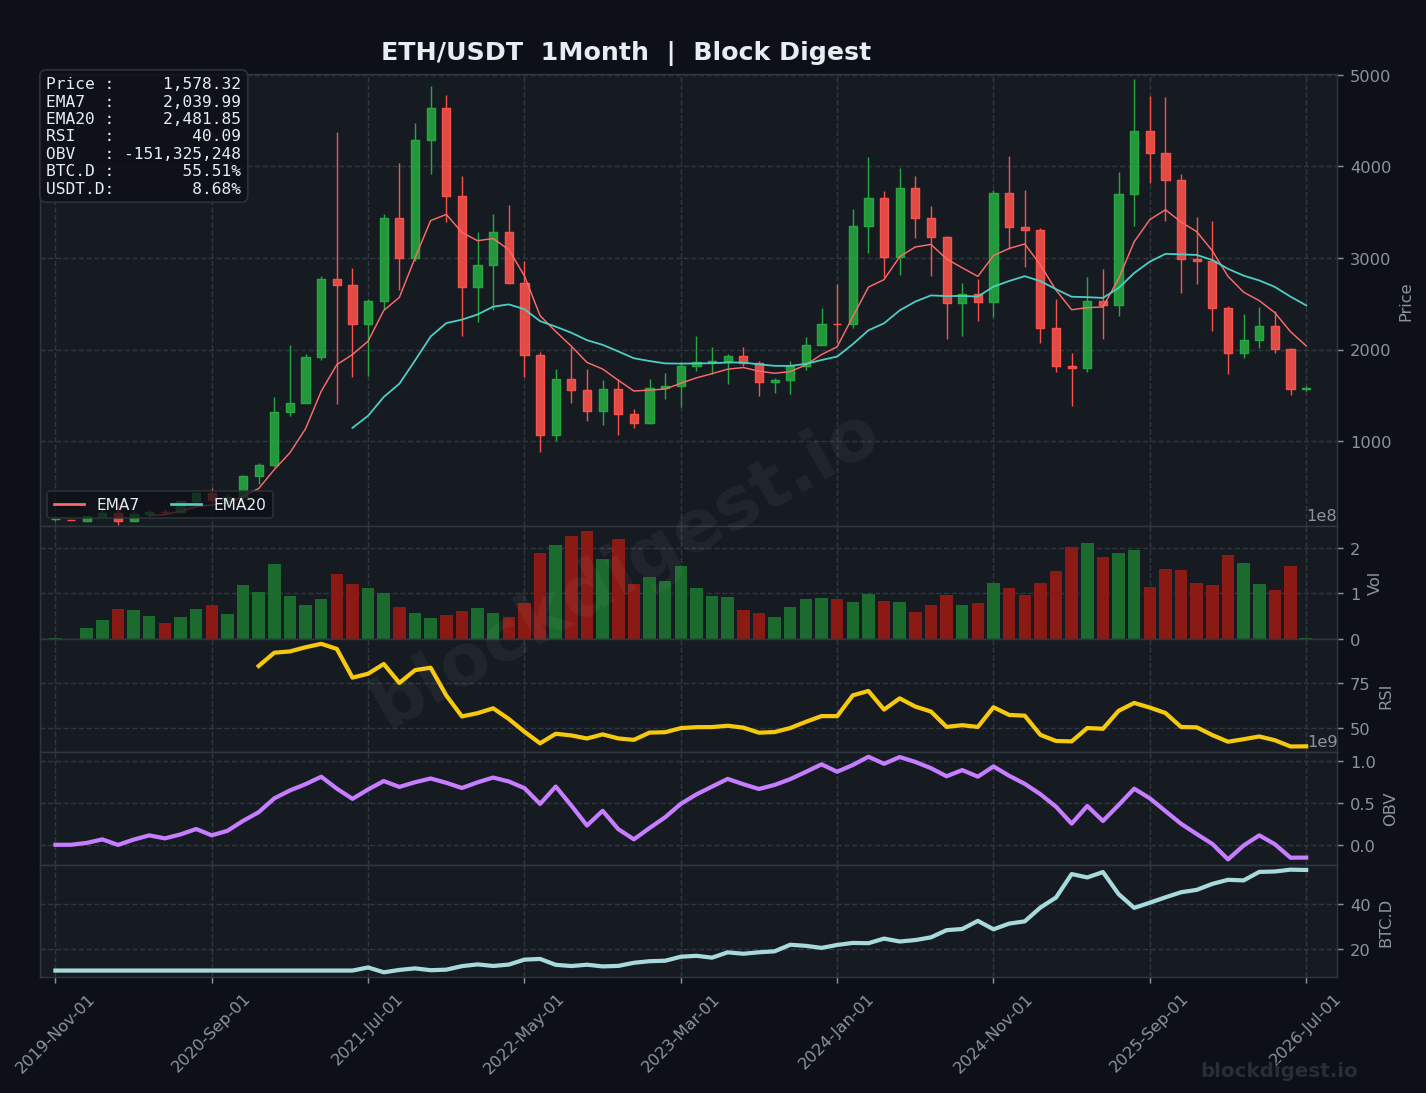
Ethereum enters July 2026 trading at $1,578, a price level that paints a sobering picture of the current macro environment. The monthly candle structure reveals a prolonged distribution and markdown phase that has been unfolding since the local cycle highs near $4,000 established in late 2024, with price now having surrendered well over 60% of those highs. Critically, ETH is trading beneath both its monthly EMA7 ($2,040) and EMA20 ($2,482), a bearish configuration that historically has only resolved through either a multi-month base-building process or a capitulation flush toward deeper structural support. The current price level places ETH within a macro range last seen during the 2023 accumulation period, raising the question of whether this zone will serve as demand absorption or merely a temporary pause before further markdown. Contextually, this is the weakest ETH has appeared on the monthly chart since the post-FTX recovery, and the broader market cycle has clearly shifted from the euphoria of late 2024 into a risk-off, deleveraging regime.
Long-Term Trend Structure
On the monthly timeframe, the EMA7 at $2,040 has crossed decisively below the EMA20 at $2,482 — a monthly death cross that has historically preceded extended bear phases lasting anywhere from six to eighteen months. The Bollinger Bands on the monthly chart are beginning to expand to the downside, with price approaching the lower band, suggesting that the current move is not yet exhausted but that oversold conditions are starting to develop at this macro scale. Key historical support zones cluster around the $1,500–$1,600 region, which served as a significant resistance-turned-support level during the 2023 base formation, and the $1,200–$1,300 range represents the next meaningful macro floor derived from the 2022 bear market lows. The monthly RSI at 40.09 is approaching but has not yet reached the sub-30 oversold readings that characterized the generational lows of prior cycles (2018–2019 and 2022), suggesting there may still be residual downside pressure before a cyclically significant bottom is confirmed. The current phase is best characterized as late-stage distribution transitioning into markdown, with no clear monthly bottoming structure yet in place.
Weekly Timeframe Context
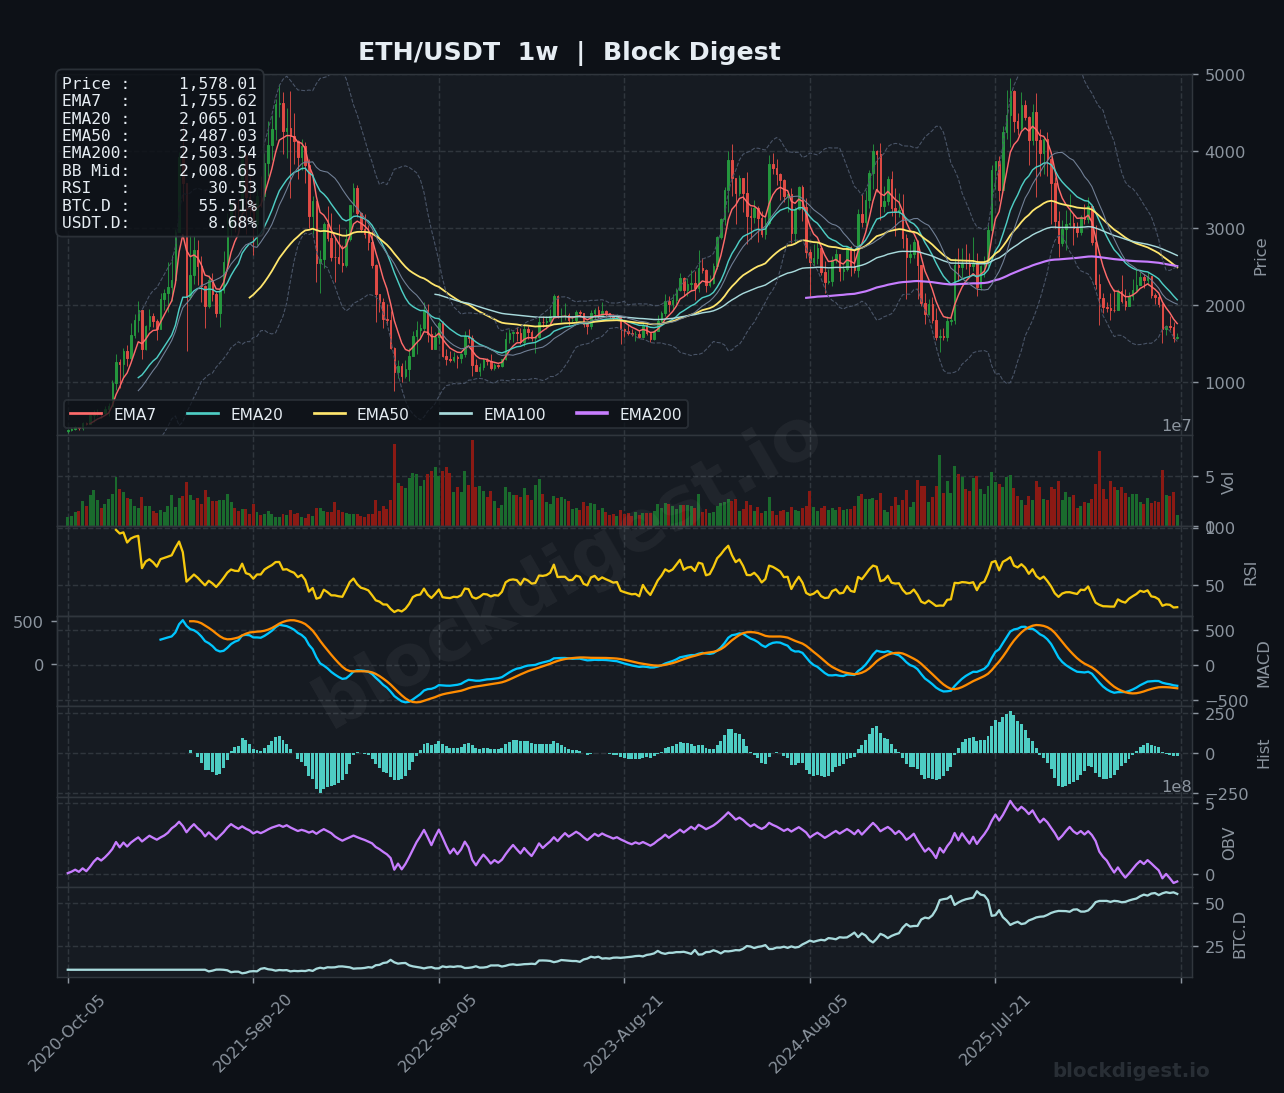
The weekly chart reinforces the bearish monthly thesis with striking clarity — price at $1,578 sits well below all major weekly EMAs, with the EMA7 at $1,756, EMA20 at $2,065, EMA50 at $2,487, and the EMA200 at $2,504, forming a perfectly stacked bearish EMA waterfall. This configuration, where shorter-term averages are compressed well below longer-term ones, is characteristic of a mature downtrend and typically requires significant time and price consolidation to repair. The weekly Bollinger Band midline around $2,009 now acts as a formidable overhead resistance level, and any relief rally would need to reclaim this zone convincingly to suggest a structural shift is underway. The weekly RSI at 30.53 is pressing on oversold territory — a zone that during prior cycles has marked medium-term bounces, though not necessarily macro reversals without accompanying volume confirmation.
Key Macro Levels
- Major Resistance: $2,009 (weekly BB midline / former support confluence), $2,065 (weekly EMA20), $2,482–$2,504 (weekly EMA50/EMA200 and monthly EMA20), $3,000–$3,200 (prior breakdown zone and psychological level)
- Major Support: $1,500–$1,578 (current price / 2023 accumulation zone upper bound), $1,200–$1,300 (2022 bear market structural lows and macro demand zone), $1,000 (psychological and historical long-term support), $800–$900 (pre-2021 bull run base, extreme bear case)
Momentum & Accumulation Analysis
The monthly RSI at 40.09 is in a meaningful deterioration phase, having declined steadily from the overbought readings above 70 seen at the cycle peak in late 2024, and is now approaching the 35–40 zone that historically has preceded either capitulation or early accumulation depending on broader macro conditions. Critically, the monthly OBV has been in a sustained downtrend throughout this markdown phase, confirming that institutional and large-participant distribution has been the dominant flow — this is not a healthy correction with underlying accumulation; it is a structurally bearish volume picture. On the daily chart, the RSI at 35.33 mirrors the weakness, trading near oversold but with no confirmed bullish divergence visible yet to suggest smart money absorption. The weekly MACD paints perhaps the most concerning picture of all: both the MACD line and signal line are in negative territory and continuing to slope downward, with histogram bars remaining negative — there is no medium-term momentum reversal signal present. Comparatively, the current OBV and RSI readings across all timeframes are tracking closer to the 2022 bear market analog than the 2023–2024 recovery, warranting caution against premature bottom-calling.
BTC Dominance – Cycle Context
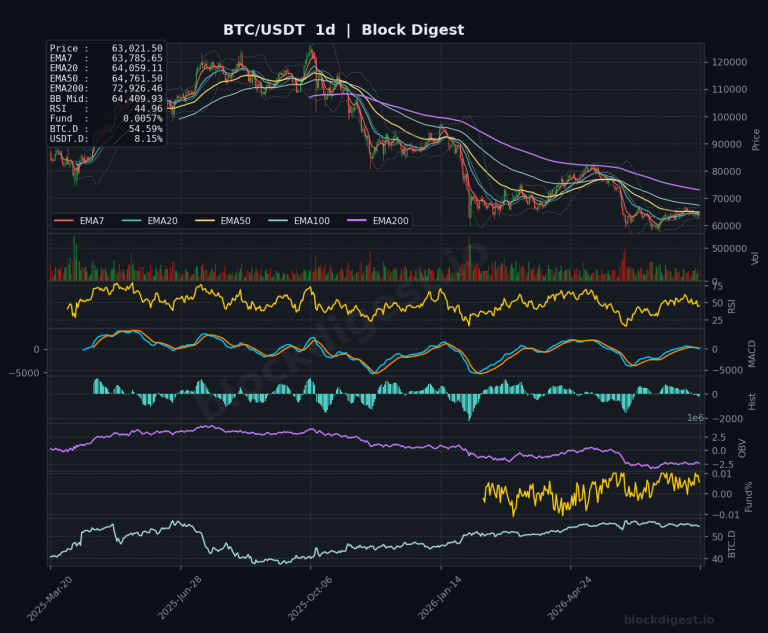
Bitcoin dominance at 55.51% remains elevated and, based on the BTC.D chart visible across both the weekly and monthly timeframes, has been on a sustained uptrend since late 2022 — a multi-year structural rise that has been one of the primary headwinds suppressing ETH and broader altcoin performance. Historically, altcoin season is preceded by BTC dominance peaking and rolling over, typically after BTC has established its own cycle top and capital begins rotating into higher-beta assets; there is no clear evidence of that rotation occurring yet, as BTC.D shows no definitive top formation at current levels. The USDT dominance at 8.68% remains elevated relative to bull market norms, indicating that a meaningful proportion of market participants remain in stablecoins — this represents a reservoir of potential buying power but also signals that risk appetite has not yet returned to the market in a macro sense. Until USDT.D begins declining materially and BTC.D shows a confirmed monthly rollover, the structural environment for ETH and altcoins remains hostile.
Risk Scenarios
- Bull case: A confluence of macro catalysts — including a sustained shift in global risk appetite, Federal Reserve policy easing, and renewed institutional ETH demand via ETF flows — could trigger a relief rally targeting the $2,000–$2,065 range initially, with a full structural recovery requiring monthly closes above $2,482 to invalidate the current bearish EMA configuration. Monthly RSI bouncing from the 35–40 zone with a simultaneous OBV inflection would provide the first credible accumulation signal, setting the stage for a multi-month recovery toward $2,800–$3,000. A BTC dominance peak and reversal would be the key cycle trigger that historically unlocks ETH outperformance in the subsequent phase.
- Bear case: Failure to hold the $1,500–$1,578 macro support zone on a monthly closing basis would represent a significant structural breakdown, opening a technical path toward the $1,200–$1,300 region where the 2022 bear market lows provide the next meaningful macro demand zone. Continued deterioration in the monthly OBV, persistently elevated USDT.D, and a monthly RSI flush below 30 would confirm a full capitulation scenario consistent with the deepest phases of prior crypto bear markets. In an extreme scenario where macro conditions worsen — rising rates, broader risk-off, or negative crypto-specific catalysts — the $800–$1,000 range cannot be ruled out as a tail risk, mirroring the percentage drawdowns seen in the 2018 and 2022 cycles.
Monthly Outlook
As of July 1, 2026, the macro outlook for ETH remains decidedly bearish, with the weight of evidence across monthly, weekly, and daily timeframes pointing to a market in active markdown with no confirmed bottoming structure yet in place. The most critical level to monitor in the coming weeks is the $1,500–$1,578 zone — a sustained monthly close below $1,500 would be a significant macro warning signal, while any meaningful recovery above $2,009 (weekly BB midline) would begin to challenge the bearish thesis. The cycle thesis currently favors continued ETH underperformance relative to BTC until dominance dynamics shift and broader risk appetite returns, likely requiring a catalyst beyond purely technical factors. Traders and investors should prioritize capital preservation over aggressive accumulation at this stage, waiting for confirming signals such as monthly RSI divergence, OBV stabil
Disclaimer: This analysis is for informational purposes only and does not constitute financial advice. Cryptocurrency markets are highly volatile and unpredictable. All trading decisions should be made based on your own research and risk tolerance. Block Digest is not responsible for any financial losses incurred as a result of acting on this content.
Stay Ahead of the Market
Follow BlockDigest for crypto market intelligence, research and real-time updates.