
Market Overview
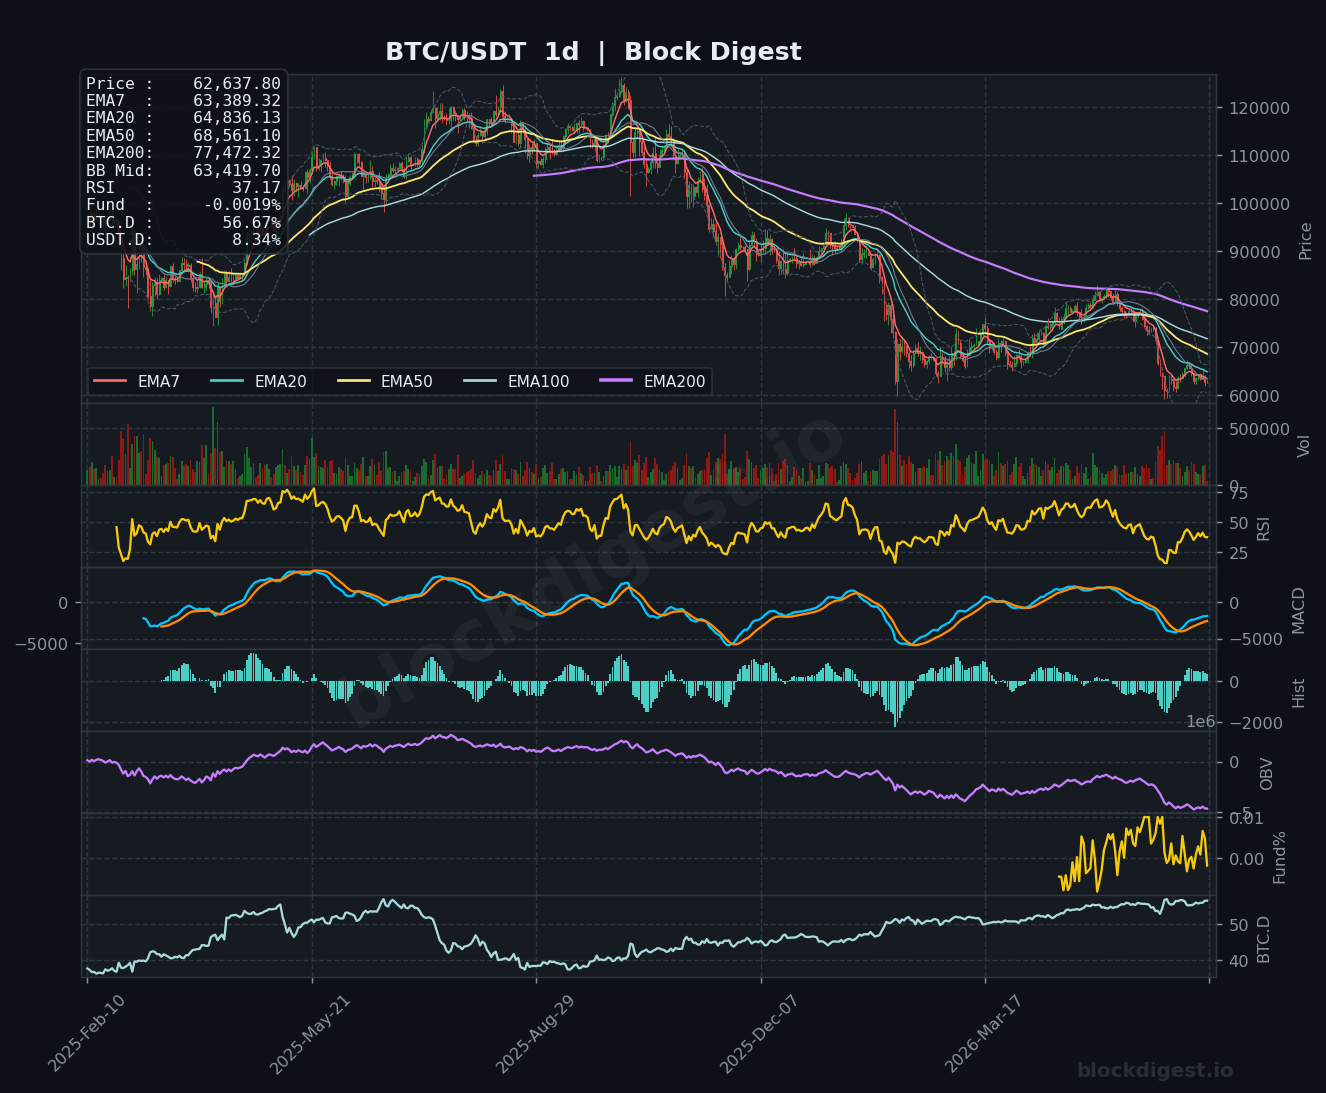
Bitcoin is currently trading at $62,637.80, positioned below all major EMAs on both the 4h and daily timeframes, painting a structurally bearish picture. On the daily chart, price sits beneath the EMA7 ($63,389), EMA20 ($64,836), EMA50 ($68,561), and the deeply overhead EMA200 ($77,472), confirming that the dominant trend remains firmly downward following the significant drawdown from peak levels. Price is trading just below the Bollinger Band midline on the daily ($63,419), suggesting sellers have maintained control and any recovery attempts have been shallow. The overall market structure on the daily timeframe reflects a sustained downtrend, with lower highs forming consistently since the macro peak.
Multi-Timeframe Confluence
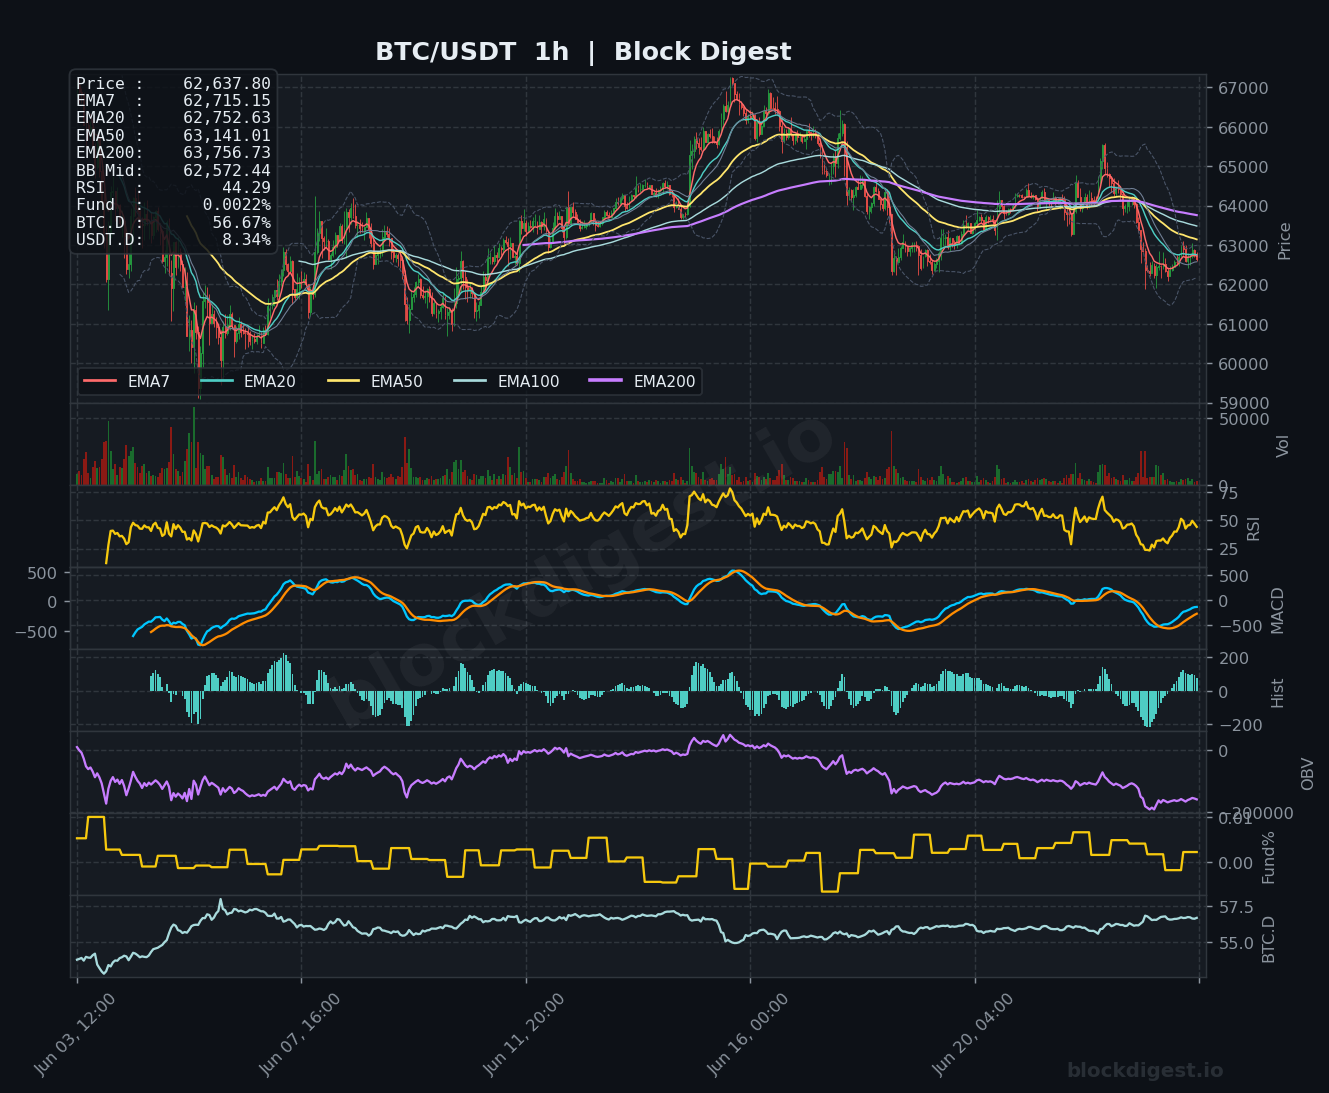
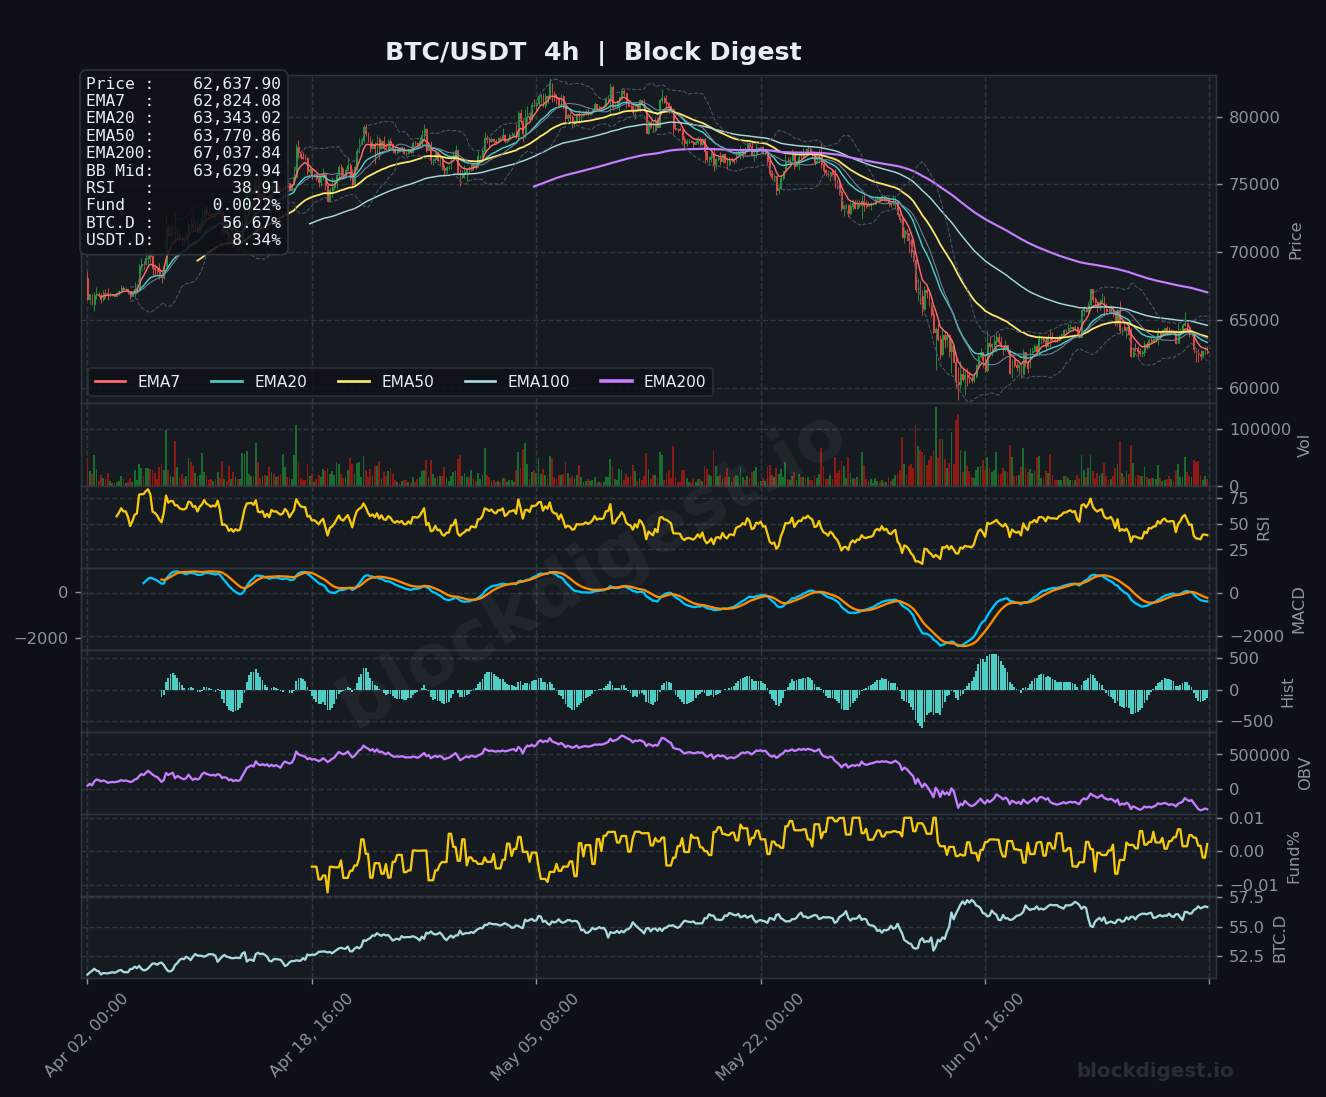
Across all three timeframes, the bearish EMA stack is consistent — short-term EMAs remain below longer-term ones — confirming downtrend alignment from the 1h through to the daily. On the 1h chart, price is trading below the EMA7 ($62,715), EMA20 ($62,752), EMA50 ($63,141), and EMA200 ($63,756), indicating near-term momentum is also skewed to the downside. The 4h chart shows price compressed below a tightly clustered EMA7 ($62,824), EMA20 ($63,343), and EMA50 ($63,770), all of which now act as a layered overhead resistance zone between $62,800 and $63,800. There is no meaningful divergence between timeframes — all three are aligned bearishly, with no short-term reversal structure yet confirmed.
Key Levels to Watch
- Resistance: $63,141 — 1h EMA50, immediate overhead obstacle that has capped recent recovery attempts
- Resistance: $63,770–$63,800 — confluence of 4h EMA50 and 1h EMA200, a critical reclaim level for any bullish reversal thesis
- Resistance: $64,836 — daily EMA20, the first major structural resistance that would need to be breached to suggest a broader trend shift
- Support: $62,572 — 1h Bollinger Band midline, near-term floor currently being tested
- Support: $61,800–$62,000 — lower Bollinger Band on the 1h chart and recent swing lows, key demand zone to hold
- Support: $59,500–$60,000 — psychological and structural level visible on the daily, last significant defence before deeper losses
Momentum & On-Chain Signals
The RSI readings across all timeframes are broadly bearish: 44.29 on the 1h, 38.91 on the 4h, and 37.17 on the daily — with the 4h and daily both approaching oversold territory but not yet generating reliable reversal signals. The 4h MACD shows the signal and MACD lines converging near zero after a prolonged bearish phase, with the histogram beginning to narrow, hinting at potential momentum exhaustion rather than outright reversal. OBV on both the 4h and daily timeframes continues to trend lower, confirming ongoing distribution and a lack of meaningful accumulation pressure at current levels. The funding rate sits at a near-neutral +0.0022% on the 1h/4h, suggesting the market is not heavily leveraged to either side, which removes imminent liquidation cascade risk but also signals muted conviction.
BTC Dominance & Market Sentiment
BTC dominance stands at 56.67%, a notably elevated reading that reflects continued capital consolidation into Bitcoin relative to the broader altcoin market, suggesting risk appetite remains selective rather than broadly expansive. USDT dominance at 8.34% indicates a meaningful proportion of market capital remains on the sidelines in stablecoins, consistent with a risk-off positioning environment. Together, these readings imply market participants are not yet rotating aggressively into risk assets, and any BTC recovery may not immediately translate into altcoin strength.
Risk Scenarios
- Bullish case: A sustained hourly close above $63,800, reclaiming the 4h EMA50 and 1h EMA200 cluster, would signal a credible short-term reversal with initial targets toward $64,836 (daily EMA20) and potentially $65,500 on a momentum continuation.
- Bearish case: Failure to hold the $62,000 support zone and a daily close below $61,800 would accelerate selling pressure, opening a path toward the $59,500–$60,000 structural support region and risking a retest of the recent lows near $58,000.
Outlook
The directional bias remains cautiously bearish heading into the next 24–48 hours, with price trapped beneath a dense overhead EMA cluster and all major timeframes aligned to the downside. The critical trigger to watch is a decisive reclaim — or failure — of the $63,770–$63,800 resistance zone, which would either validate a short-term recovery or confirm continued distribution. Daily RSI approaching the high-30s warrants attention for potential oversold bounces, but without OBV confirmation, any rally should be treated as a relief move rather than a structural reversal. Until BTC reclaims at minimum the daily EMA20 at $64,836 on meaningful volume, the path of least resistance remains lower.
Disclaimer: This analysis is for informational purposes only and does not constitute financial advice. Cryptocurrency markets are highly volatile and unpredictable. All trading decisions should be made based on your own research and risk tolerance. Block Digest is not responsible for any financial losses incurred as a result of acting on this content.
Stay Ahead of the Market
Follow BlockDigest for crypto market intelligence, research and real-time updates.


