
Market Context
Bitcoin dominance sits at 55.77% as of June 22, 2026, maintaining a persistent grip on overall crypto market capitalization that continues to suppress altcoin performance across the board. USDT dominance at 8.13% remains elevated, signaling that a meaningful portion of capital is still parked on the sidelines rather than deployed into risk assets. The combination of high BTC.D and elevated USDT.D paints a cautious macro backdrop for altcoins, with most assets struggling to reclaim prior highs after a broad market correction that began in early June.
Solana (SOL)
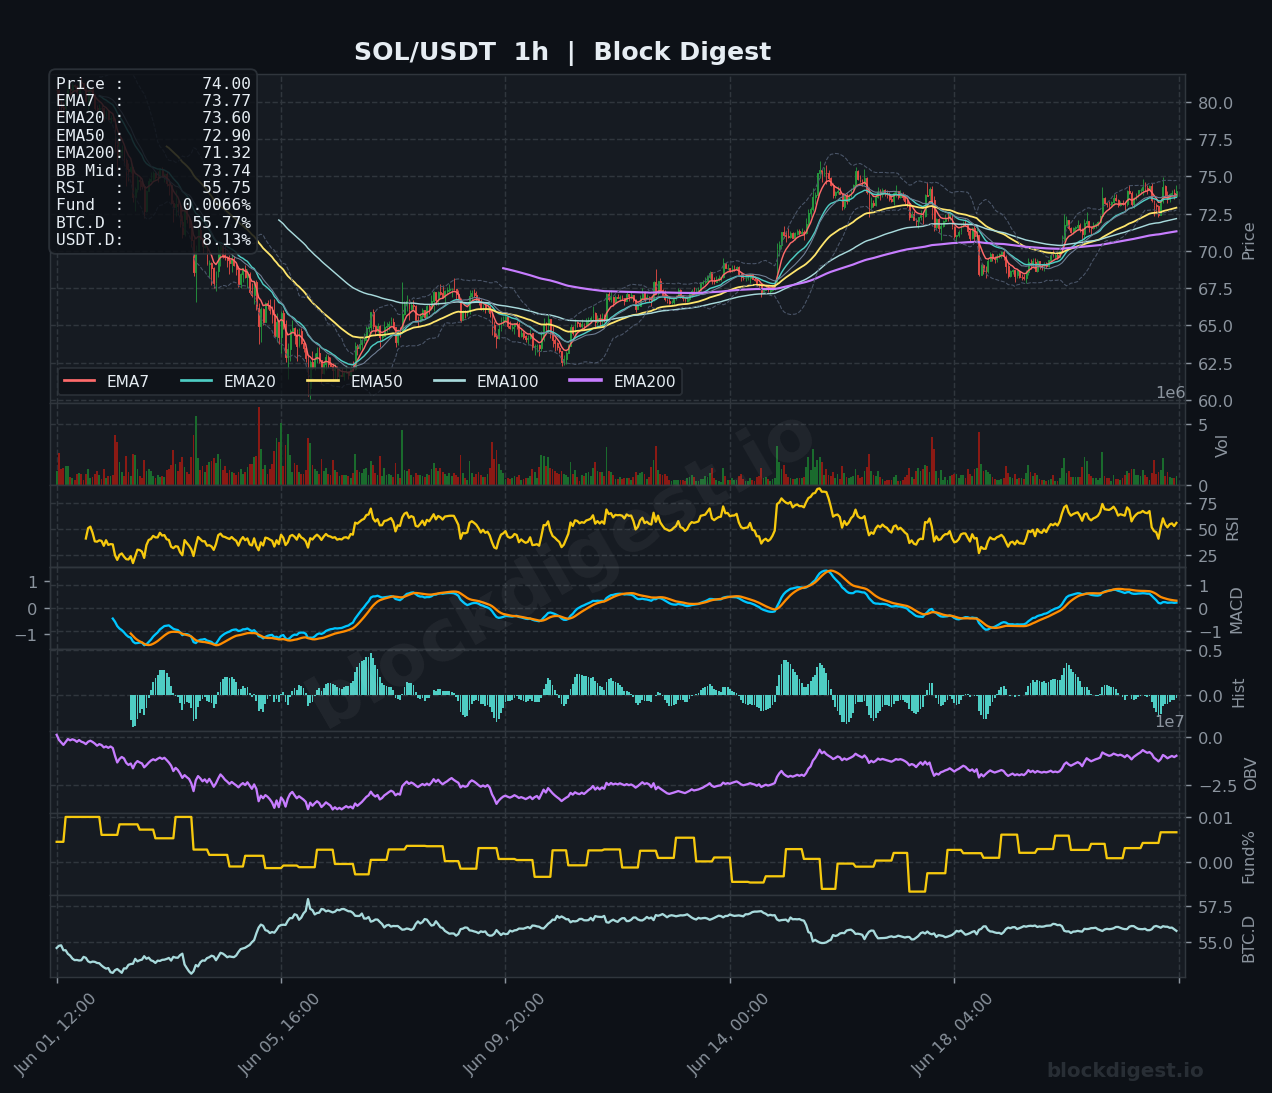
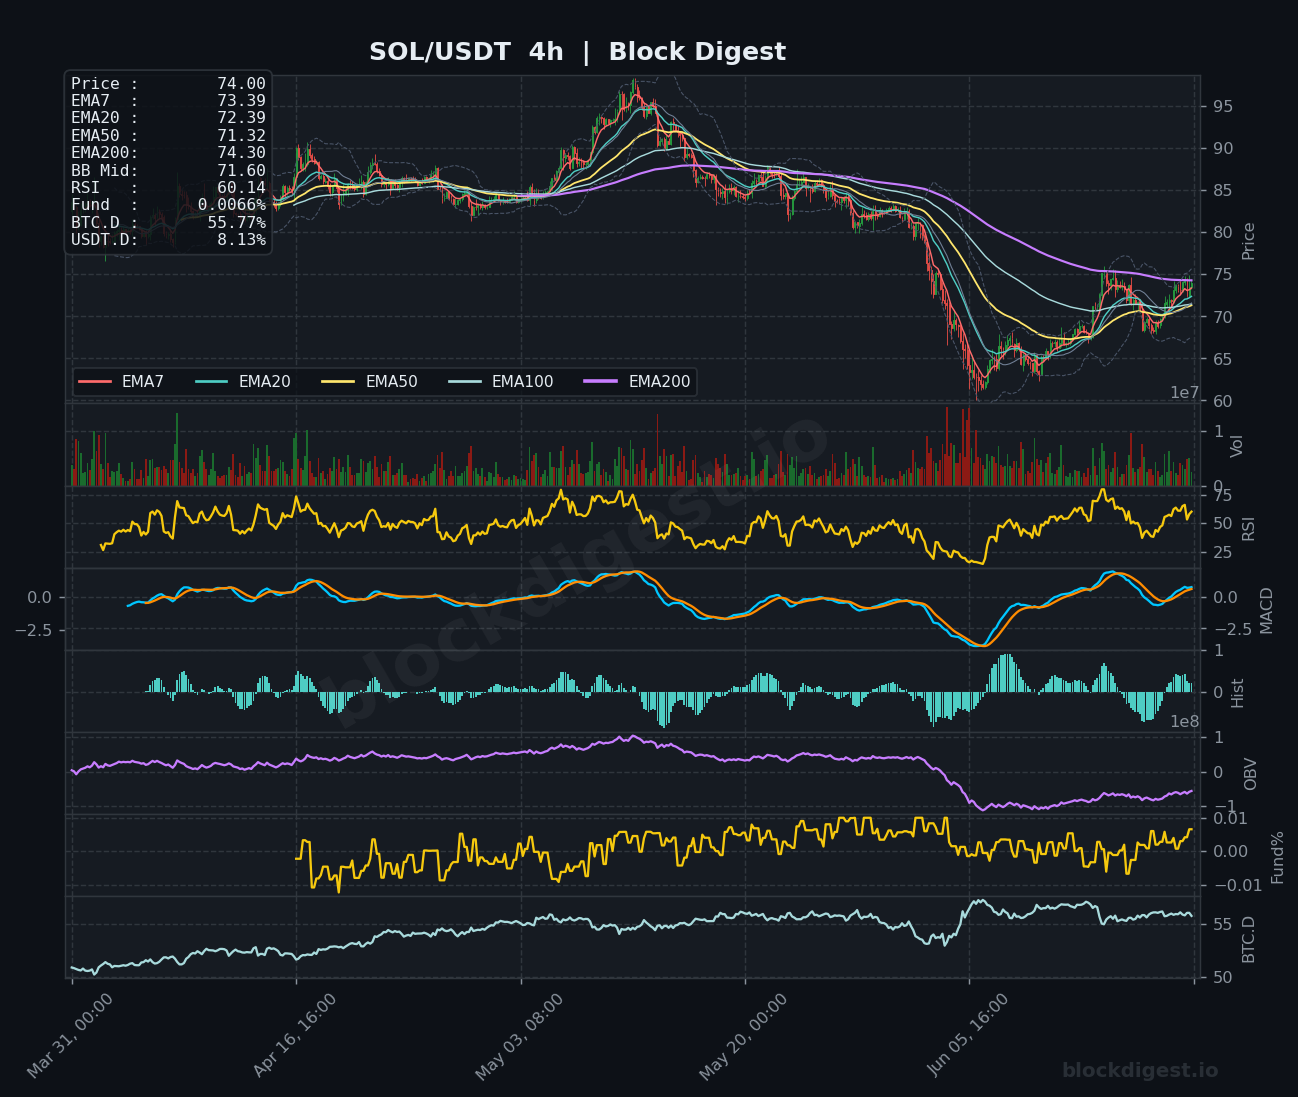
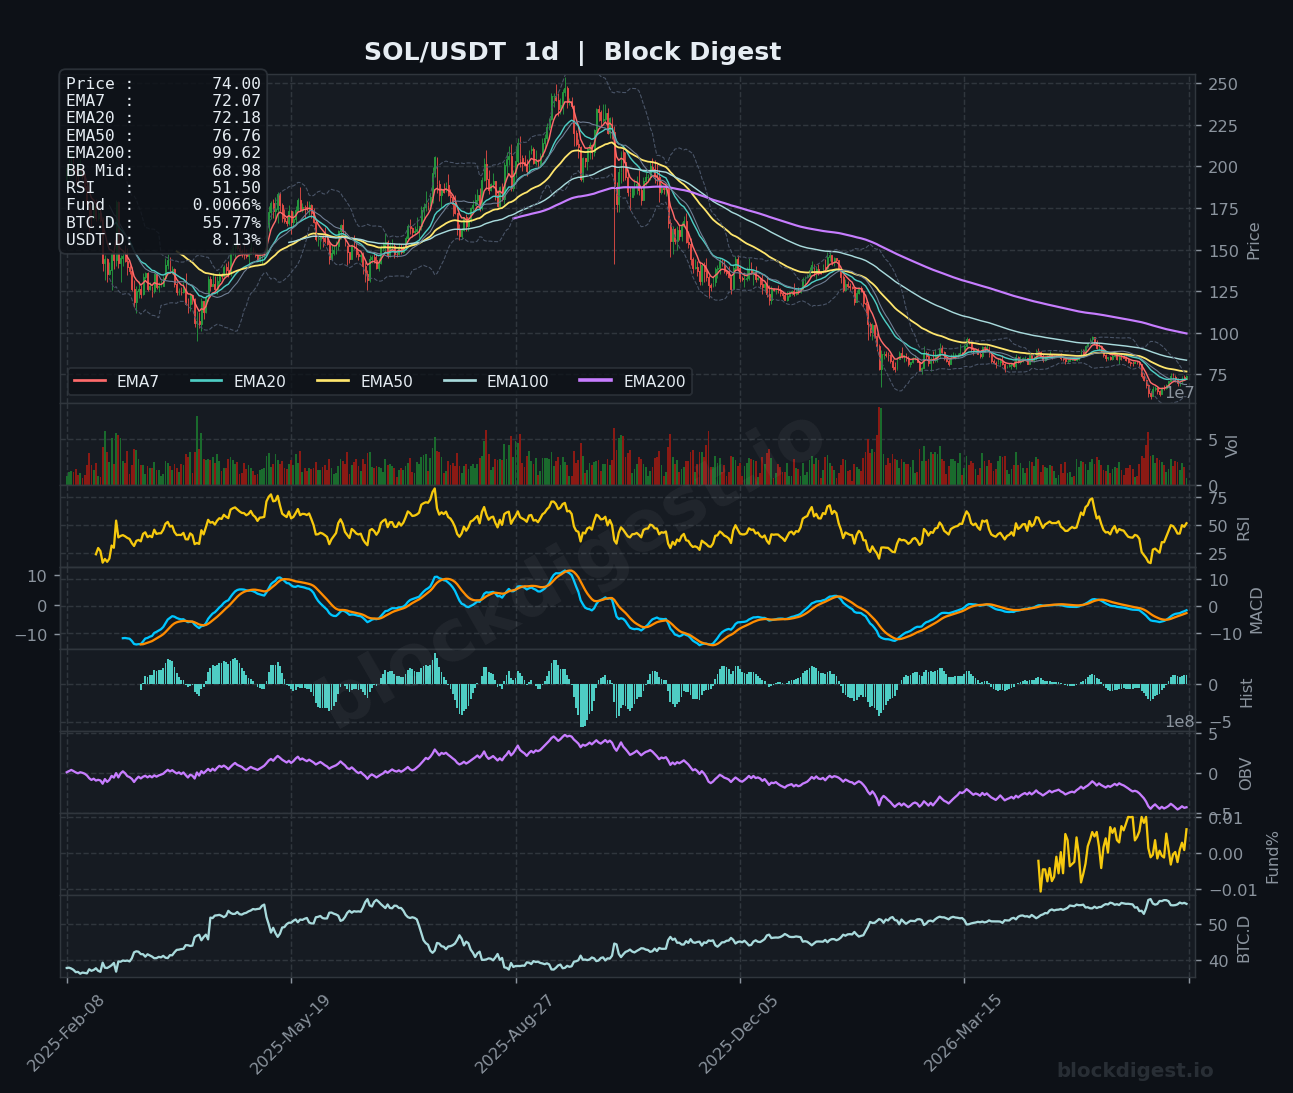
SOL is currently trading at $74.00, staging a modest recovery after bottoming near $63–$65 in the wake of a sharp early-June selloff that wiped out gains accumulated from the $65–$75 range. On the 1h chart, price is holding above all short-term EMAs (EMA7: $73.77, EMA20: $73.60, EMA50: $72.90), and the RSI at 55.75 suggests neutral-to-mildly bullish momentum without being overextended. However, the 4h chart tells a more cautionary story — price remains below the EMA200 at $74.30, and while the MACD is attempting a bullish crossover from deeply negative territory, the histogram is still printing near-zero values indicating weak follow-through. On the daily, the RSI reads 51.50 and the EMA50 at $76.76 represents immediate overhead resistance; bulls need a clean close above $76–$77 to shift the medium-term bias convincingly higher.
XRP (XRP)
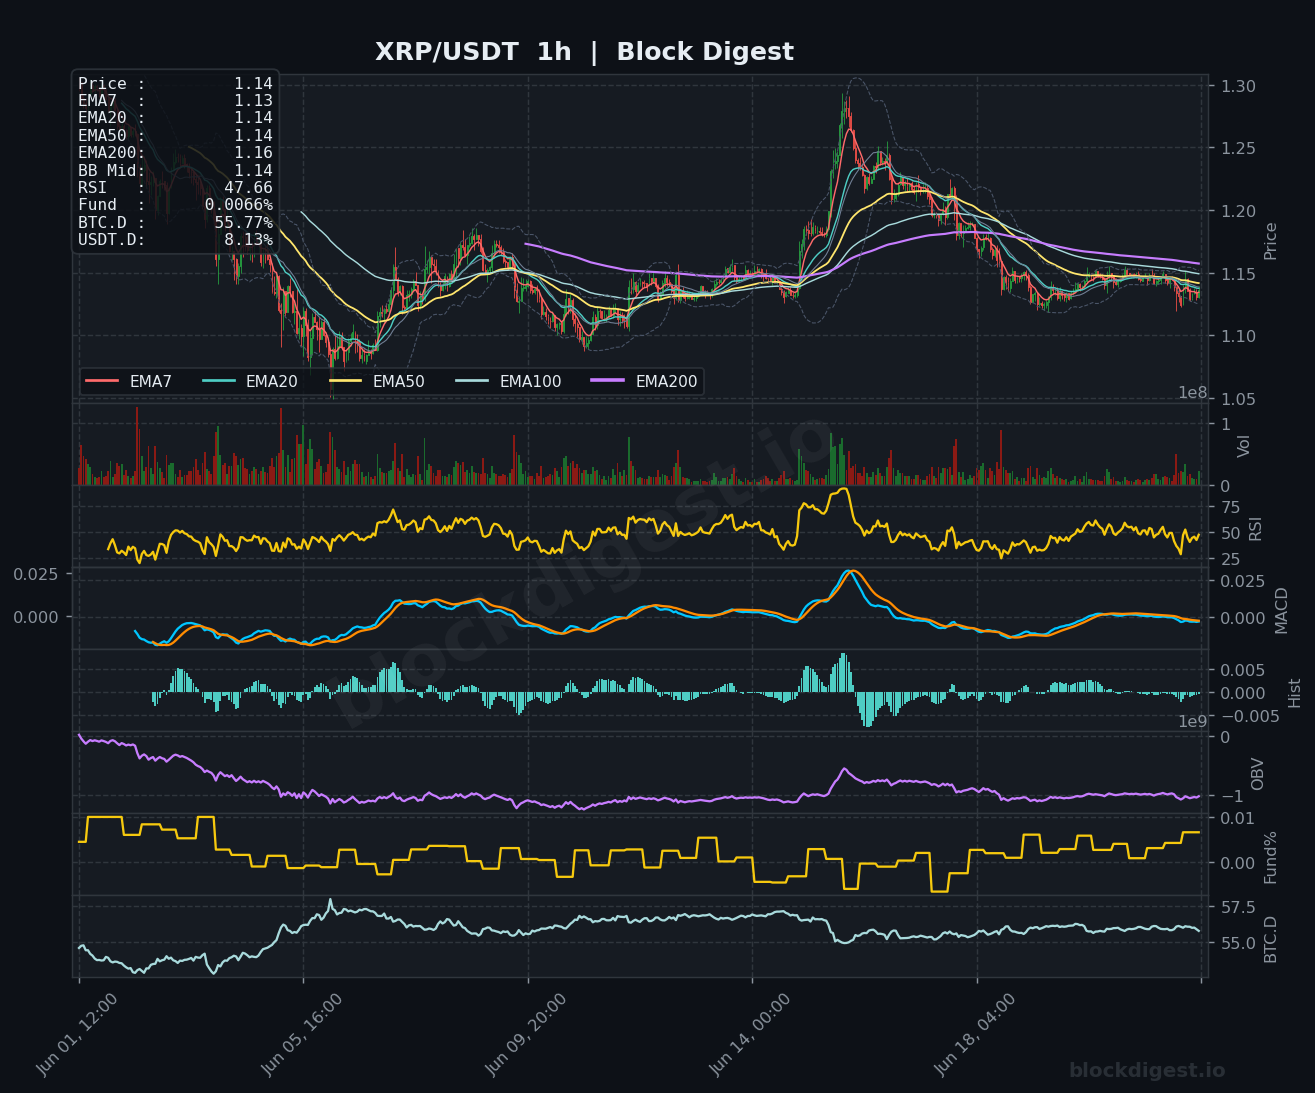
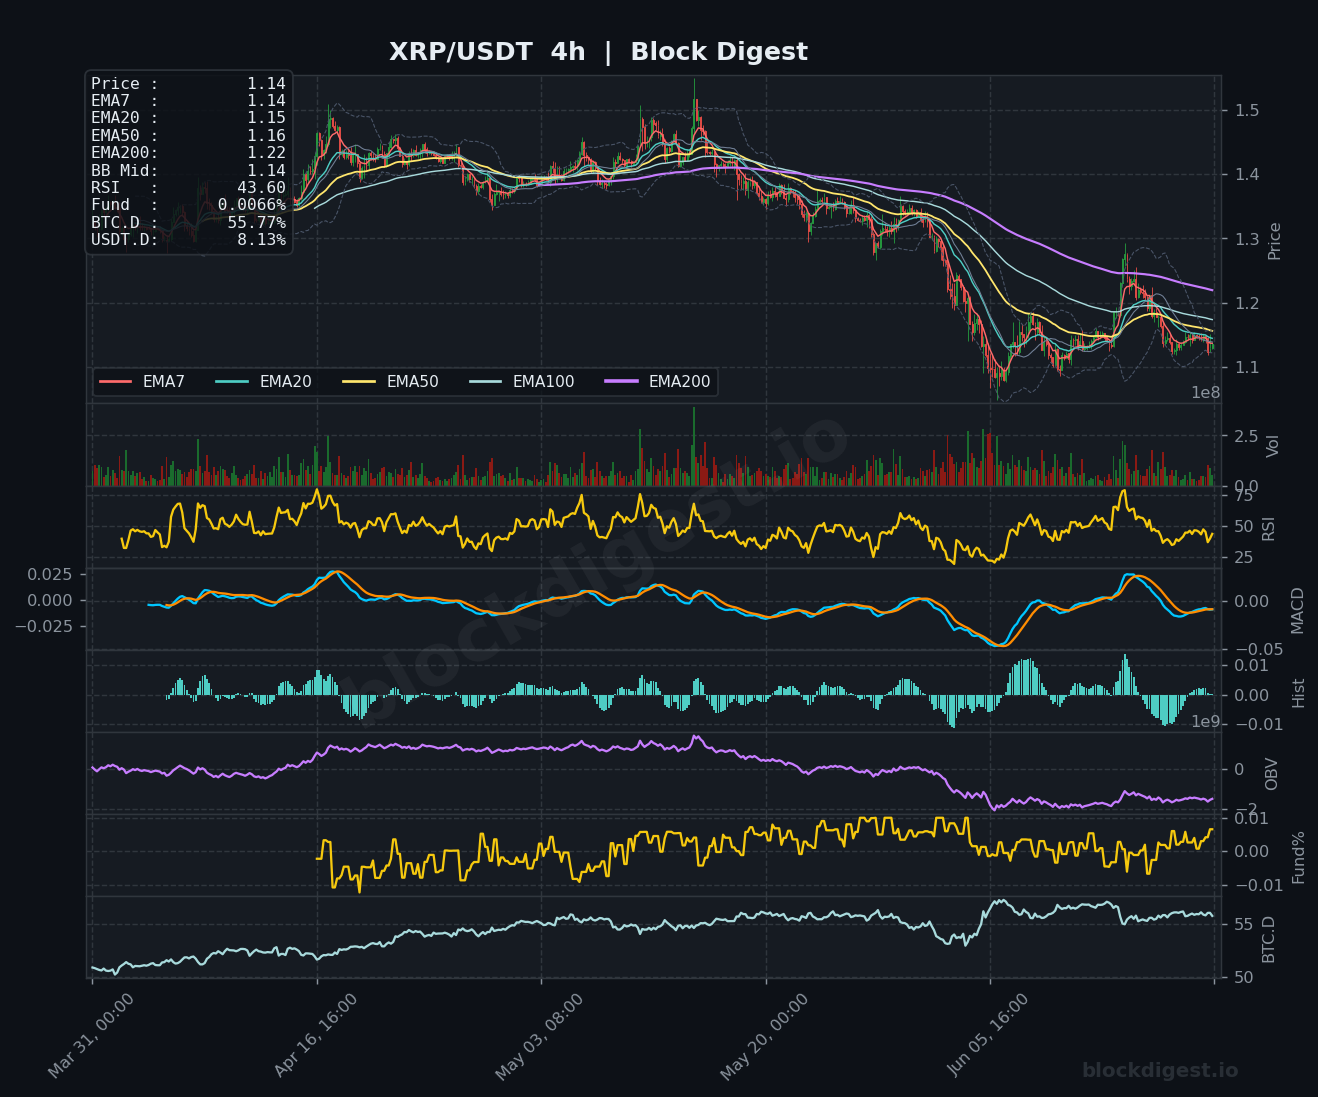
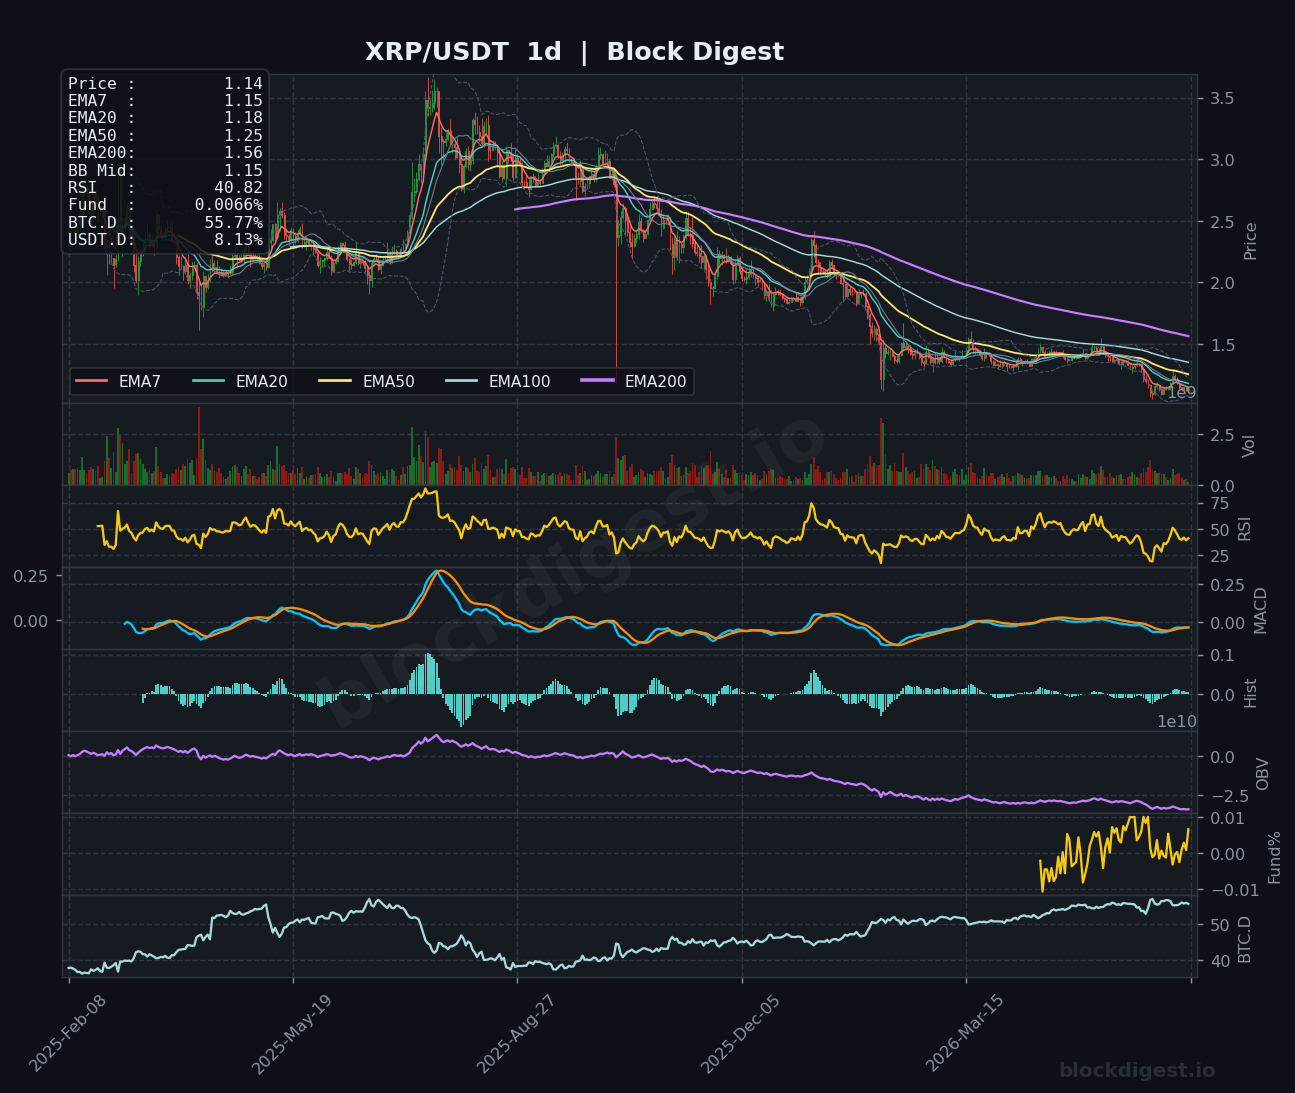
XRP trades at $1.14, languishing near multi-month lows after a significant breakdown from the $1.40–$1.50 range that had been its base through much of the spring. The 1h chart shows the RSI at 47.66 and price clustered tightly around the EMA7 ($1.13), EMA20 ($1.14), and EMA50 ($1.14), suggesting consolidation at current levels but with no clear directional catalyst. The 4h MACD remains in negative territory with the signal line barely ticking higher, while the RSI at 43.60 reflects ongoing bearish pressure without yet reaching oversold extremes that might invite a bounce. On the daily timeframe, RSI has slipped to 40.82 and all major EMAs are stacked bearishly above price — the EMA50 at $1.25, EMA200 at $1.56 — making $1.20 the first meaningful resistance to watch, with downside risk toward the $1.05–$1.08 zone if current support fails.
BNB (BNB)
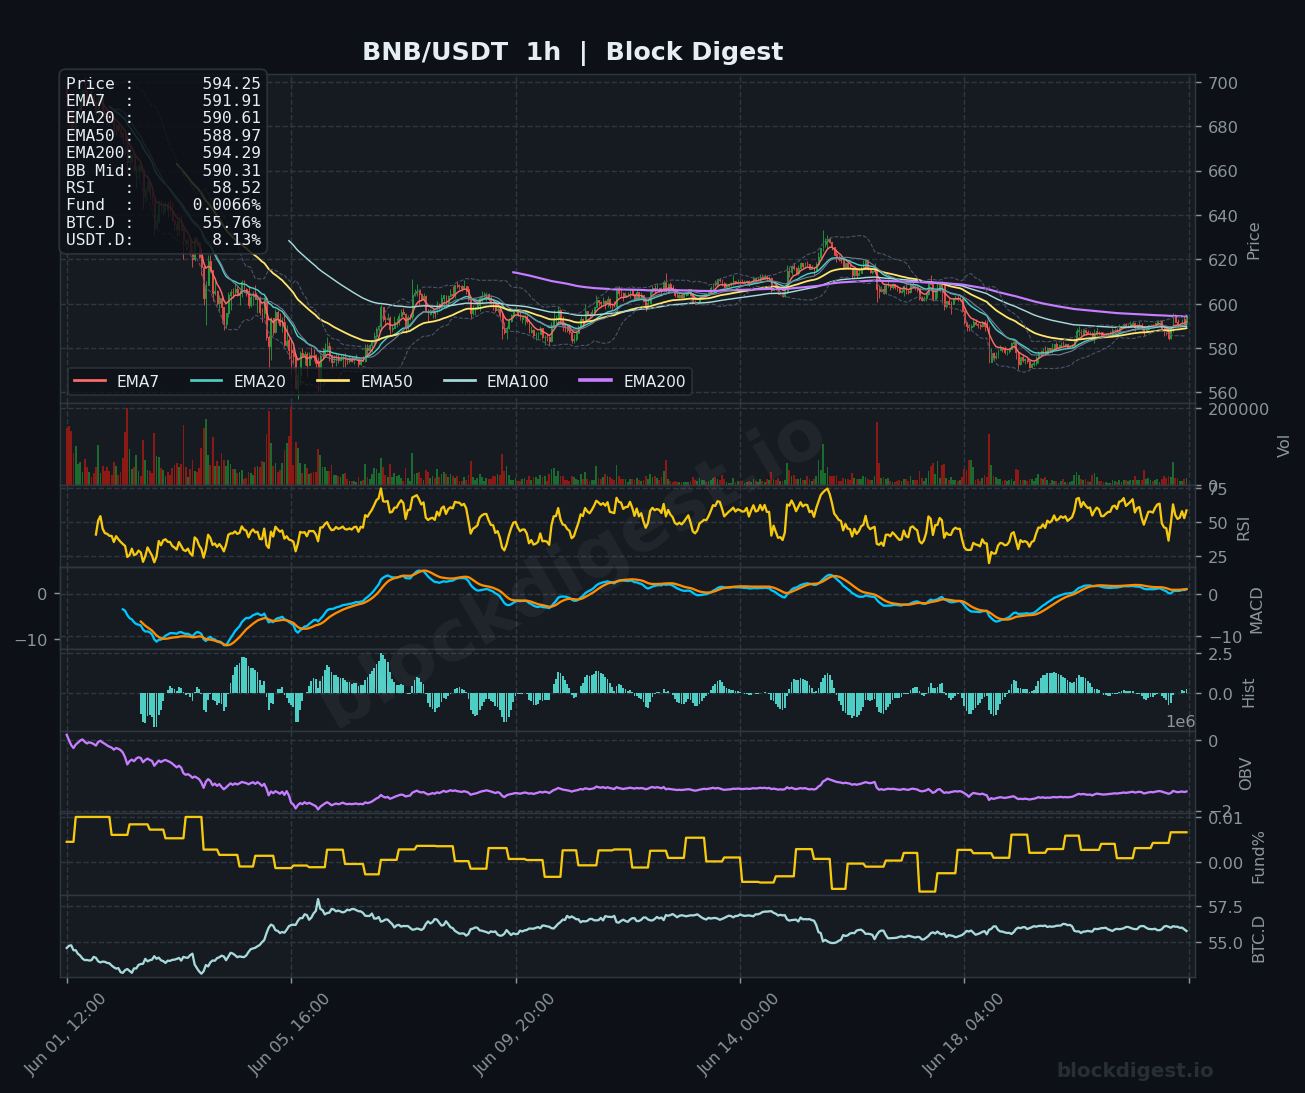
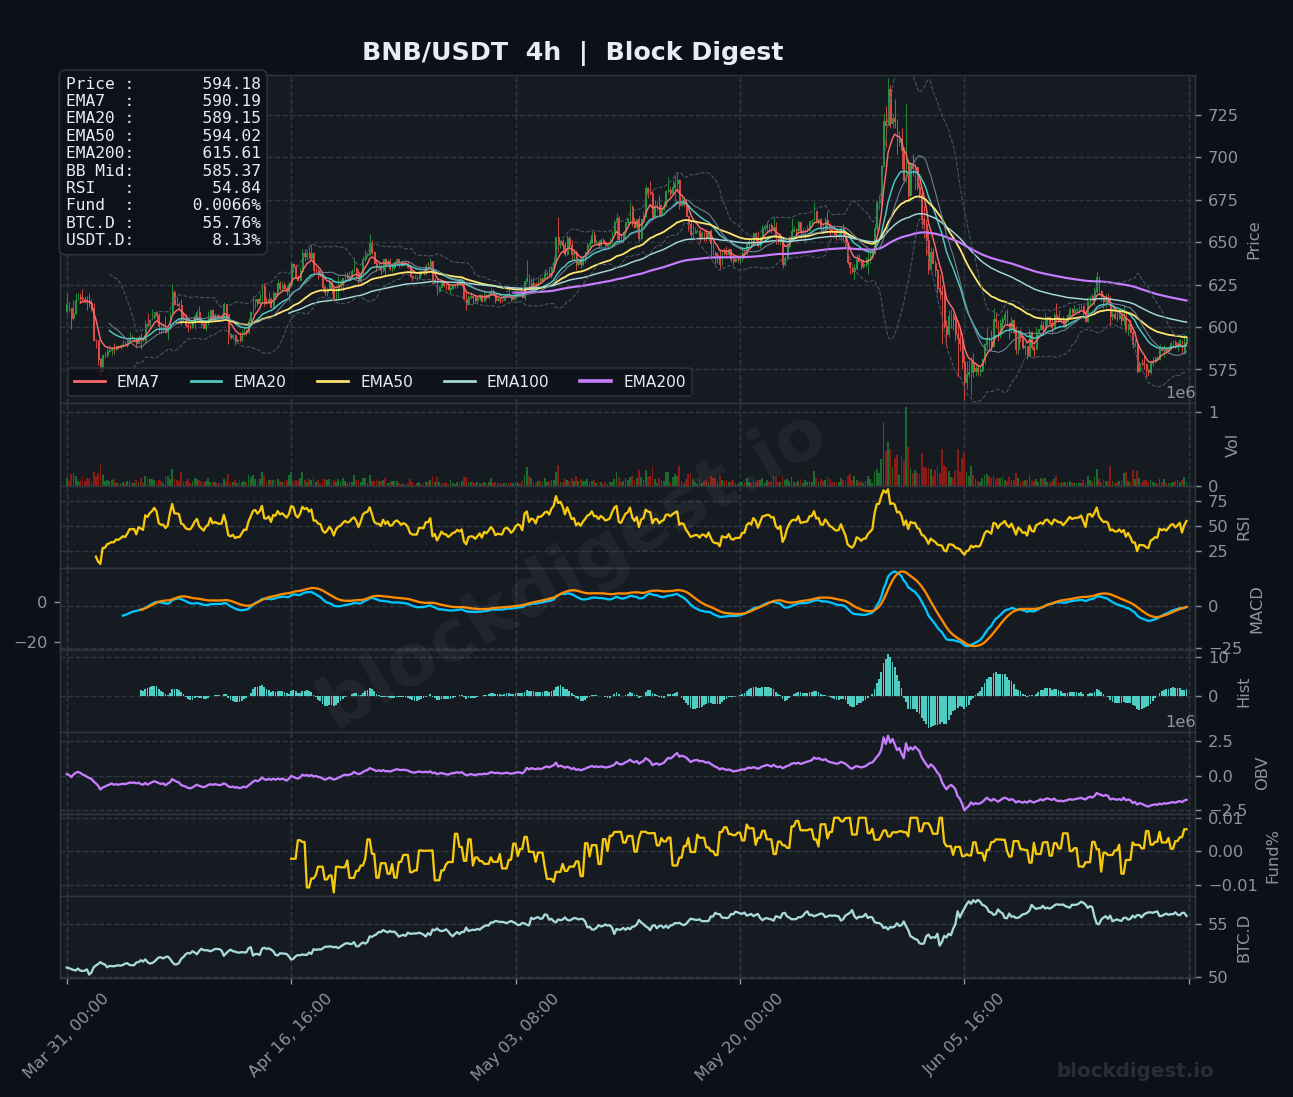
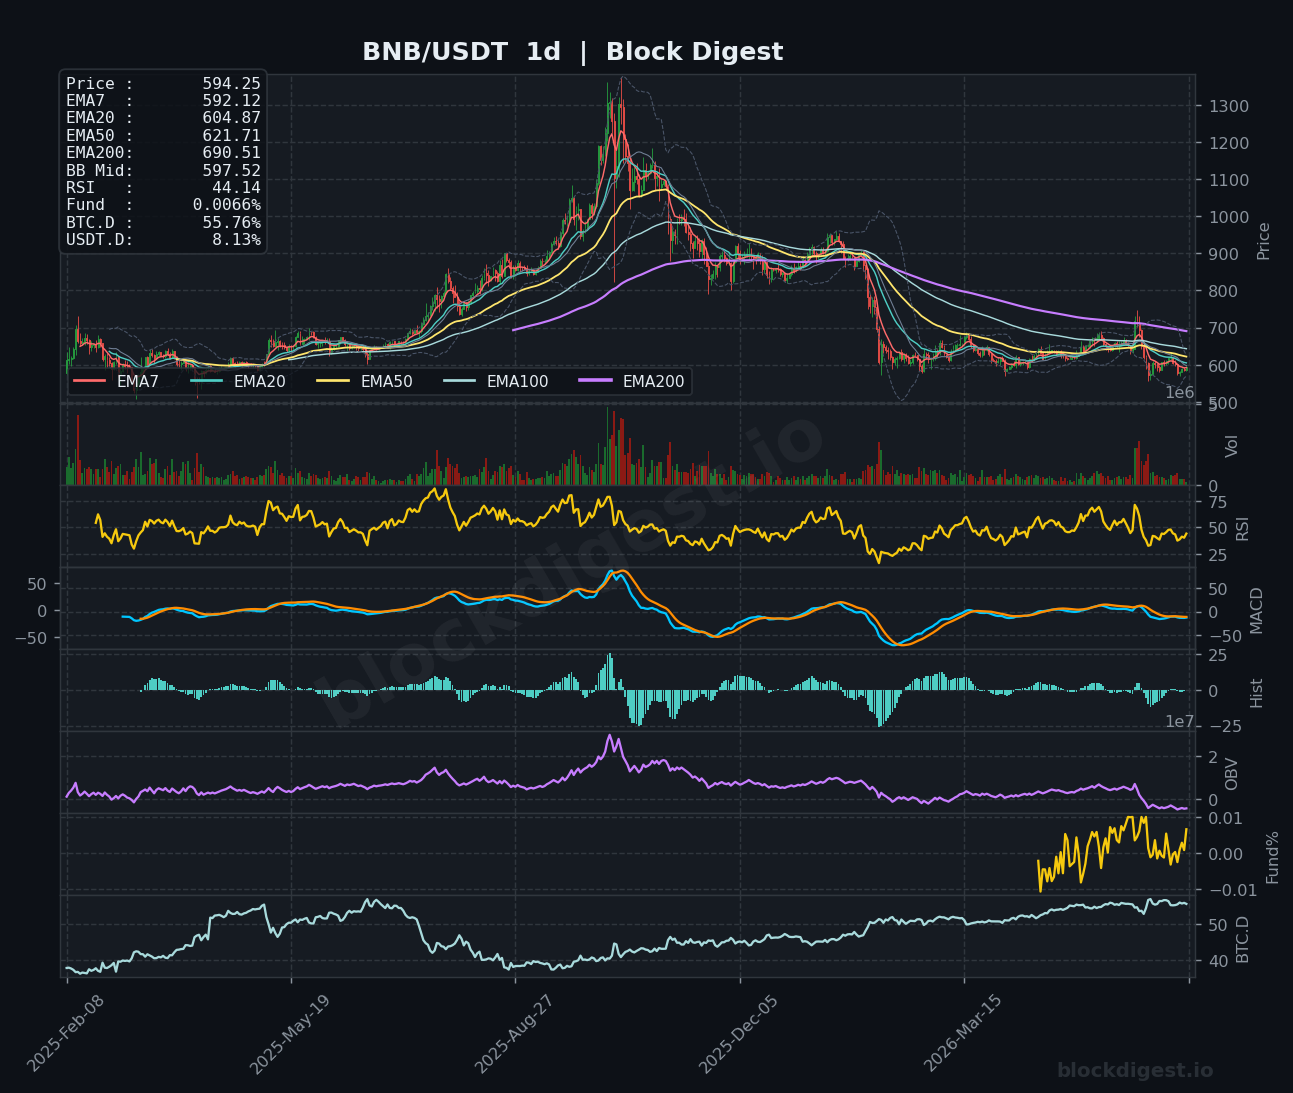
BNB is trading at $594.25, attempting to stabilize after a violent correction from a spike high near $730 that has since been almost entirely retraced. The 1h chart is relatively constructive — all short-term EMAs are tightly clustered between $588–$594, the RSI sits at 58.52, and the MACD is hovering just above zero, suggesting near-term buyers are tentatively in control. On the 4h frame, RSI at 54.84 and a MACD attempting a zero-line reclaim from deeply negative territory indicate the worst of the selling pressure may be behind it, though OBV remains in a downtrend reflecting persistent distribution. The daily chart is the most concerning, with the EMA20 ($604.87), EMA50 ($621.71), and EMA200 ($690.51) all acting as stacked overhead resistance and the RSI reading a bearish 44.14; a reclaim of $605–$610 is the minimum requirement to suggest a genuine base is forming.
Dogecoin (DOGE)
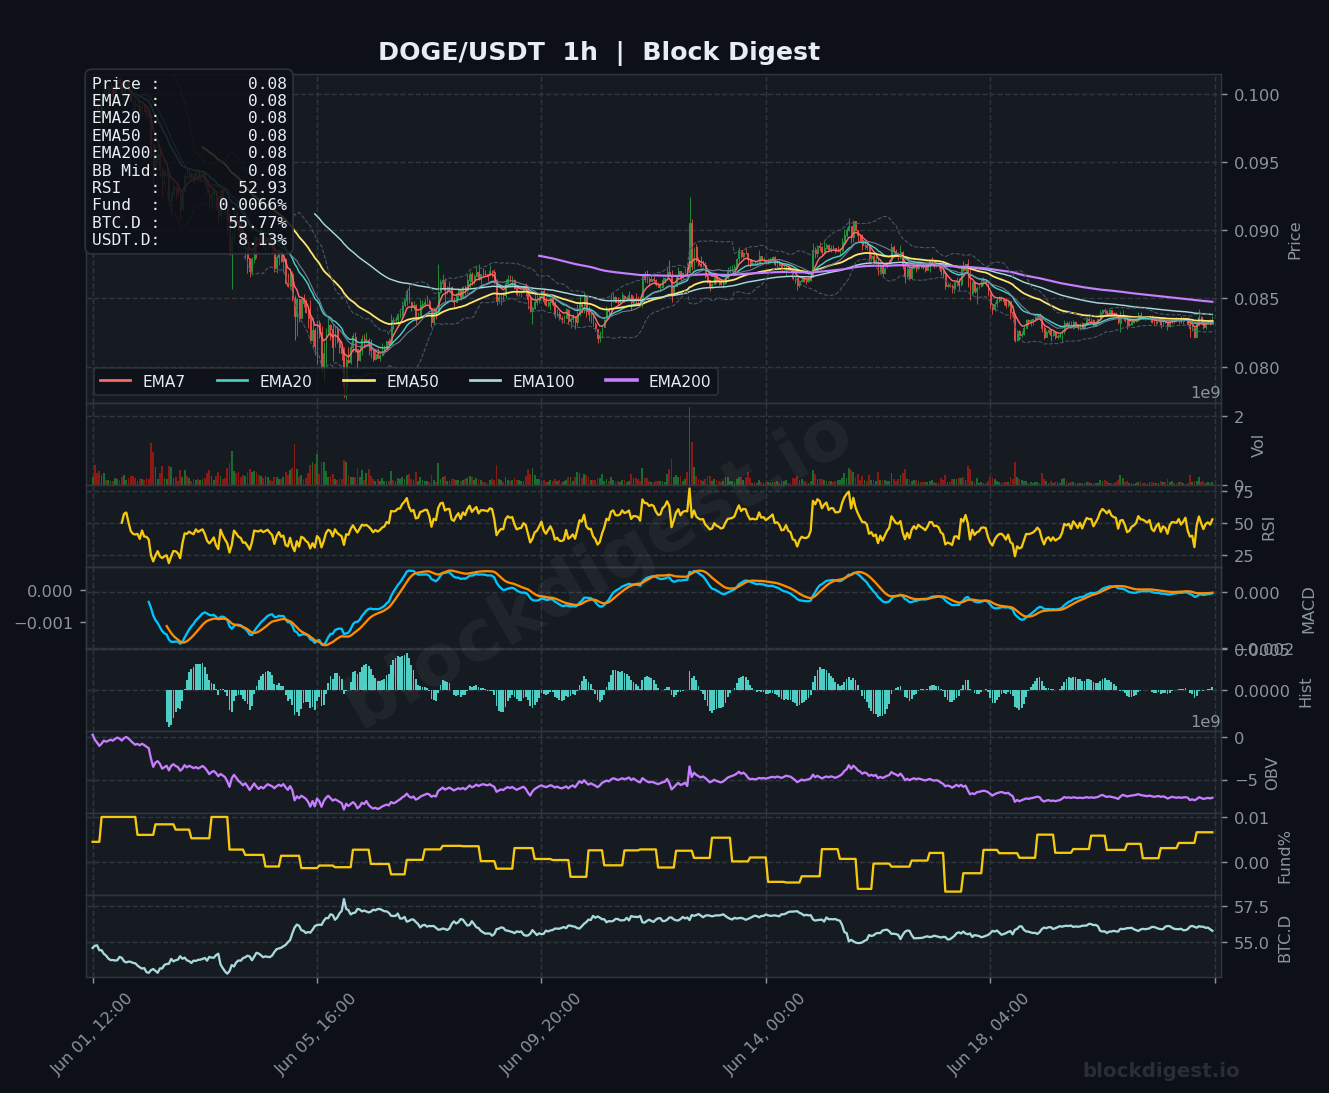
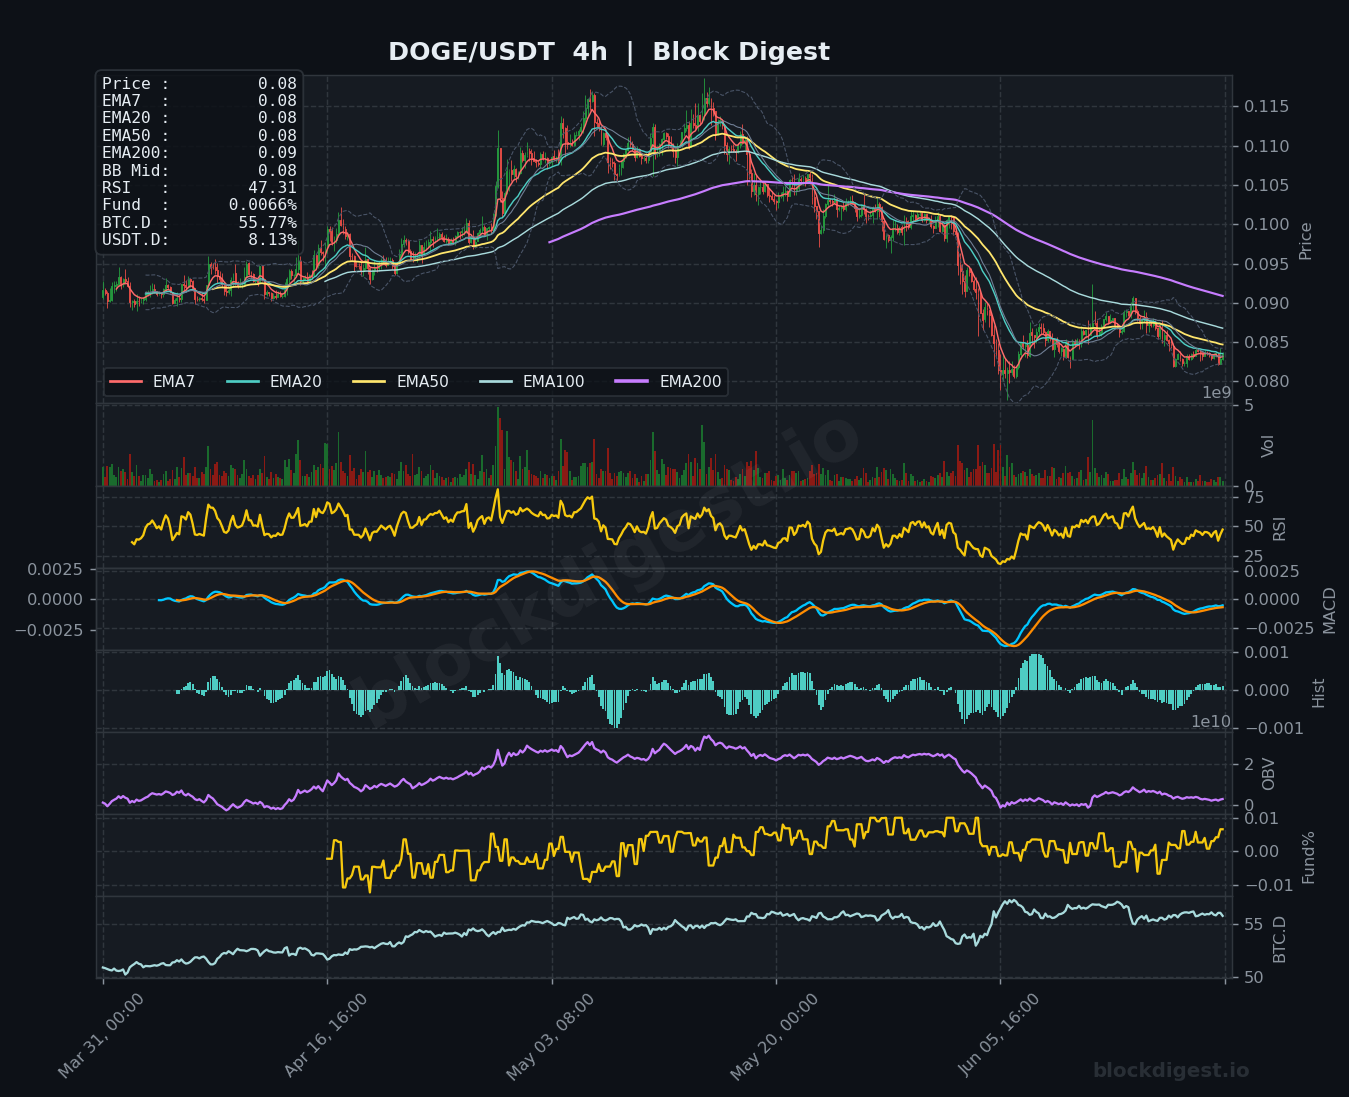
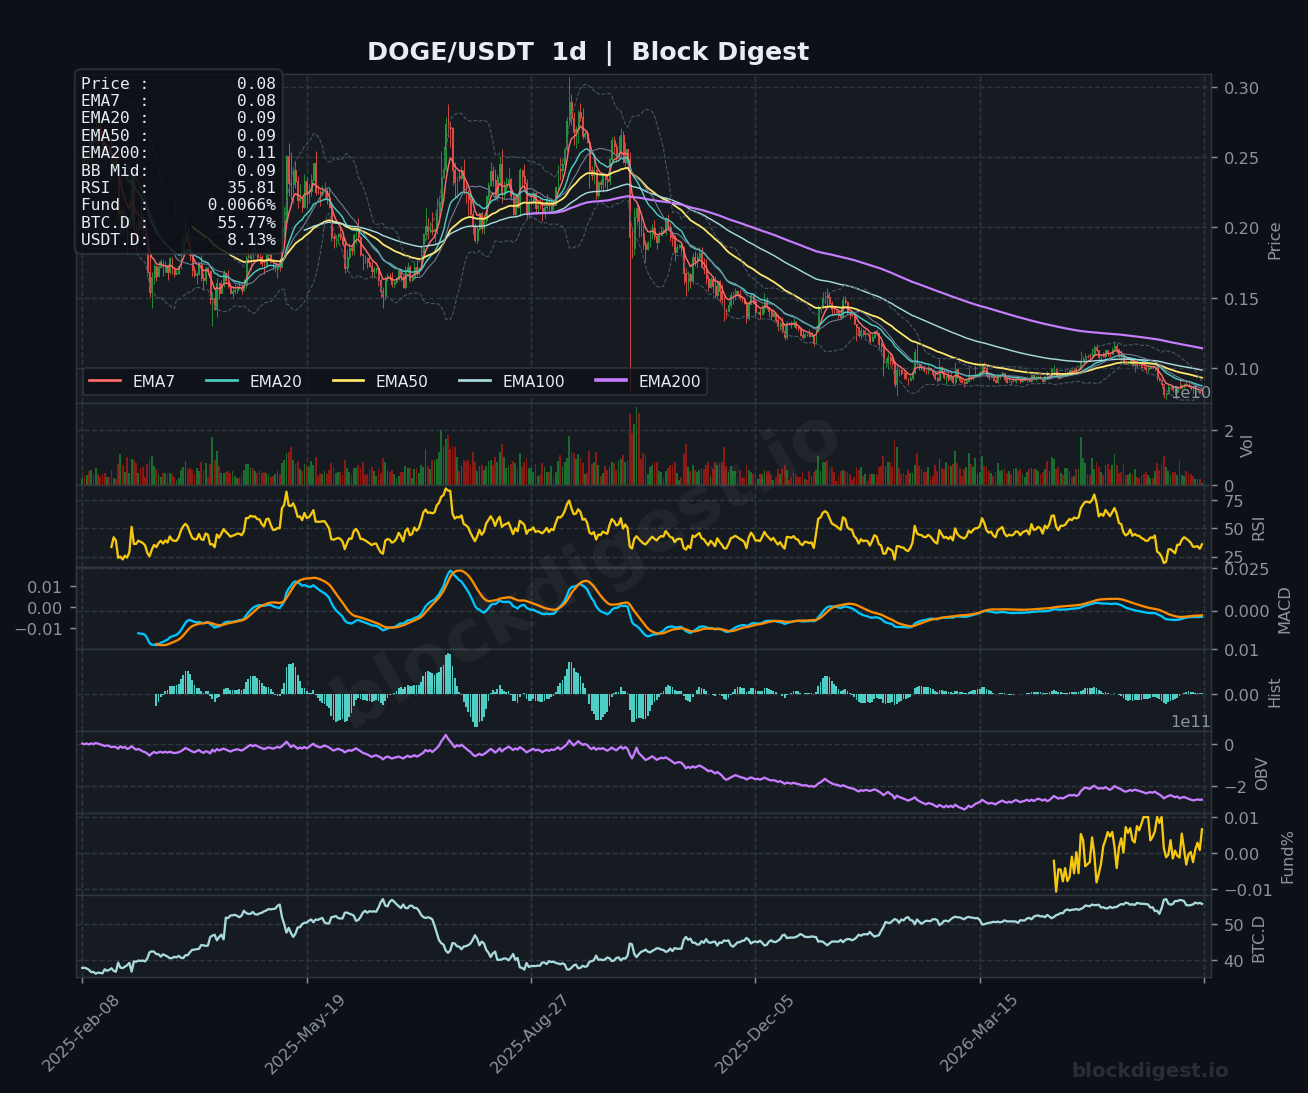
DOGE is trading at $0.0800, holding a narrow range that masks a prolonged downtrend extending from the $0.115 highs reached earlier in the cycle. The 1h RSI at 52.93 is neutral and price is essentially flat across all EMAs (EMA7 through EMA200 all reading $0.08), indicating extreme compression and a lack of directional conviction at this level. The 4h chart is more revealing — with RSI at 47.31 and the MACD signal lines converging near zero after a sustained bearish phase, DOGE looks range-bound but has not yet shown the kind of volume expansion or momentum divergence that would signal a meaningful reversal. The daily RSI at 35.81 is approaching oversold territory, and while the OBV trend remains deeply negative, any improvement in broader altcoin sentiment could offer a technical bounce opportunity with resistance near $0.088–$0.090.
Litecoin (LTC)
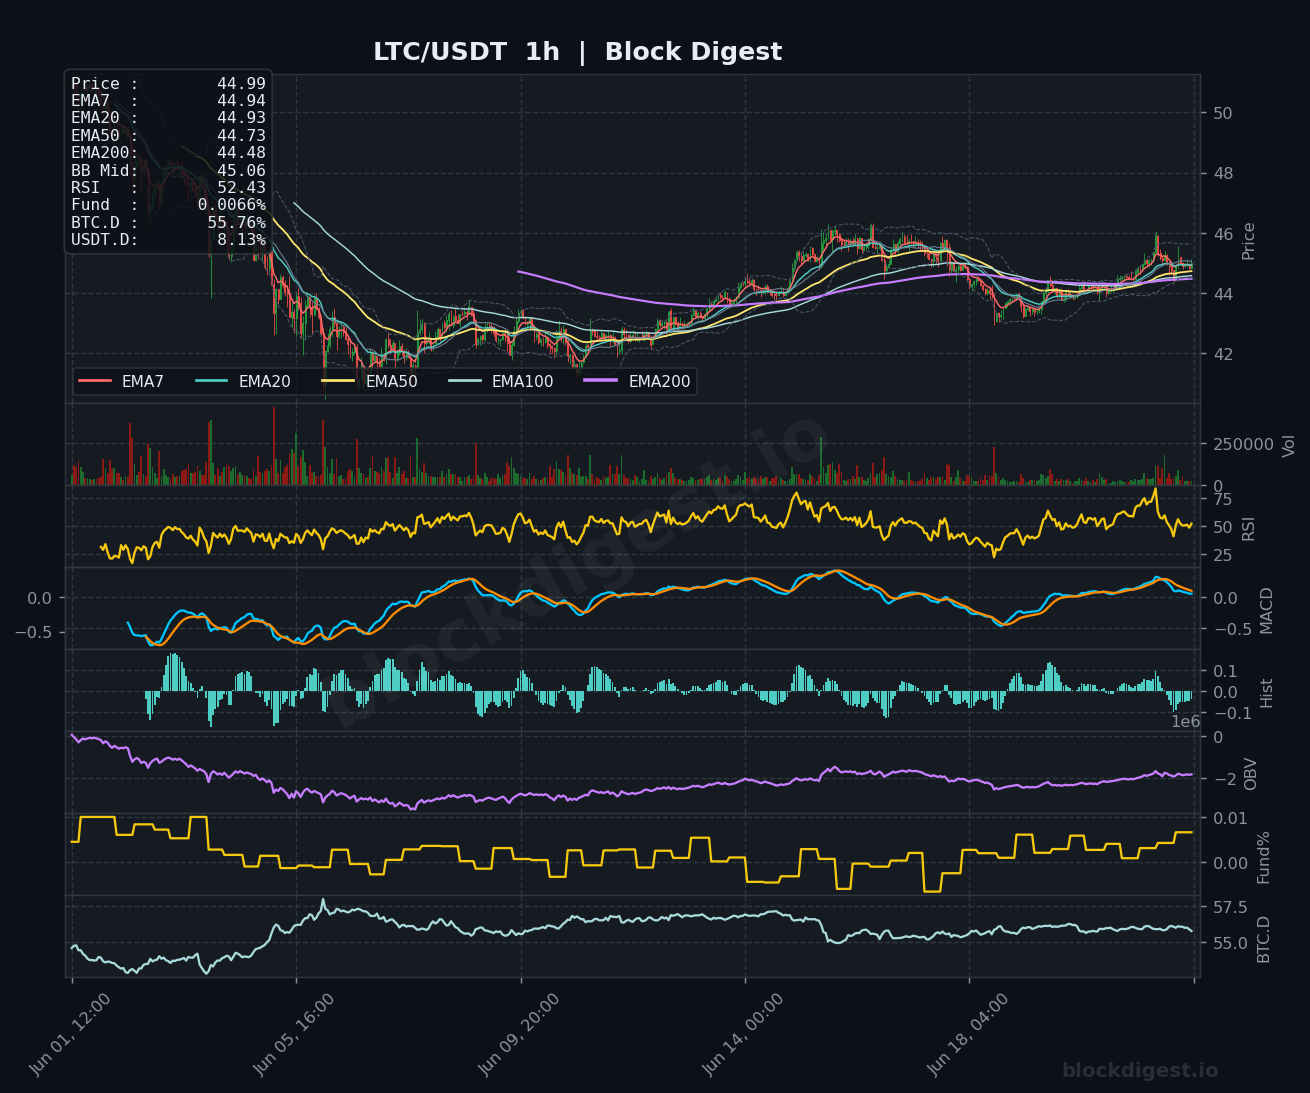
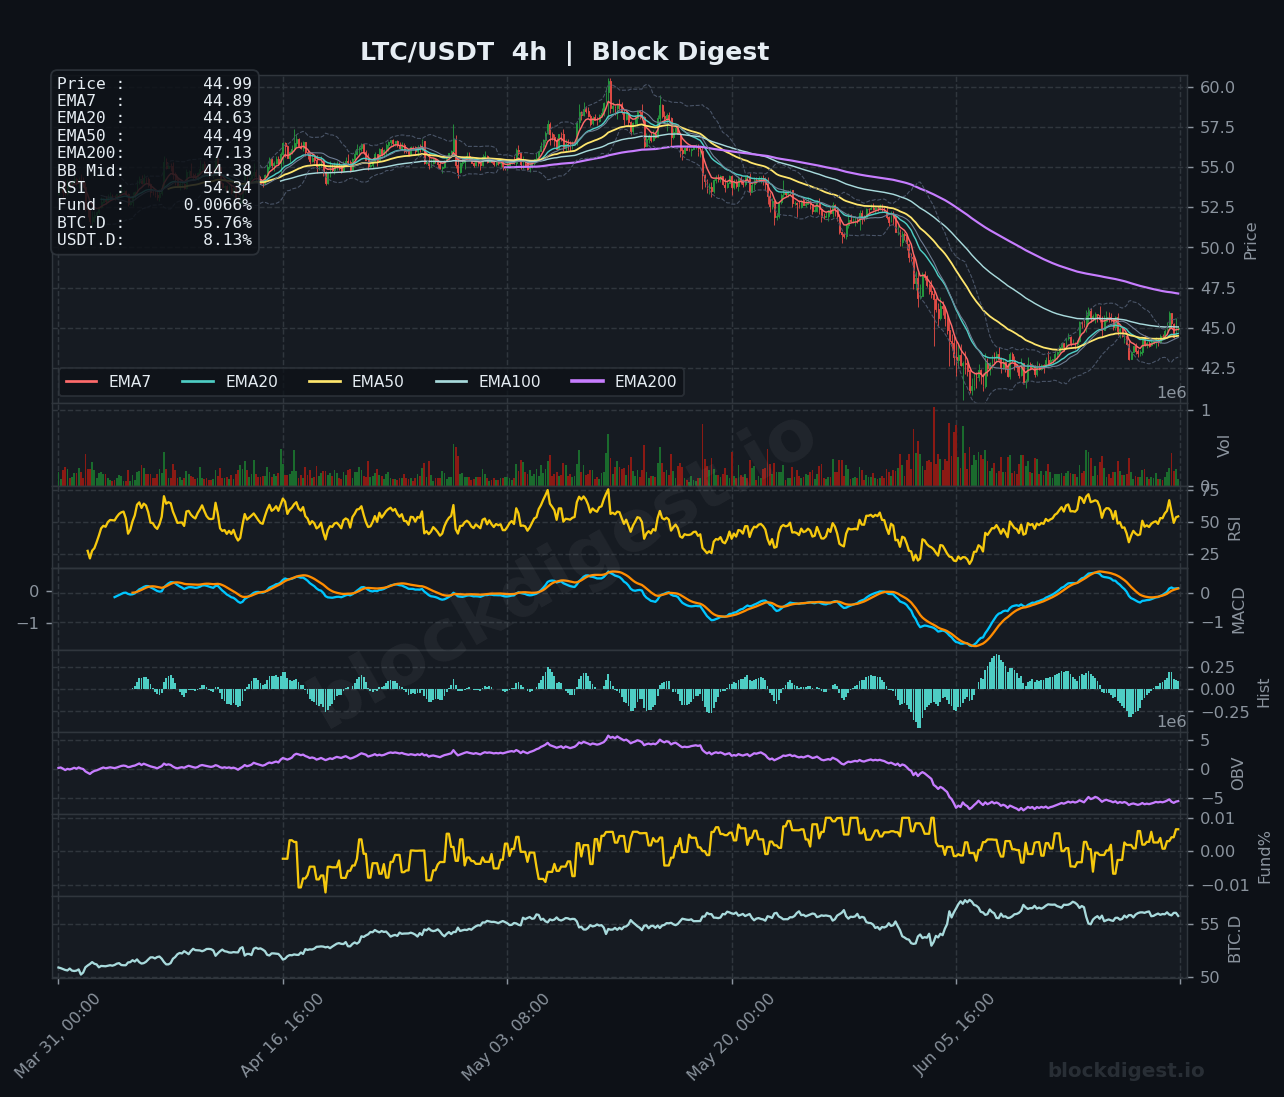
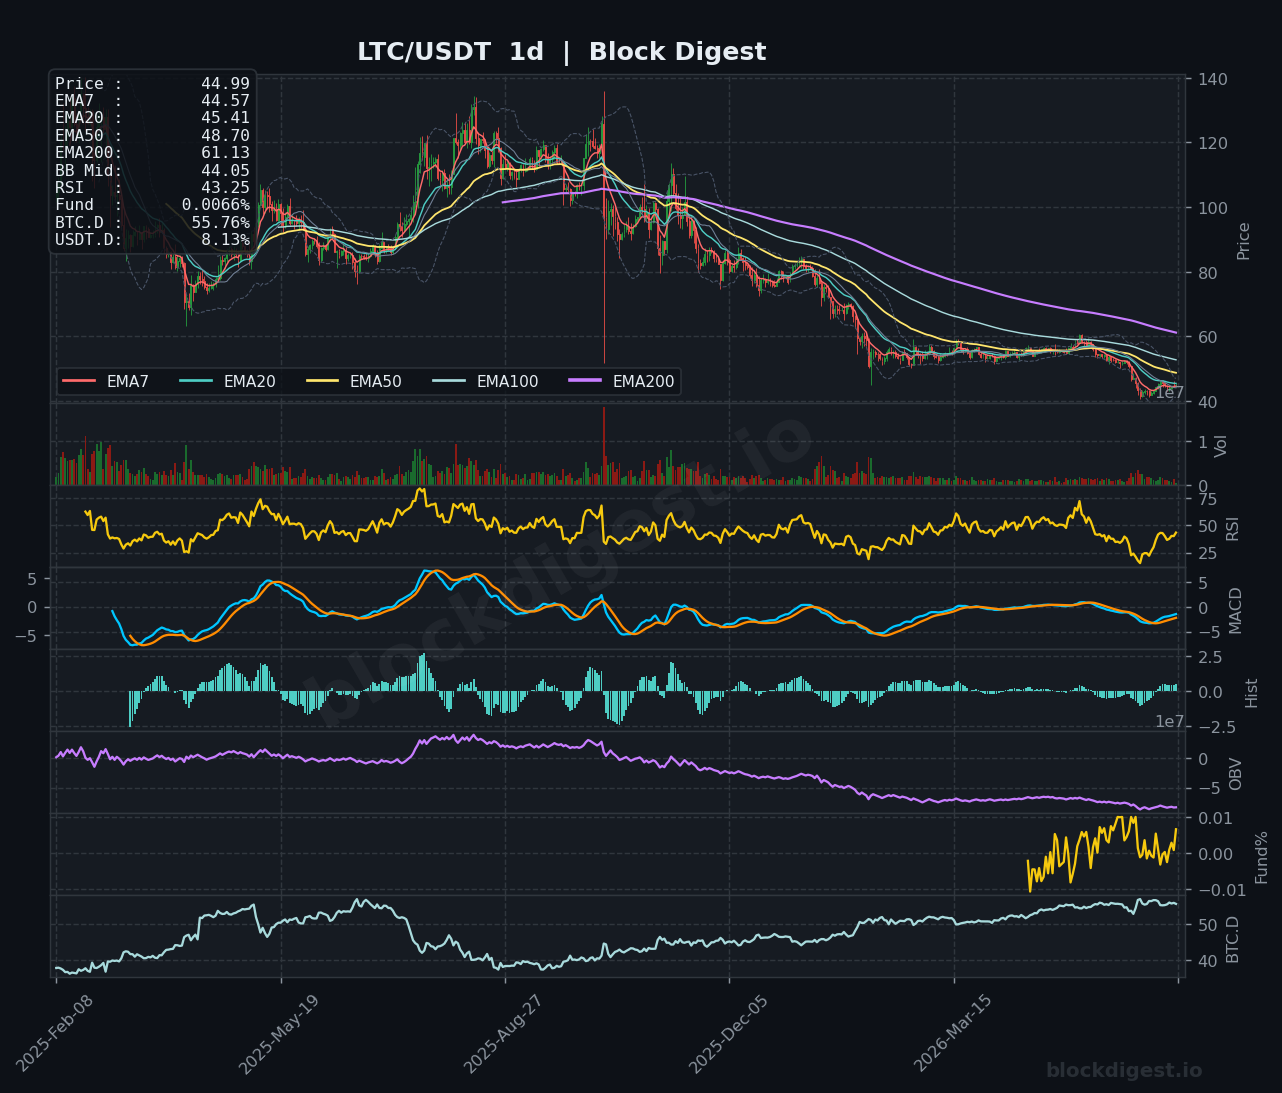
LTC is trading at $44.99, sitting at its lowest levels in the observed charting period after a sustained decline from highs above $60 earlier this year. On the 1h chart, the RSI at 52.43 is neutral and price has recently recaptured the EMA7 ($44.94), EMA20 ($44.93), and EMA50 ($44.73), suggesting a tentative short-term recovery is underway with the BB midline near $45.06 as immediate overhead. The 4h MACD is crossing from negative territory toward zero, with the RSI at 54.34 showing improving momentum, though the EMA200 at $47.13 remains a significant hurdle that has repelled prior recovery attempts. The daily chart remains structurally weak — RSI at 43.25, the EMA50 at $48.70 and EMA200 at $61.13 both far above current price, and OBV in a sustained downtrend — making LTC a short-term watch only with no compelling long-term setup until a close above $48 is achieved.
TRON (TRX)
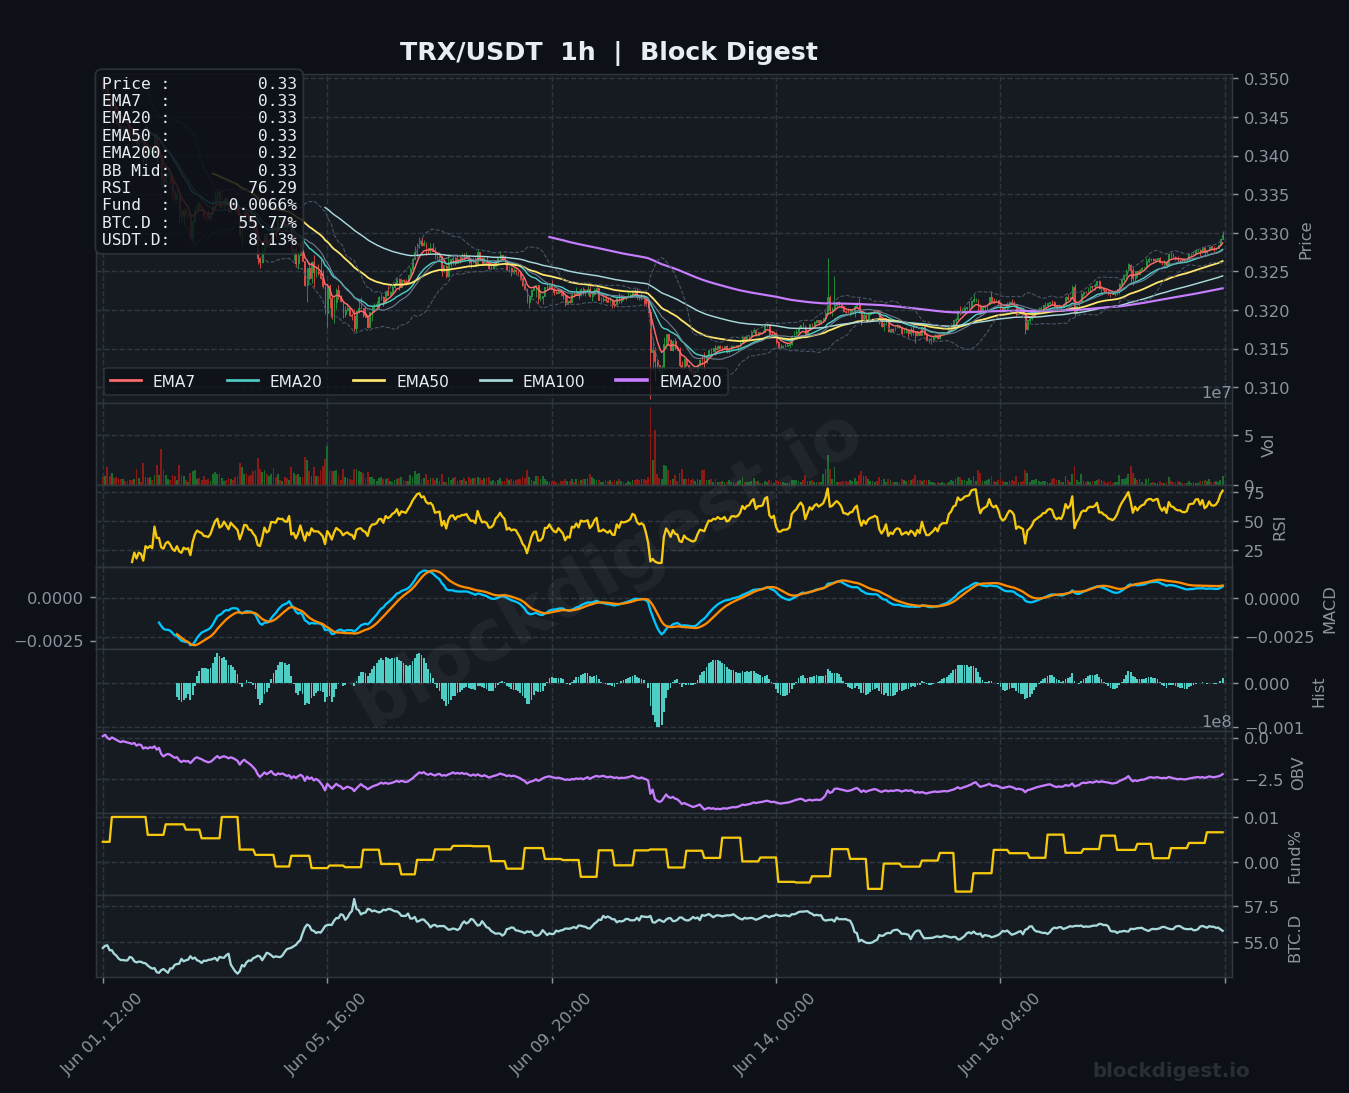
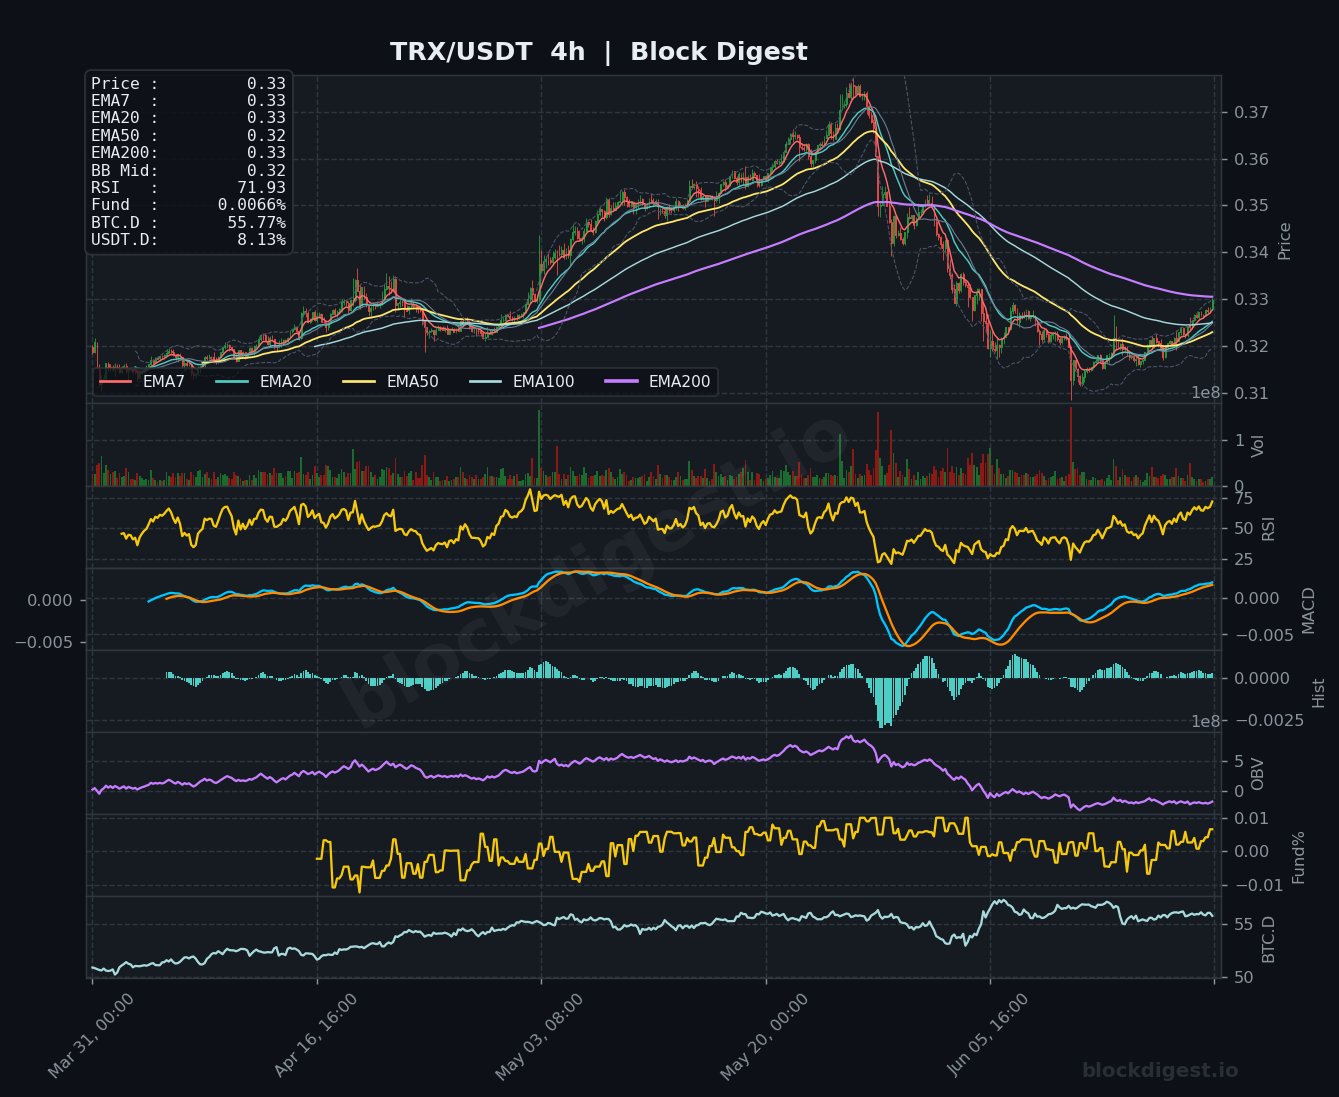
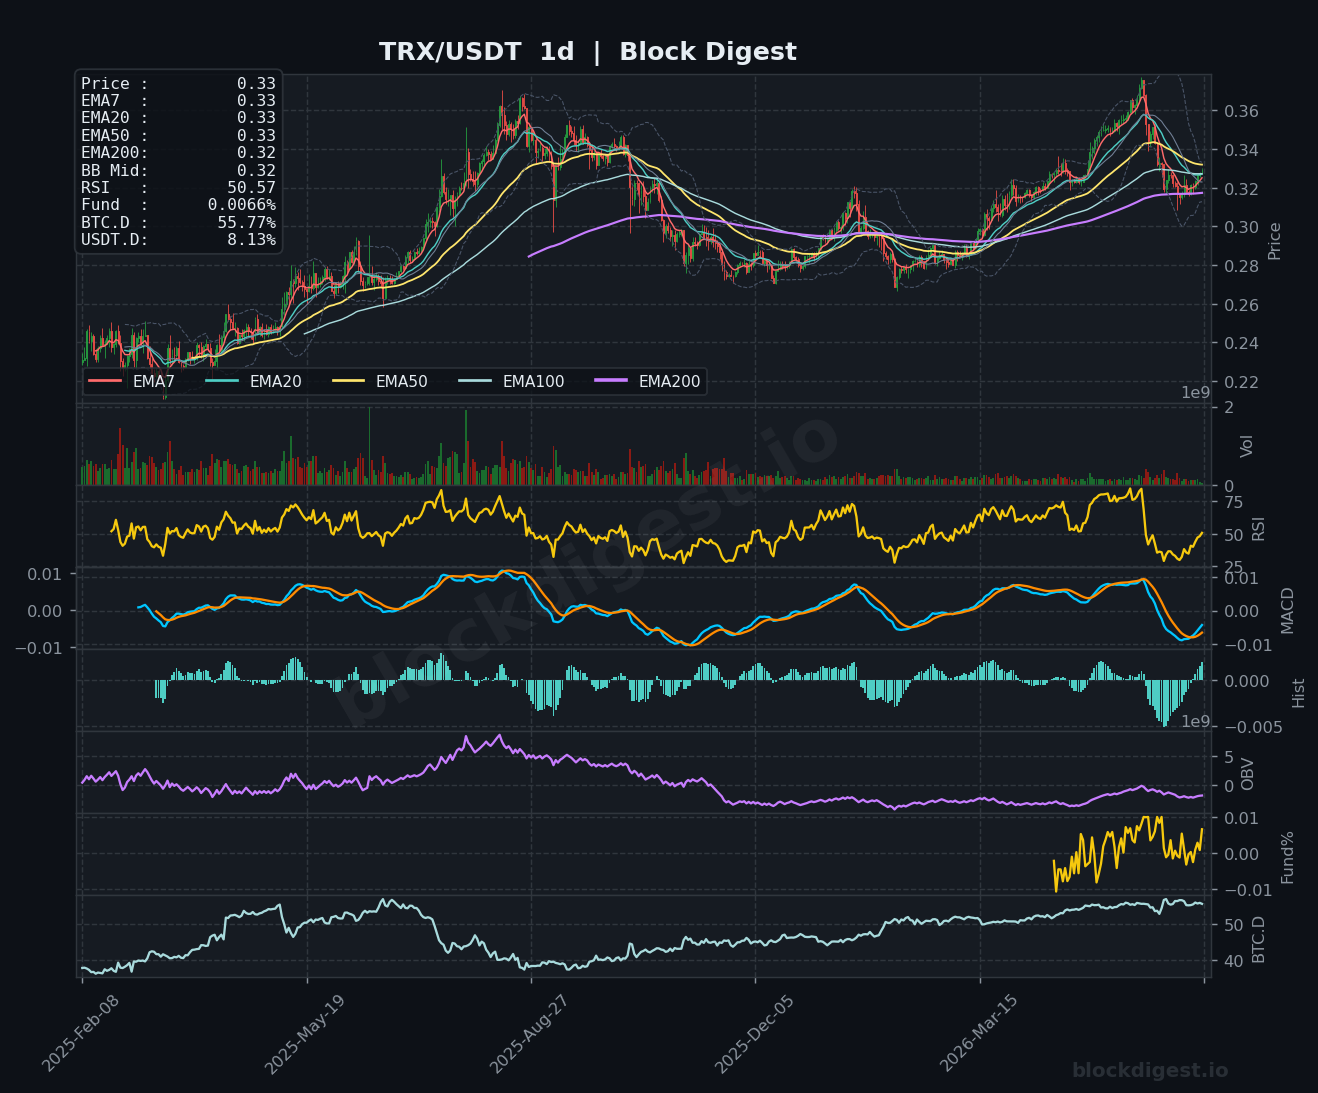
TRX stands out as the relative strength leader in today’s roundup, trading at $0.33 with the 1h RSI elevated at 76.29 — the only asset in this group currently printing in or near overbought territory. Price on the 1h chart is trading above all EMAs including the EMA200 at $0.32, and the MACD, while showing minimal histogram activity, has maintained a bullish cross above zero. The 4h chart corroborates the strength narrative with RSI at 71.93 and the MACD recovering from its post-correction lows, though the EMA200 at $0.33 is now being tested as both support and near-term resistance simultaneously. On the daily, TRX holds an RSI of 50.57 — the healthiest reading in this group — and the EMA50 ($0.33) and EMA200 ($0.32) are tightly aligned beneath price, suggesting the medium-term structure remains more intact than peers; however, the elevated short-term RSI warrants caution around an imminent pullback toward $0.31–$0.32.
Altcoin Outlook
The broader altcoin space as of June 22, 2026 remains in a recovery-attempt phase following a sharp multi-week correction, but the weight of technical evidence across timeframes suggests a full reversal has not yet been confirmed. TRX is the clear near-term relative strength leader with intact daily structure, while BNB shows the most stabilization potential given its tighter EMA compression and improving short-term momentum; XRP and DOGE present the weakest setups, with both printing sub-45 RSI values on the daily and no signs of structural base-building. The key conditions to watch across the space are BTC.D sustaining below 55.5% — which would signal capital rotation into alts — and USDT.D declining from its current 8.13% level, as both would be necessary prerequisites for any sustained altcoin recovery. Until those macro conditions shift, traders should favor range-bound strategies, keep position sizes conservative, and treat any bounces toward key EMA resistance levels as potential distribution zones rather than breakout confirmations.
Disclaimer: This analysis is for informational purposes only and does not constitute financial advice. Cryptocurrency markets are highly volatile and unpredictable. All trading decisions should be made based on your own research and risk tolerance. Block Digest is not responsible for any financial losses incurred as a result of acting on this content.
Stay Ahead of the Market
Follow BlockDigest for crypto market intelligence, research and real-time updates.


