
Market Overview
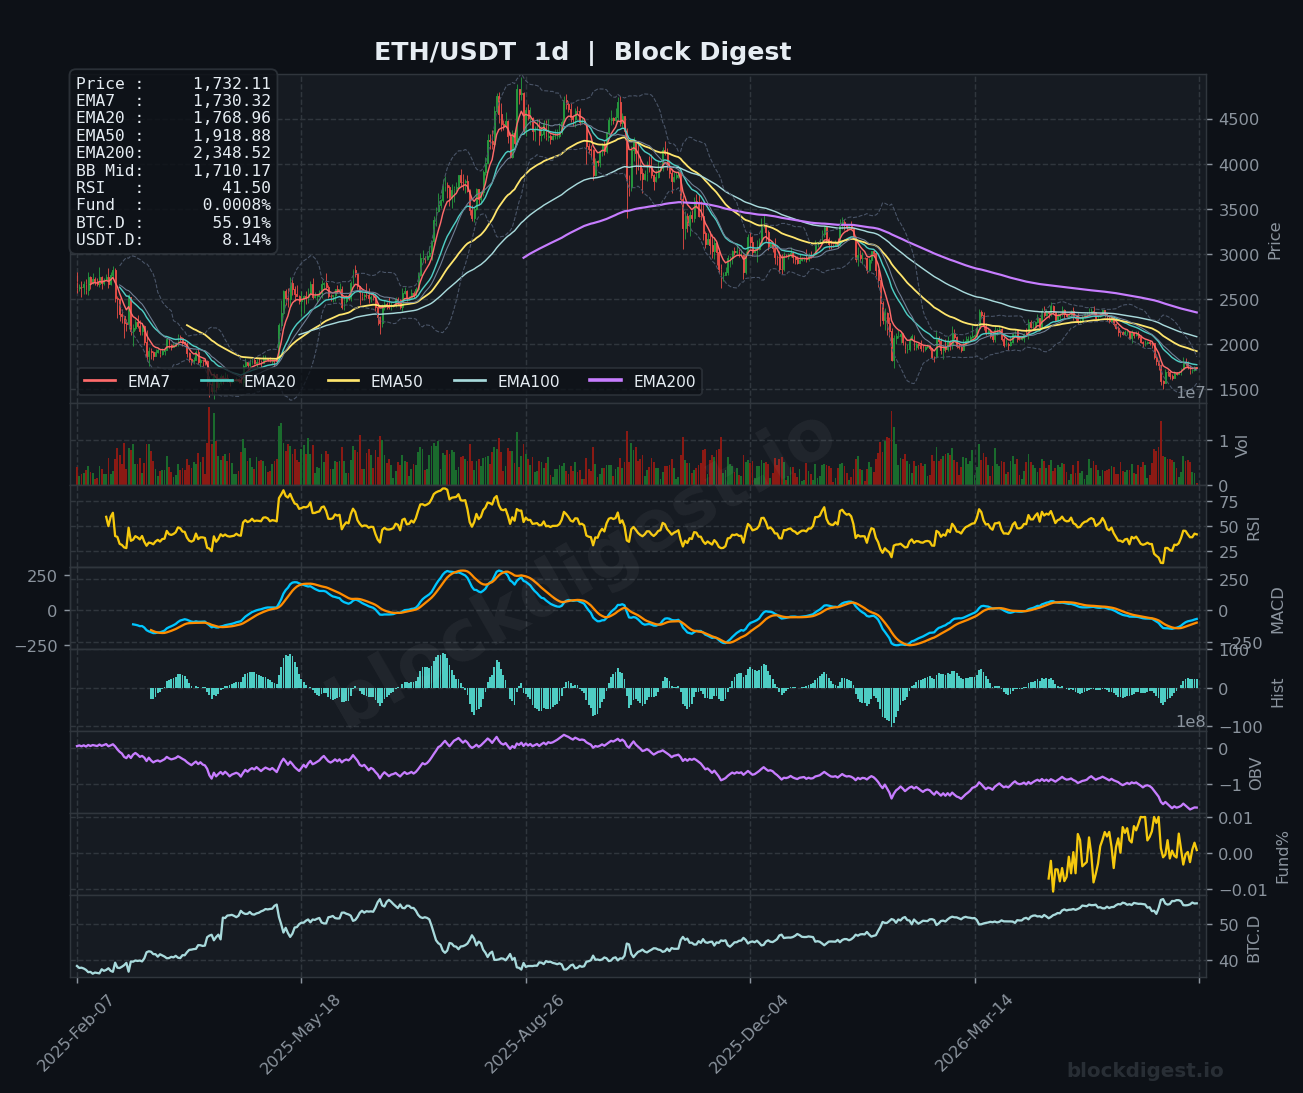
ETH/USDT is currently trading at $1,732.11, sitting in a structurally precarious position on the daily timeframe following a prolonged downtrend from highs above $4,000. Price is trading below the daily EMA20 ($1,768.96), EMA50 ($1,918.88), and far beneath the EMA200 ($2,348.52), confirming that the dominant macro trend remains firmly bearish. On the positive side, the daily Bollinger Band midline sits at $1,710.17, and price is currently hovering just above it — a tentative sign that the recent bounce from lows around $1,540–$1,600 may be attempting to establish short-term support. The Bollinger Bands on the daily remain wide, reflecting the sustained volatility of the preceding sell-off.
Multi-Timeframe Confluence
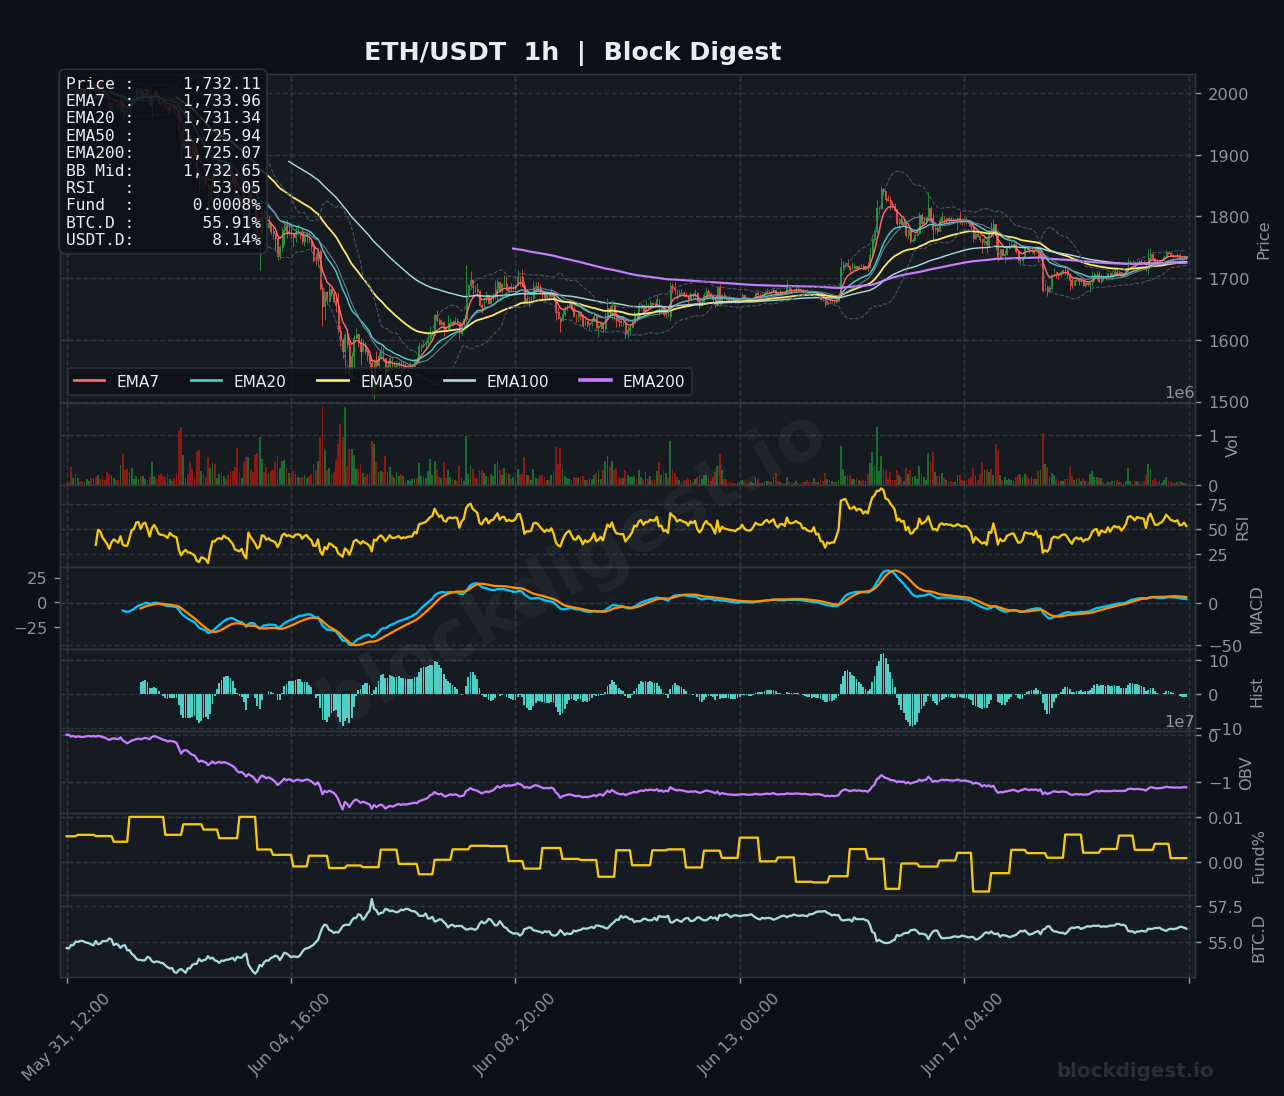
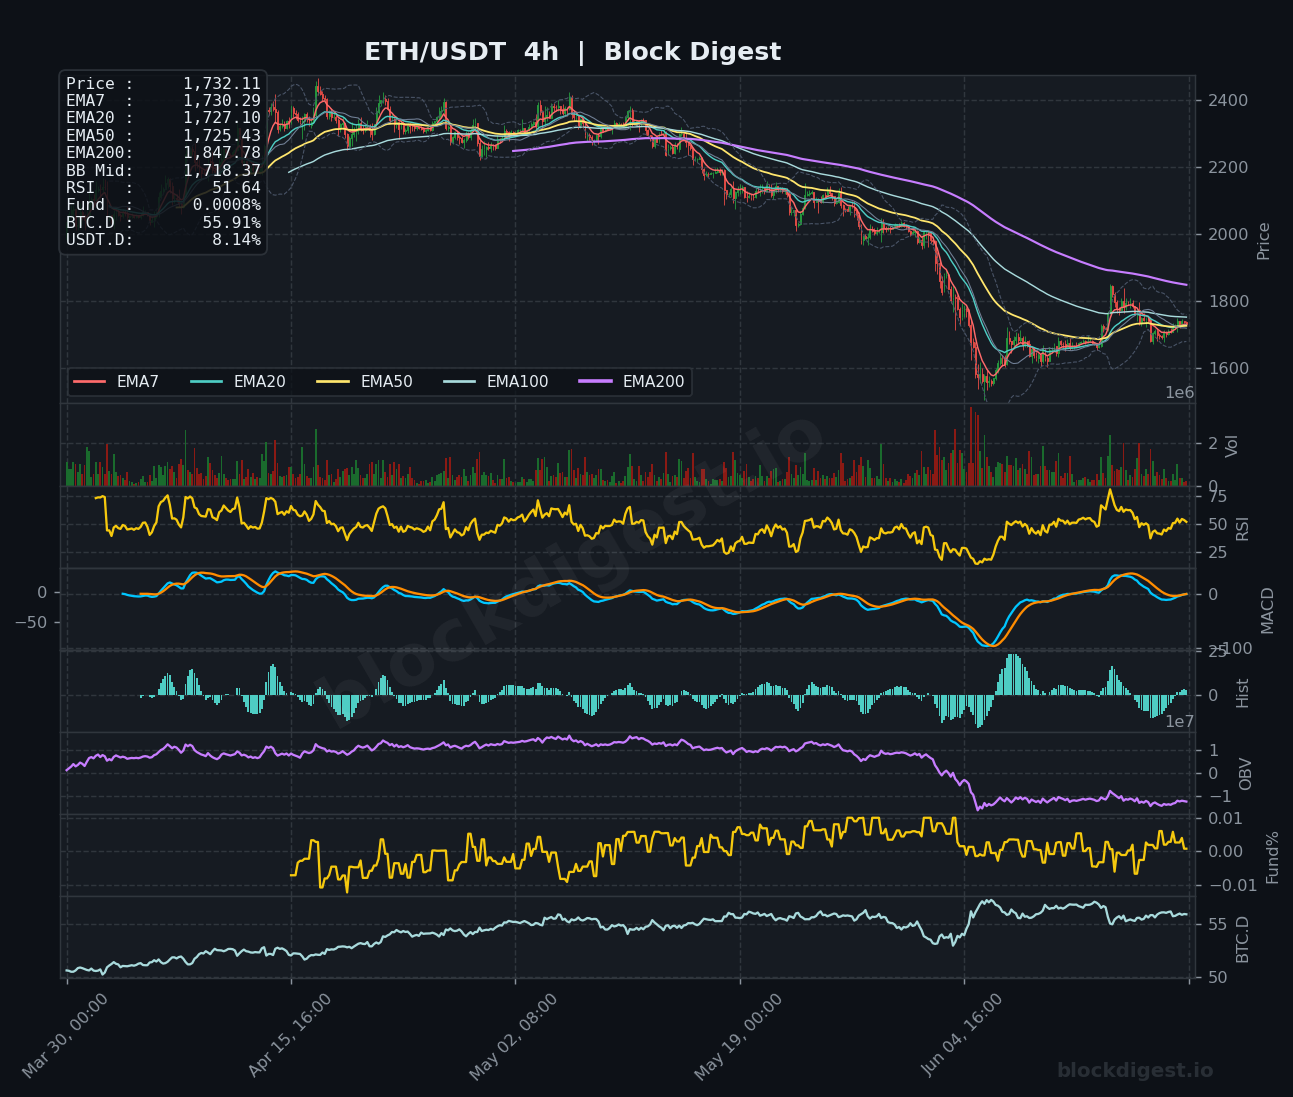
Across all three timeframes, ETH is exhibiting a notably compressed EMA structure at the shorter intervals, with the 1h EMAs (EMA7: $1,733.96, EMA20: $1,731.34, EMA50: $1,725.94, EMA200: $1,725.07) tightly clustered within a $9 range — signaling indecision and potential for a directional break. The 4h chart shows price trading above its short-term EMAs (EMA7: $1,730.29, EMA20: $1,727.10, EMA50: $1,725.43) but remains deeply beneath the 4h EMA200 at $1,847.78, reinforcing that any recovery is still operating within a broader bearish context. The daily timeframe shows no bullish EMA crossovers of significance, and the EMA stack remains in full bearish order from EMA7 through EMA200. Short-term momentum is attempting a stabilization, but it has not yet generated enough conviction to challenge the higher timeframe trend.
Key Levels to Watch
- Resistance: $1,768.96 — Daily EMA20, the first meaningful dynamic resistance that capped prior recovery attempts and must be reclaimed for any bullish thesis to develop.
- Resistance: $1,847.78 — The 4h EMA200, a major structural barrier reflecting the longer-term bearish trend; a sustained close above this level would signal a meaningful shift.
- Resistance: $1,918.88 — Daily EMA50, a macro level that has not been tested since the breakdown; reclaiming it would indicate a true trend reversal attempt.
- Support: $1,718.37 — 4h Bollinger Band midline, acting as immediate intraday support; losing this level on a 4h close would signal renewed selling pressure.
- Support: $1,710.17 — Daily Bollinger Band midline, a critical near-term floor; a decisive daily close below here would likely open a retest of recent swing lows.
- Support: $1,620–$1,640 — Recent swing low zone visible on the 4h chart, representing the last significant demand area before price enters historically thin liquidity.
Momentum & On-Chain Signals
The RSI readings paint a clear divergence between timeframes: the 1h RSI at 53.05 and the 4h RSI at 51.64 both sit near neutral, suggesting neither strong buying nor selling pressure in the short term. However, the daily RSI at 41.50 remains in bearish territory, approaching the oversold threshold but not yet triggering it — indicating the macro downtrend still holds sway. The 4h MACD shows the signal line beginning to converge toward zero from deeply negative territory, with histogram bars slowly shrinking toward neutral, a tentative sign of bearish exhaustion rather than confirmed bullish reversal. OBV on both the 4h and daily charts continues to trend downward, reflecting persistent distribution and the absence of sustained institutional accumulation at current levels. Funding rates across all timeframes remain near neutral at 0.0008%, suggesting the market is not yet positioned aggressively in either direction.
BTC Dominance & Market Sentiment
BTC dominance (BTC.D) is currently elevated at 55.91%, which historically correlates with capital rotating away from altcoins and into Bitcoin — a headwind for ETH’s near-term price recovery. USDT dominance (USDT.D) at 8.14% remains relatively elevated, indicating that a meaningful portion of crypto market capital is still sitting on the sidelines in stablecoins, reflecting cautious risk appetite. For ETH specifically, a sustained decline in BTC.D below the 55% level would be a necessary precondition for any meaningful altcoin rotation back into Ethereum.
Risk Scenarios
- Bullish case: A confirmed 4h close above $1,768.96 (daily EMA20), accompanied by expanding volume and an RSI breakout above 55 on the daily, would open the path toward the $1,847.78 (4h EMA200) and potentially $1,920 in the near term. This scenario requires BTC.D to begin declining and USDT.D to roll over simultaneously.
- Bearish case: A daily close below $1,710 (daily BB midline), combined with renewed MACD bearish divergence on the 4h and declining OBV, would signal a breakdown targeting the $1,620–$1,640 swing low zone, with extended weakness potentially threatening sub-$1,580 levels.
Outlook
The overall bias for ETH/USDT as of June 21, 2026, remains cautiously bearish on the macro timeframe, with a neutral-to-mildly-constructive tone emerging on shorter intervals due to the tightly clustered EMA structure and stabilizing momentum indicators. The critical trigger to watch over the next 24–48 hours is whether price can sustain above $1,718–$1,732 and begin mounting a challenge of the daily EMA20 at $1,768.96 — failure to do so will likely invite renewed selling. A reduction in BTC.D below 55% combined with volume expansion on any hourly breakout would substantially improve the short-term bull case. Until ETH reclaims at minimum the daily EMA20 on a closing basis, rallies should be treated as counter-trend bounces within an ongoing macro downtrend.
Disclaimer: This analysis is for informational purposes only and does not constitute financial advice. Cryptocurrency markets are highly volatile and unpredictable. All trading decisions should be made based on your own research and risk tolerance. Block Digest is not responsible for any financial losses incurred as a result of acting on this content.
Stay Ahead of the Market
Follow BlockDigest for crypto market intelligence, research and real-time updates.


