
Market Overview
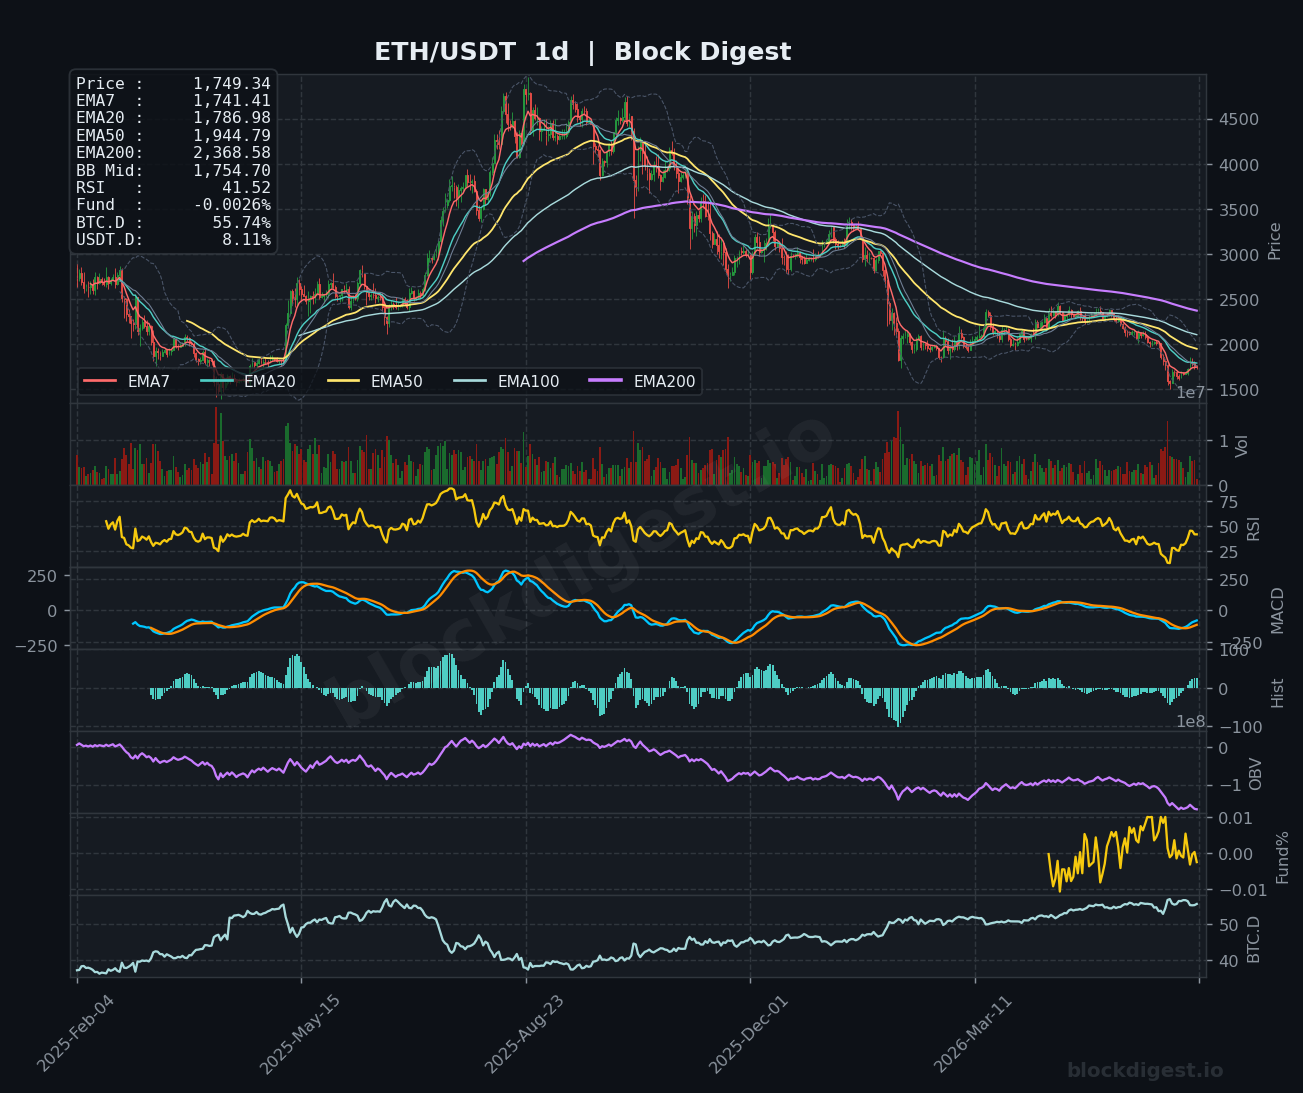
ETH/USDT is currently trading at $1,749.31, sitting in a structurally weak position across all major timeframes. On the daily chart, price remains well below its EMA50 ($1,944.79), EMA100, and the steeply declining EMA200 ($2,368.58), confirming that the dominant trend is firmly bearish. The Bollinger Band midline on the daily sits at $1,754.70, with price hugging just beneath it — a failure to reclaim this level would reinforce continued downside pressure. Following a sharp multi-month drawdown from highs above $4,000, the recent price action reflects a tentative stabilization attempt rather than a confirmed recovery.
Multi-Timeframe Confluence
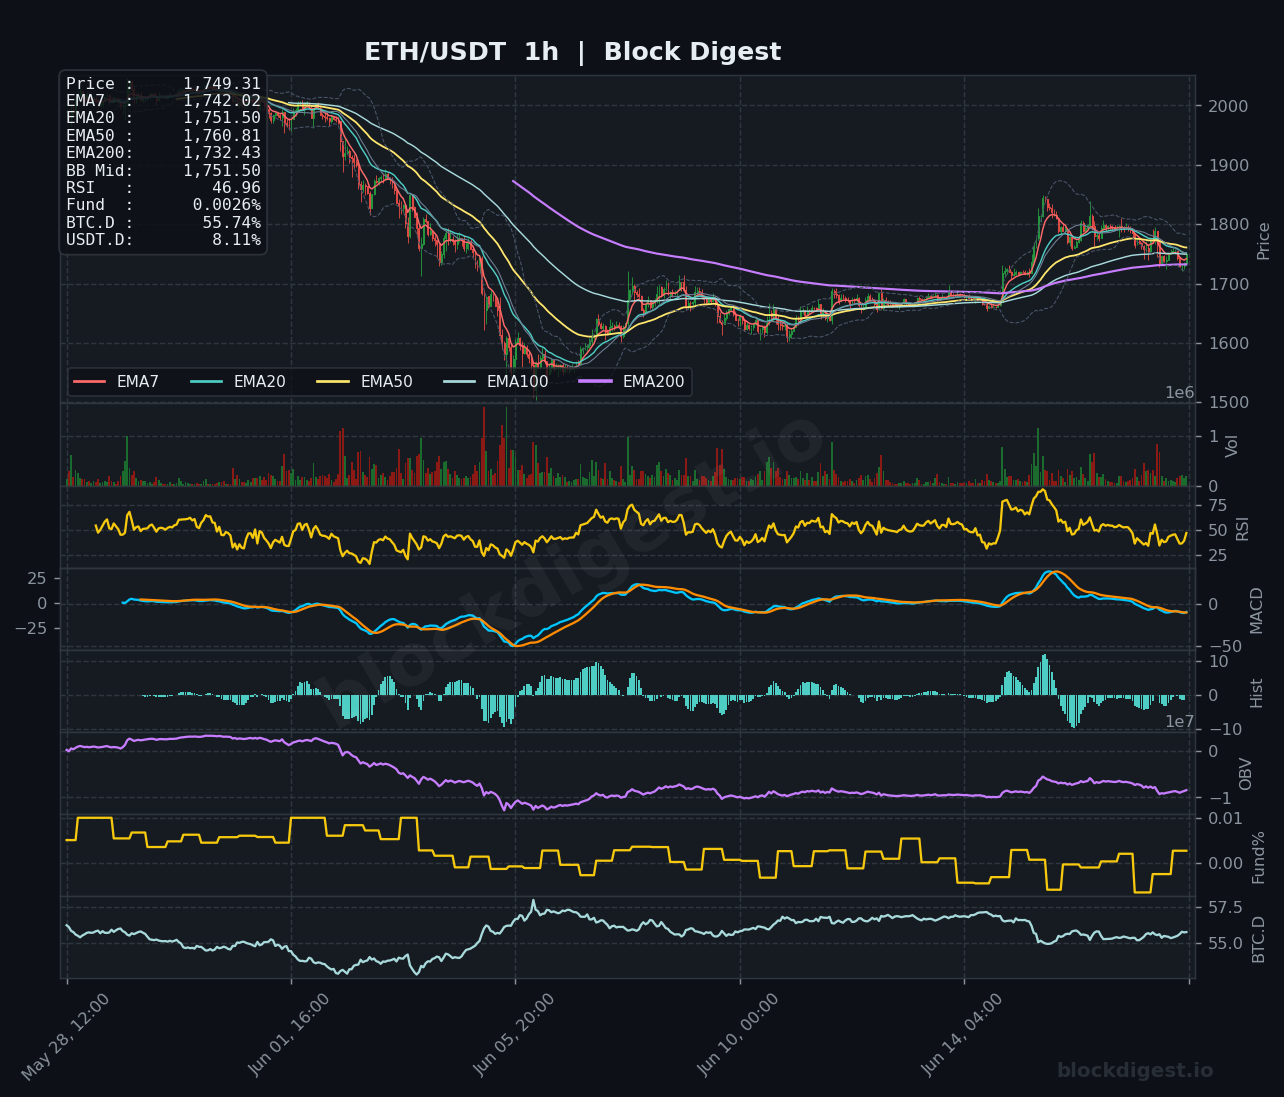
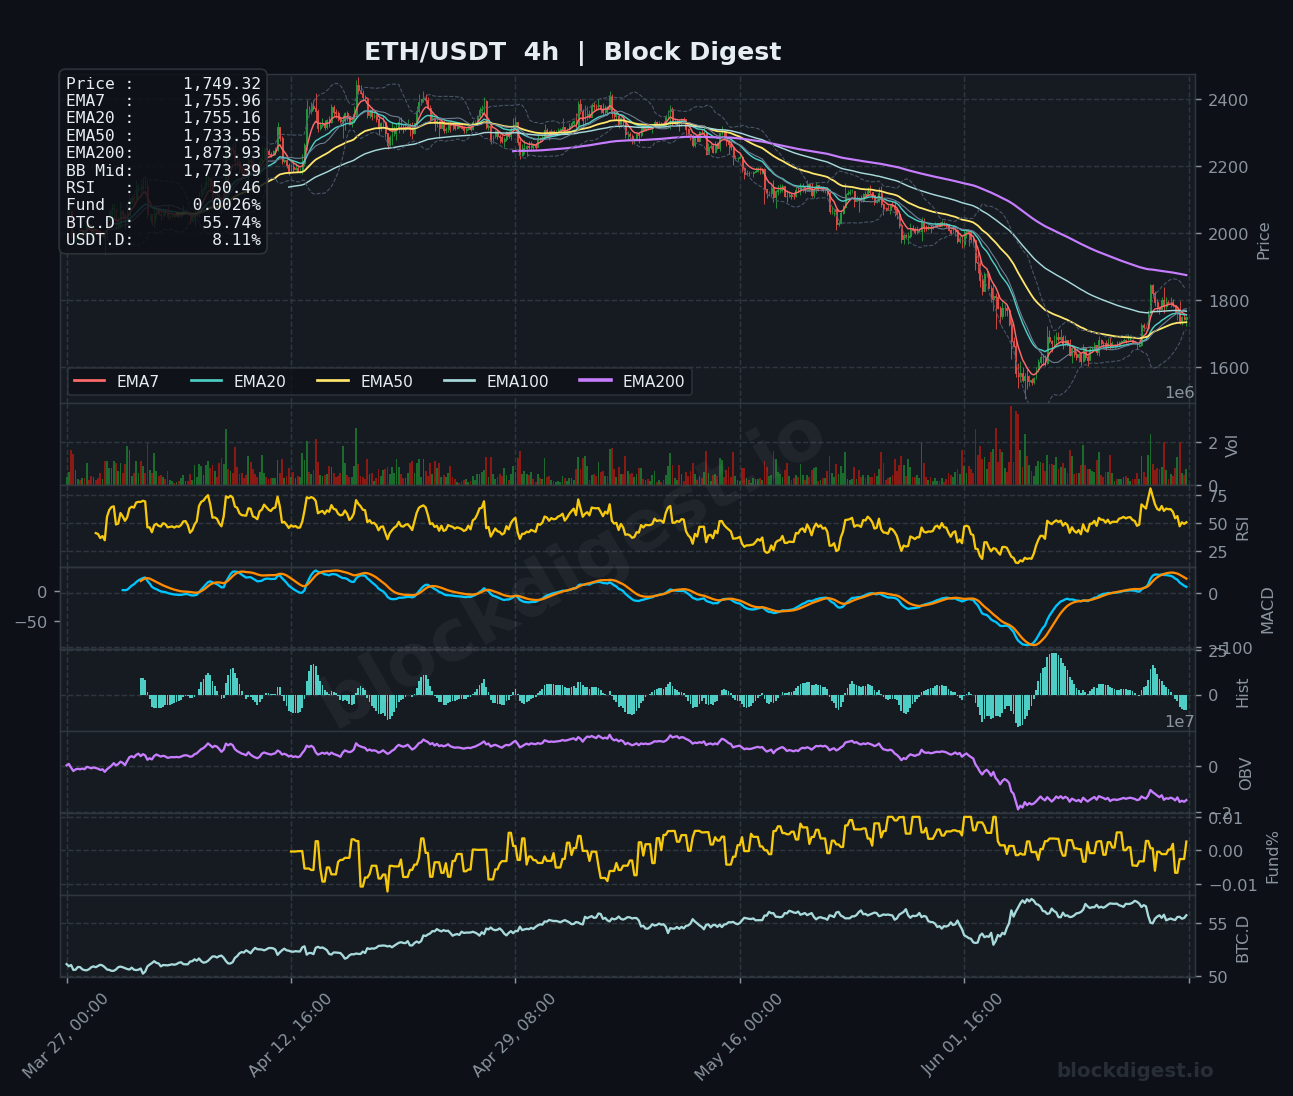
Across all three timeframes, EMAs remain in a bearish stack, with short-term averages sitting below longer-term ones on both the 4h and daily charts — a clear sign that the broader downtrend has not been invalidated. On the 1h chart, price trades above the EMA200 ($1,732.43) but below the EMA50 ($1,760.81) and is essentially chopping around the EMA7 ($1,742.02) and EMA20 ($1,751.50), suggesting consolidation rather than directional momentum. The 4h chart shows the EMA7 ($1,755.96) and EMA20 ($1,755.16) tightly compressed just above current price, forming an immediate overhead resistance cluster, while the EMA200 ($1,873.93) remains a distant macro resistance ceiling. Short-term momentum on the 1h appears neutral-to-mildly recovering, but it fails to meaningfully challenge the bearish structure visible on the 4h and daily frames.
Key Levels to Watch
- Resistance: $1,755–$1,760 — tightly compressed 4h EMA7/EMA20 cluster and 1h EMA50 acting as immediate ceiling; $1,786.98 — daily EMA20, representing the first significant moving average resistance on the macro chart; $1,873.93 — 4h EMA200, a key recovery threshold that would need to be reclaimed to shift intermediate-term sentiment.
- Support: $1,732.43 — 1h EMA200, the nearest dynamic support that has been holding price on short-term pullbacks; $1,700 — round psychological level and approximate lower Bollinger Band region on the 4h; $1,600–$1,620 — structural lows from the recent capitulation wick, representing the most critical macro floor to defend.
Momentum & On-Chain Signals
The daily RSI at 41.52 remains in bearish territory, below the neutral 50 threshold, and has not yet shown a decisive recovery attempt — though it is trending up marginally from oversold lows. On the 4h timeframe, RSI has recovered to 50.46, a neutral reading that reflects the current indecision, while the 1h RSI at 46.96 leans slightly bearish. The 4h MACD shows a nascent bullish crossover attempt with the signal line converging, but the histogram remains thin, offering little conviction. The OBV on both the 4h and daily charts reflects a persistent downtrend consistent with distribution, though the daily OBV has recently begun to flatten — a cautiously constructive signal worth monitoring. The funding rate at +0.0026% is essentially neutral, indicating no significant long or short bias from perpetual futures traders.
BTC Dominance & Market Sentiment
BTC dominance at 55.74% remains elevated, suggesting capital continues to favor Bitcoin over altcoins in the current risk environment, which structurally suppresses altcoin outperformance including ETH. USDT dominance at 8.11% remains relatively high, indicating a meaningful portion of market participants are still parked in stablecoins — reflecting cautious risk appetite rather than active deployment into risk assets. For ETH specifically, a sustained decline in BTC.D combined with a drop in USDT.D would be a prerequisite for any meaningful altcoin-led rally.
Risk Scenarios
- Bullish case: A decisive hourly close above $1,760 followed by consolidation above the 4h EMA cluster ($1,755–$1,756) would open the path toward $1,786 (daily EMA20) and potentially $1,850–$1,875 on a momentum continuation; confirmation would require OBV turning higher and RSI breaking above 55 on the 4h.
- Bearish case: A failure to hold $1,732 on the 1h (EMA200) and a subsequent break below $1,700 would signal renewed distribution pressure, targeting the $1,620 support zone and leaving the $1,600 macro low exposed as the next major test.
Outlook
The directional bias for ETH over the next 24–48 hours is cautiously neutral with a slight bearish lean, given the persistent weight of declining higher-timeframe EMAs and the lack of volume conviction on recent bounces. The $1,755–$1,760 resistance band is the critical short-term battleground — a clean break and hold above it would be the first constructive signal, while rejection here would likely invite another test of $1,732 and below. Traders should monitor whether the 4h MACD crossover develops with meaningful histogram expansion, as that would be the clearest near-term technical trigger for a sustained move higher. Until ETH reclaims the daily EMA20 at $1,786.98 with volume, the recovery thesis remains fragile and this setup favors range-trading over directional positioning.
Disclaimer: This analysis is for informational purposes only and does not constitute financial advice. Cryptocurrency markets are highly volatile and unpredictable. All trading decisions should be made based on your own research and risk tolerance. Block Digest is not responsible for any financial losses incurred as a result of acting on this content.
Stay Ahead of the Market
Follow BlockDigest for crypto market intelligence, research and real-time updates.


