Ethereum Daily Analysis: ETH at $1,652 Below All Major EMAs
Market Overview
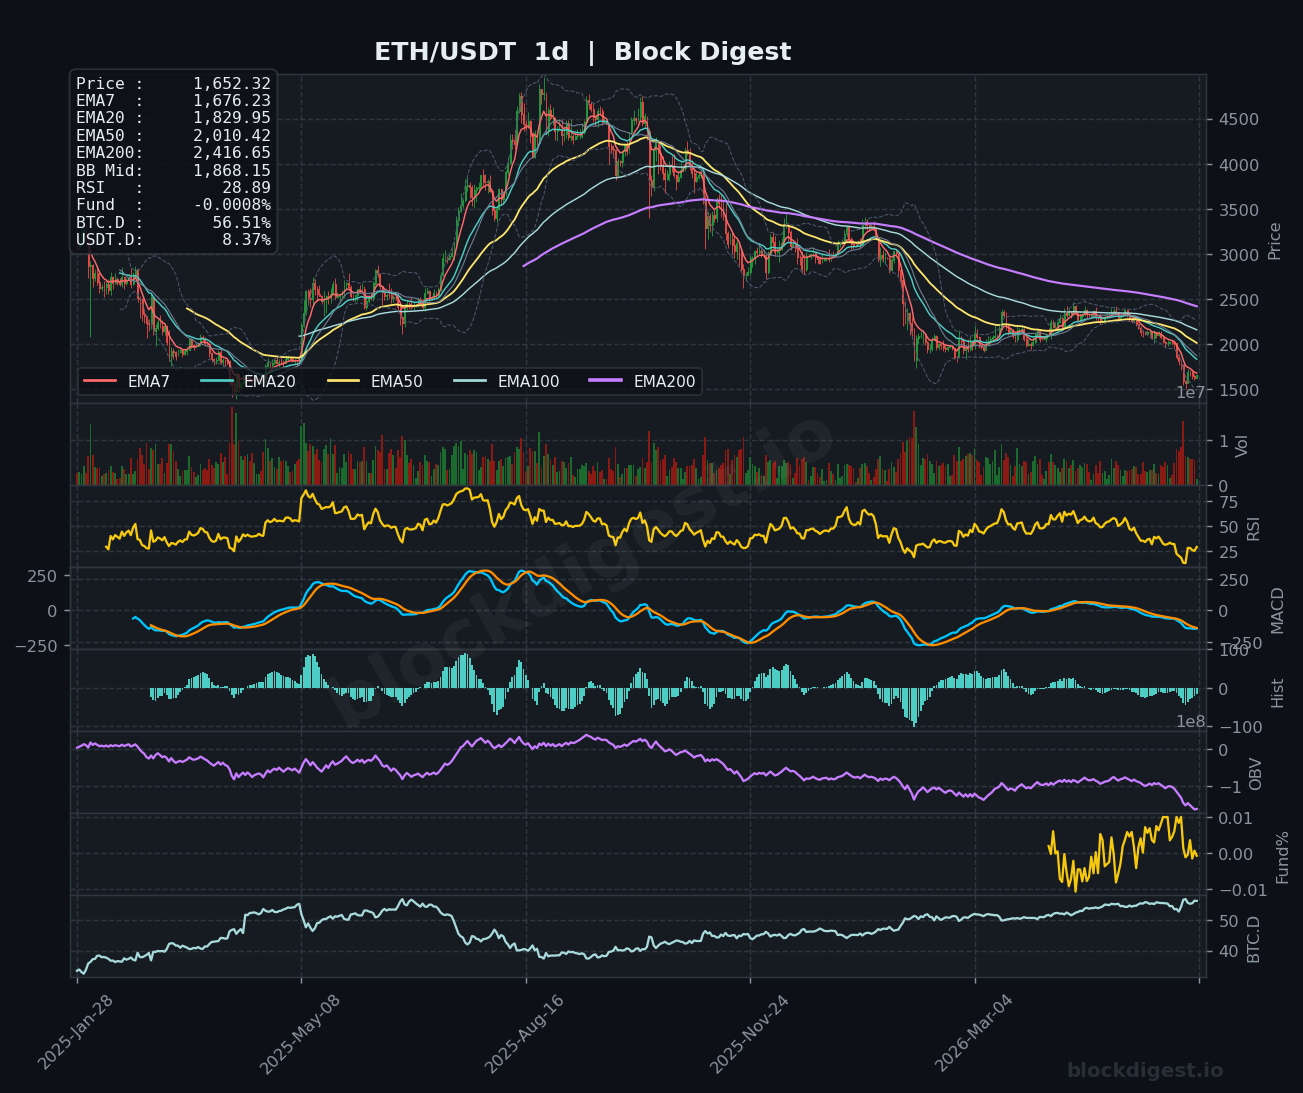
ETH/USDT is currently trading at $1,652.32, sitting in a structurally weak position across all timeframes following a prolonged downtrend from highs above $4,000. On the daily chart, price is trading well below all major EMAs — the EMA7 at $1,676.23, EMA20 at $1,829.95, EMA50 at $2,010.42, and the EMA200 at $2,416.65 — confirming a deeply bearish macro structure. The Bollinger Band midline on the daily sits at $1,868.15, far above current price, indicating sustained lower band pressure. While a short-term stabilization attempt is visible on the 1h chart, the broader trend remains unambiguously bearish.
Multi-Timeframe Confluence
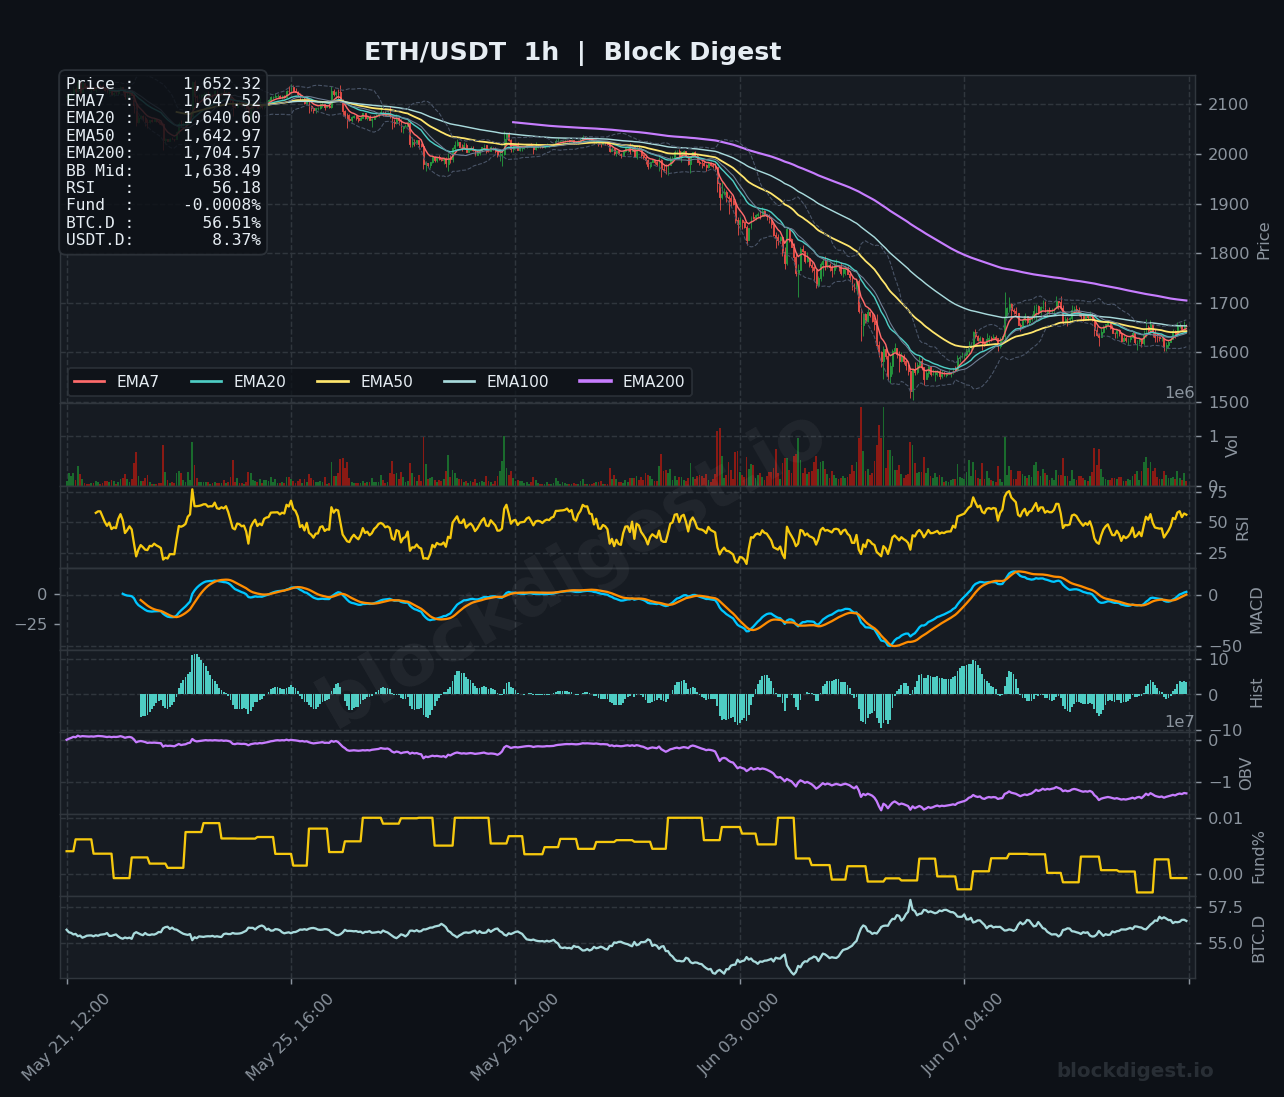
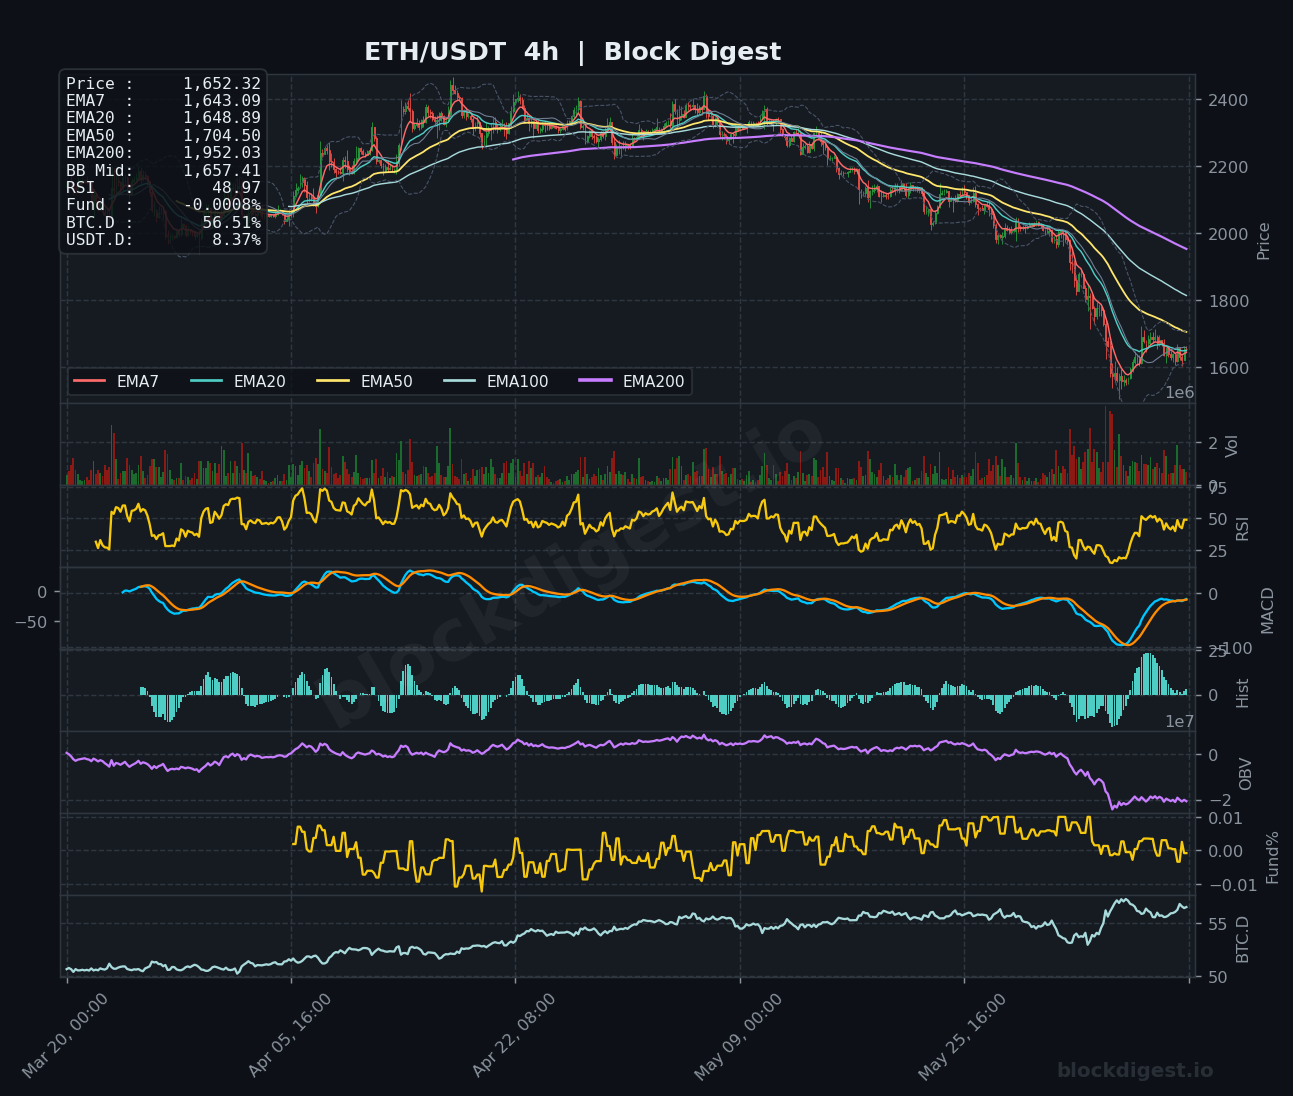
On the 1h timeframe, price has managed a modest recovery from recent lows, with the EMA7 ($1,647.52), EMA20 ($1,640.60), and EMA50 ($1,642.97) tightly clustered just below current price — a potential sign of short-term base-building, though still beneath the critical EMA200 at $1,704.57. The 4h chart presents a more sobering picture, with the EMA50 at $1,704.50 and EMA200 at $1,952.03 acting as significant overhead resistance, while the RSI at 48.97 signals neither oversold relief nor bullish conviction. On the daily, all EMAs are in a bearish sequential stack, and price is hugging the lower Bollinger Band, suggesting the market remains in distribution mode with no meaningful recovery structure yet established.
Key Levels to Watch
- Resistance: $1,704.57 — 1h EMA200 and 4h EMA50 confluence, the first meaningful ceiling for any bounce attempt
- Resistance: $1,829.95 — Daily EMA20, representing the first higher-timeframe moving average that a genuine recovery would need to reclaim
- Resistance: $2,010.42 — Daily EMA50, a macro resistance level that has capped previous rally attempts and would define a structural trend reversal
- Support: $1,620–$1,630 — Recent consolidation lows visible on the 1h chart, acting as immediate short-term demand zone
- Support: $1,550 — Psychological level and approximate lower Bollinger Band boundary on the daily, a likely target on renewed selling pressure
- Support: $1,480–$1,500 — Deeper structural support zone corresponding to prior cycle reference lows; a breakdown below $1,550 brings this area into play
Momentum & On-Chain Signals
The daily RSI at 28.89 is deep in oversold territory and approaching historically significant lows, which can precede at minimum a technical relief bounce, though oversold conditions alone are not a reversal signal in trending markets. The 4h MACD shows the signal and MACD lines beginning to converge from deeply negative territory, with histogram bars ticking toward neutral — a tentative early sign of bearish momentum exhaustion. The 1h RSI at 56.18 reflects the short-term recovery attempt, although OBV across both the 1h and 4h remains in a clear downtrend, indicating that volume is still favoring distribution rather than accumulation. Funding rates at -0.0008% are mildly negative, suggesting a slight short bias in perpetual markets but not at extreme levels that would force a short squeeze.
BTC Dominance & Market Sentiment
BTC dominance stands at 56.51%, a notably elevated reading that reflects continued capital rotation away from altcoins and into Bitcoin, an environment that has historically suppressed ETH’s relative performance. USDT dominance at 8.37% indicates meaningful defensive positioning remains in the market, with participants holding stablecoins rather than deploying into risk assets. Together, these readings suggest that broader market risk appetite remains cautious, and ETH specifically faces headwinds from both macro sentiment and structural BTC outperformance.
Risk Scenarios
- Bullish case: A daily close above the 1h/4h EMA200 confluence at $1,704–$1,705, accompanied by increasing OBV and a 4h MACD bullish crossover, would open the door toward the $1,829 daily EMA20 as the next meaningful target. Sustained reclamation of that level would begin to challenge the broader bearish thesis.
- Bearish case: Failure to hold the $1,620–$1,630 support zone on any retest, particularly on elevated sell volume, would signal that the current stabilization is simply a dead-cat bounce, with downside exposure extending toward $1,550 and potentially $1,480–$1,500.
Outlook
The near-term setup for ETH remains cautiously bearish with a tactical watch for an oversold relief bounce, given the daily RSI near 28.89 and the short-term EMA cluster providing a minor floor around $1,640. However, structural conditions — all daily EMAs in bearish alignment, declining OBV, and elevated BTC dominance — argue strongly against positioning for any sustained reversal without confirming evidence. The key trigger to watch over the next 24–48 hours is whether price can decisively breach and hold above $1,704, which would shift short-term bias to neutral-to-bullish. A failure at that level or a break below $1,620 would confirm the path of least resistance remains lower.
Disclaimer: This analysis is for informational purposes only and does not constitute financial advice. Cryptocurrency markets are highly volatile and unpredictable. All trading decisions should be made based on your own research and risk tolerance. Block Digest is not responsible for any financial losses incurred as a result of acting on this content.