BD Pulse Explained: How to Read Block Digest’s Market Sentiment Score
BD Pulse explained — and why I built it in the first place.
Most sentiment tools I tried were either too vague (“fear and greed”), too lagging, or too narrow — focused only on price or only on derivatives. I wanted something that combined multiple signals into a single, actionable number updated every day. So I built it. This guide explains what BD Pulse measures, how to read it, and how I use it in practice.
What is BD Pulse?
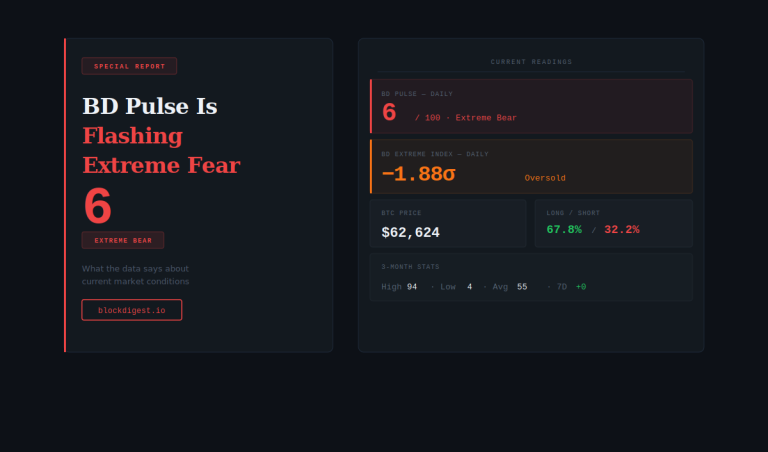
BD Pulse is a composite market sentiment score that ranges from 0 to 100. It combines six technical and market structure indicators — each weighted — into a single number that gives you a real-time read on whether the market is overheated or oversold.
It’s a contrarian indicator. A high score doesn’t mean “things are great” — it means the market is technically overbought, which historically precedes corrections. A low score doesn’t mean “things are terrible” — it means the market is deeply oversold, which historically precedes recoveries.
Think of it like a temperature gauge for market conditions, not a prediction engine.
The Six Components
BD Pulse draws on six market indicators, each selected for its ability to measure a distinct dimension of market conditions:
| Indicator | What It Measures |
|---|---|
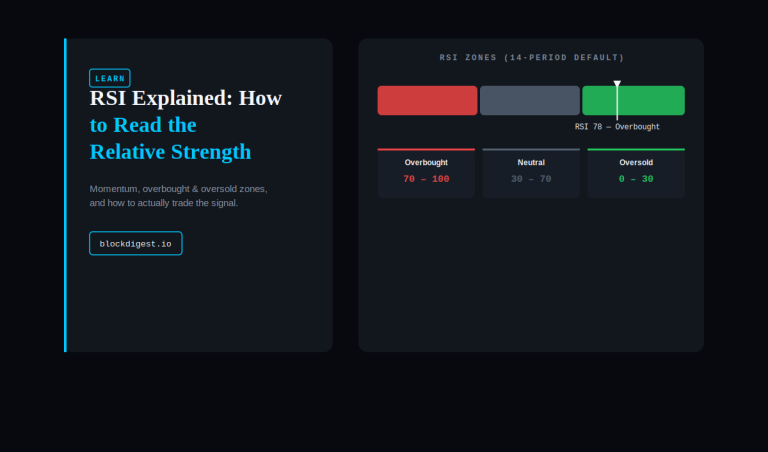
| RSI (14) | Momentum overbought/oversold conditions |
| Funding Rate | Derivatives market sentiment (long/short bias) |
| BTC Dominance | Capital flow between Bitcoin and altcoins |
| Volume Ratio | Current volume vs. 20-day average |
| Bollinger Band Position | Price position relative to volatility bands |
| OBV Trend | Accumulation vs. distribution pressure |
These six inputs are processed through Block Digest’s proprietary scoring system — normalized, weighted, and combined into a single 0–100 output. The exact methodology is not publicly disclosed, but the score is designed to be stable, repeatable, and grounded entirely in market data rather than social sentiment or news flow.
How to Read the Score
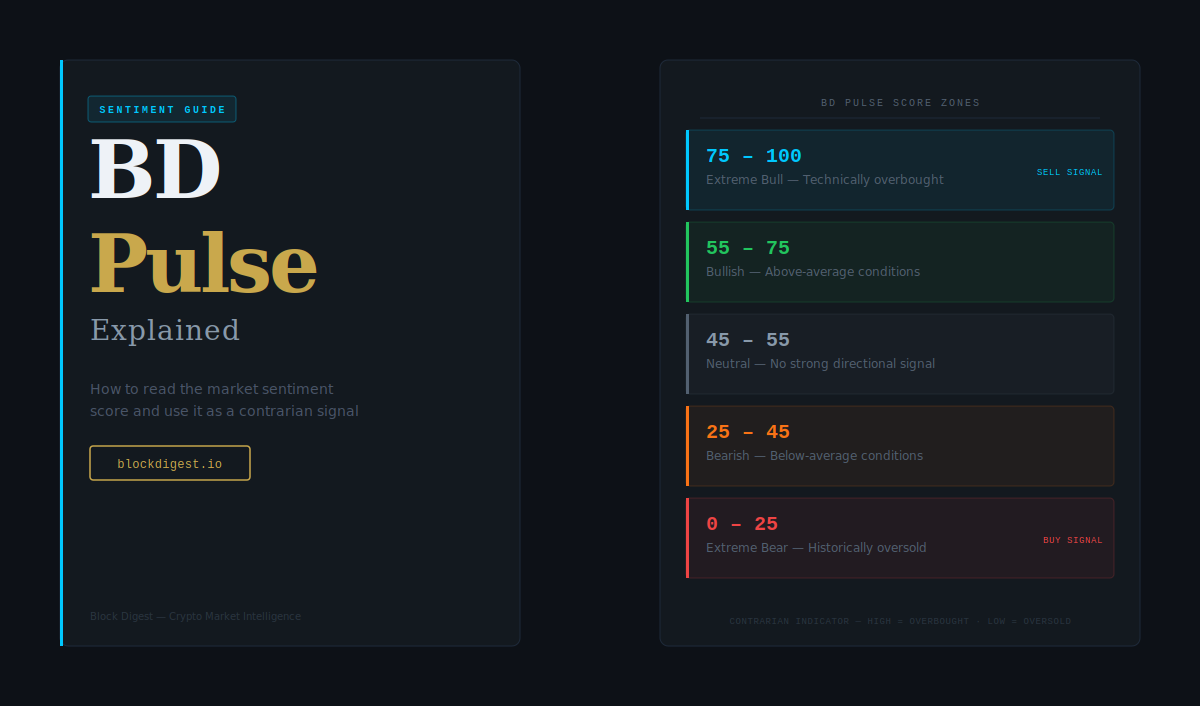
BD Pulse uses five zones:
| Score | Zone | What It Means |
|---|---|---|
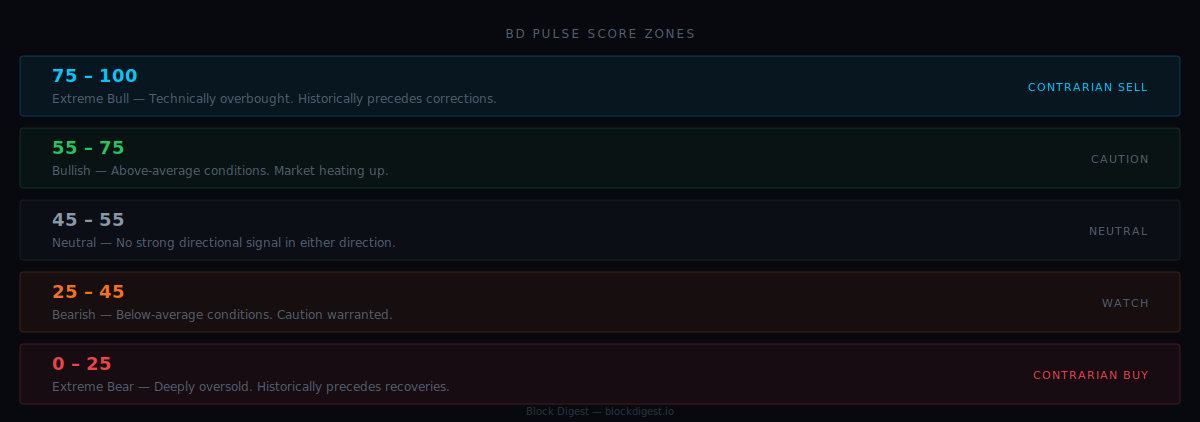
| 0 – 25 | Extreme Bear | Deeply oversold — historically a buy zone |
| 25 – 45 | Bearish | Below-average conditions, caution warranted |
| 45 – 55 | Neutral | No strong directional signal |
| 55 – 75 | Bullish | Above-average conditions, market heating up |
| 75 – 100 | Extreme Bull | Technically overbought — historically a sell zone |
Important: because BD Pulse is a contrarian indicator, the labels “Bullish” and “Bearish” describe market conditions, not recommendations. An Extreme Bull reading is a warning signal, not a green light.
BD Pulse vs. Fear & Greed Index
The Fear & Greed Index is the most well-known crypto sentiment tool, but it has limitations I wanted to improve on.
Fear & Greed incorporates social media sentiment, Google Trends, and market momentum — which means it can be slow to react and heavily influenced by news cycle noise. BD Pulse deliberately excludes social signals and focuses entirely on price structure, derivatives data, and volume — things that are harder to manipulate and more directly tied to actual market positioning.
BD Pulse also updates daily on a fixed schedule based on completed candles rather than continuously incorporating real-time social data. This makes it more stable and less reactive to short-term narrative swings.
Timeframes: Daily, Weekly, Monthly
BD Pulse calculates scores across three timeframes, each using its own historical window:
- Daily — Updated every day. Uses ~2.2 years of daily candle history. Best for short to medium-term positioning.
- Weekly — Updated every Monday. Uses ~5 years of weekly candle history. Better for cycle-level context.
- Monthly — Updated on the 1st of each month. Uses 6 years of monthly candle history. Best for macro cycle positioning.
I primarily use the daily score for tactical reads and the weekly score to confirm whether we’re in a structurally overheated or oversold cycle phase. The monthly score rarely changes dramatically — it’s most useful as a sanity check against the shorter-term readings.
How I Use BD Pulse
1. Check the zone before sizing a position
Before adding to any position, I check the current BD Pulse zone. If we’re in Extreme Bull territory, I’m reducing exposure or tightening stops — not adding. If we’re in Extreme Bear, I’m looking at accumulation opportunities. I don’t trade the score mechanically, but it informs my sizing and risk appetite.
2. Watch for zone transitions
A score moving from Bullish into Extreme Bull is more significant than a score that’s been sitting at 80 for a week. Zone transitions tend to precede meaningful price moves. I pay close attention when the score crosses the 25 or 75 thresholds.
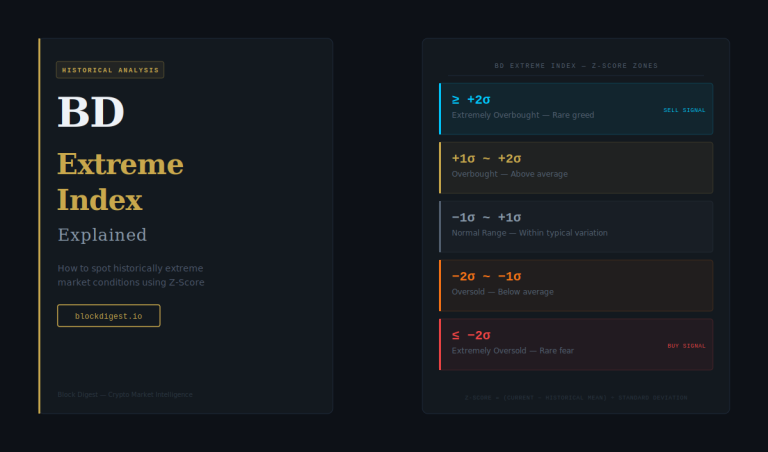
3. Combine with BD Extreme Index
BD Pulse tells you the current market condition. The BD Extreme Index tells you how unusual that condition is relative to history. A score of 72 in BD Pulse looks bullish — but if the BD Extreme Index shows it’s within the normal historical range, it’s not a warning. If it shows +2σ or above, that’s historically rare and worth taking seriously.
4. Use alongside on-chain indicators
BD Pulse is a technical/market structure indicator. For a complete picture, I combine it with:
- MVRV Ratio — Where are we in the macro cycle?
- Funding Rate — What is the derivatives market signaling?
- BTC Dominance — Where is capital flowing?
When BD Pulse is in Extreme Bear territory and MVRV is in the accumulation zone, that’s a much stronger combined signal than either one alone.
Where to Find BD Pulse
BD Pulse explained in full is available exclusively on Block Digest at blockdigest.io/bd-pulse/ — including the live score, all three timeframes, and the full historical chart.
The underlying data is sourced from Binance — OHLCV data, funding rates, and long/short ratios — all via public API with no personal data transmitted.
The page shows the current score across all three timeframes, the individual component breakdown, the full historical chart with BTC price overlay, and the BD Extreme Index. You can also embed the BD Pulse widget on your own site — the embed code is available on the BD Pulse page.
Key Takeaways
BD Pulse explained above covers everything from the underlying components to practical usage. Here’s a quick summary:
- BD Pulse is a composite sentiment score (0–100) built from six technical and market structure indicators
- It’s a contrarian indicator — high scores signal overbought conditions, low scores signal oversold conditions
- Five zones: Extreme Bear (0–25), Bearish (25–45), Neutral (45–55), Bullish (55–75), Extreme Bull (75–100)
- Available in Daily, Weekly, and Monthly timeframes
- Best used alongside BD Extreme Index and on-chain indicators for a complete picture
Related Guides
- BD Extreme Index Explained — How historically unusual is the current reading?
- MVRV Ratio — Where are we in the macro cycle?
- SOPR Explained — What are current holders doing right now?
- Funding Rate Guide — What is the derivatives market signaling?
- BD Pulse (Live) — See the current score
Disclaimer: This content is for informational purposes only and does not constitute financial advice. Cryptocurrency markets are highly volatile and unpredictable. All trading decisions should be made based on your own research and risk tolerance. Block Digest is not responsible for any financial losses incurred as a result of acting on this content.