Ethereum Daily Analysis: Ethereum Drops 12% Below EMA7 at $1,778
Market Overview
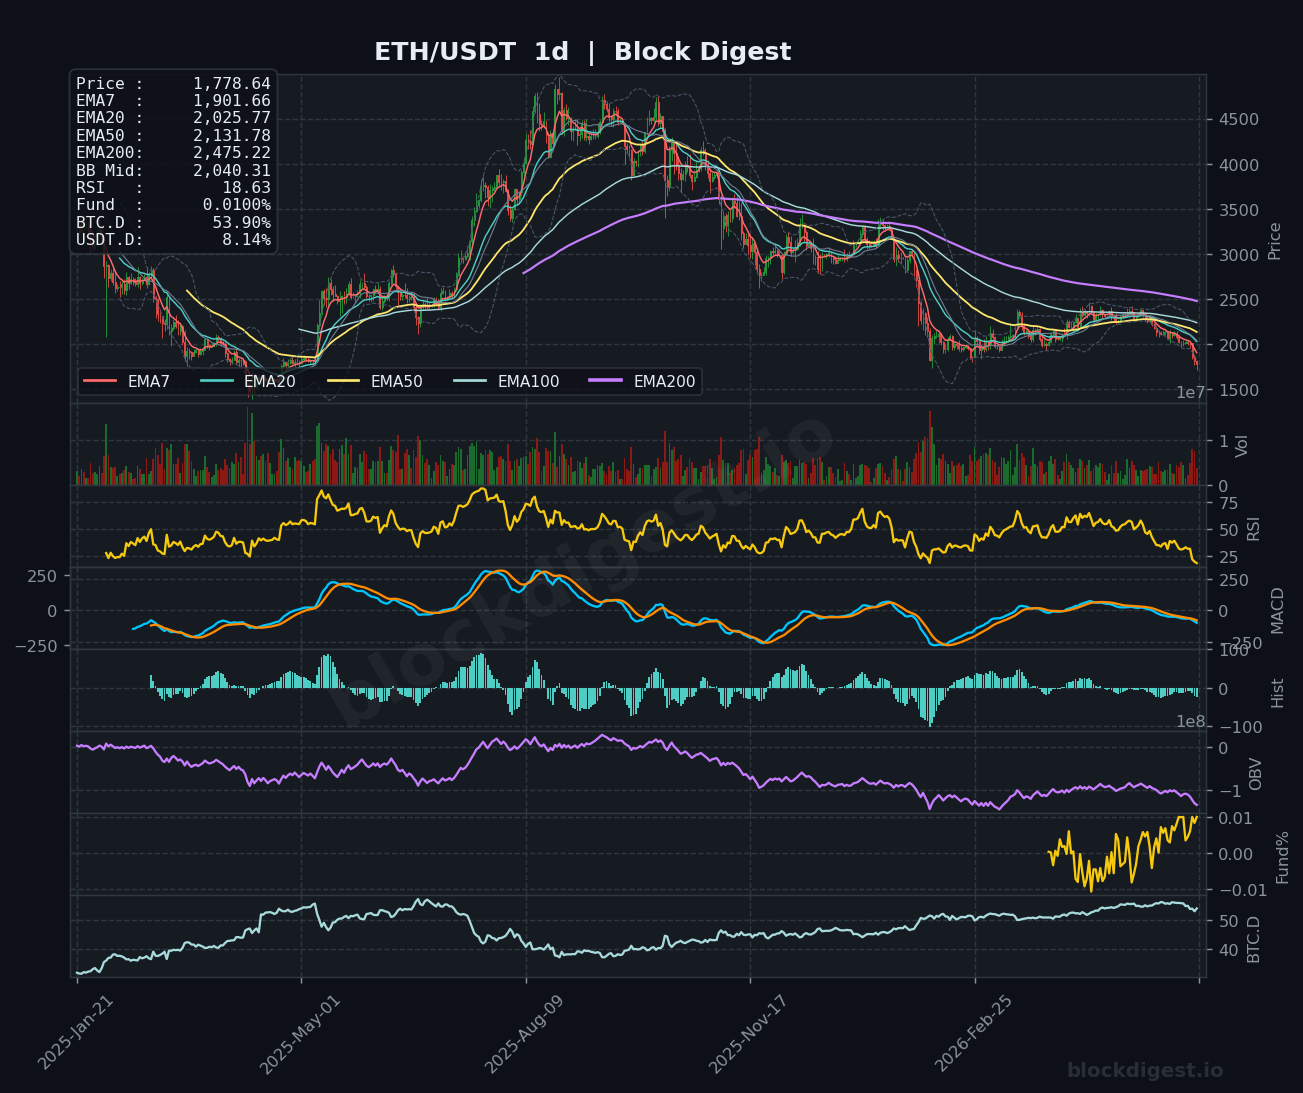
Ethereum is trading at approximately $1,778–$1,779 as of June 4, 2026, extending a sharp multi-week decline that has pushed price well below all key daily EMAs. The daily chart paints a distinctly bearish macro picture: ETH sits approximately 12% below the EMA7 ($1,901.66), 14% below the EMA20 ($2,025.77), and an alarming 28% below the EMA200 ($2,475.22). The Bollinger Band midline on the daily sits at $2,040.31, with price hugging the extreme lower band — a sign of sustained, aggressive selling pressure rather than a mere short-term shakeout. The dominant daily trend remains firmly bearish, with all EMAs stacked in a descending bearish order since the 2025 peak near $4,953.
Multi-Timeframe Confluence
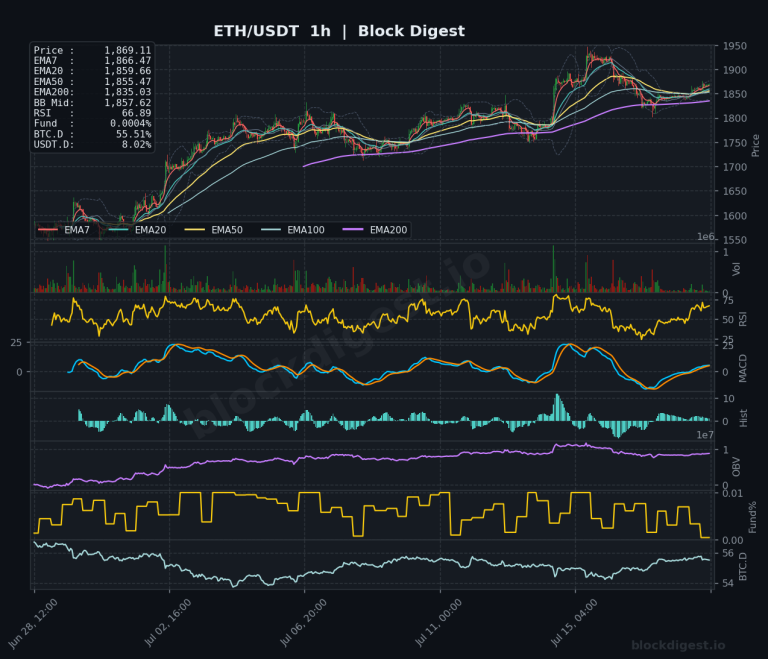
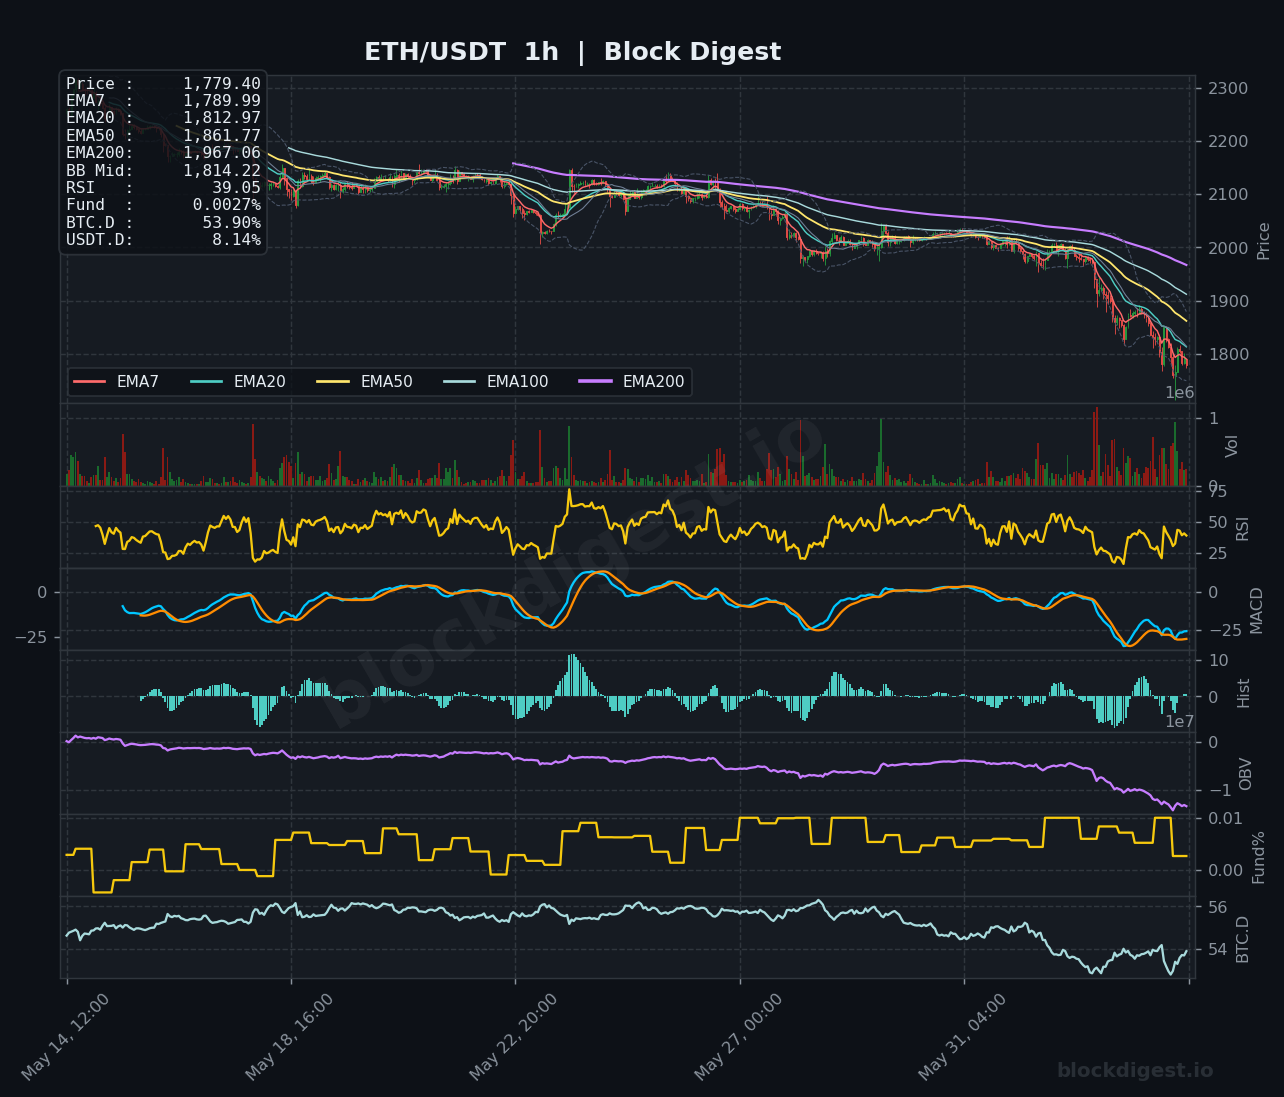
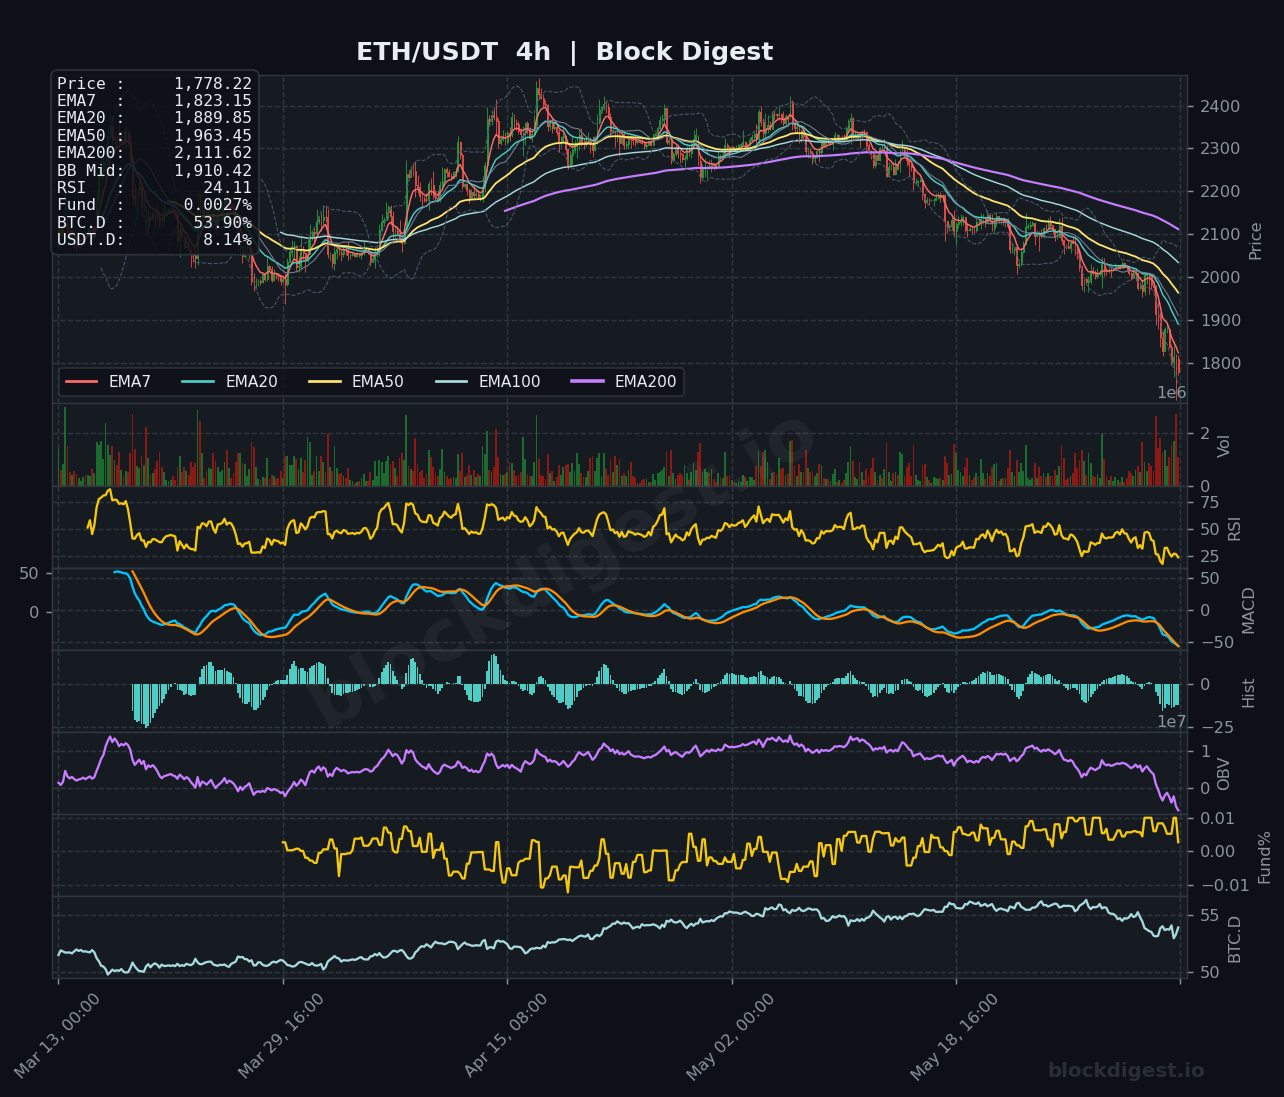
Across all three timeframes, the structure is uniformly bearish with no meaningful divergence in trend direction — a rare but significant alignment that adds conviction to the downside thesis. On the 1-hour chart, price trades below all EMAs (EMA7: $1,789.99, EMA20: $1,812.97, EMA50: $1,861.77, EMA200: $1,967.06), with every short-term average in a tight bearish stack. The 4-hour chart reinforces this, showing EMA7 at $1,823.15 and EMA200 at $2,111.62, with price breaking decisively below all dynamic support levels in recent sessions. There is no timeframe offering a credible bullish counterargument, and the absence of any EMA recapture attempts suggests sellers remain firmly in control with buyers unwilling to step in at current levels.
Key Levels to Watch
- Resistance: $1,812–$1,814 — the 1-hour BB midline and EMA20 confluence, the most immediate overhead barrier price must reclaim to stabilize
- Resistance: $1,889–$1,910 — the 4-hour EMA20 ($1,889.85) and BB midline ($1,910.42) zone, which would need to be cleared to suggest any meaningful recovery
- Resistance: $2,025–$2,040 — the daily EMA20 ($2,025.77) and daily BB midline ($2,040.31), a critical structural ceiling that would define a potential trend reversal
- Support: $1,738 — the reported current spot price from market data and a psychological proximity level aligning with recent lows visible on the 4-hour chart
- Support: $1,650–$1,680 — the next significant demand zone based on prior consolidation structure visible on the daily chart from early 2025
- Support: $1,500 — a major round-number psychological level and multi-year structural support that would come into focus on an accelerated breakdown
Momentum & On-Chain Signals
The RSI readings across timeframes are alarming in their unanimity: the daily RSI sits at 18.63 — deeply in oversold territory and the lowest reading visible over the entire chart history shown — while the 4-hour RSI is at 24.11 and the 1-hour RSI at 39.05, the latter showing a modest attempt at recovery. The daily MACD remains in a steep bearish configuration with both the signal and MACD lines far below zero and the histogram printing consistent negative bars, offering no sign of momentum reversal. On-Balance Volume (OBV) on both the 4-hour and daily charts has been trending sharply lower, confirming that the price decline is accompanied by genuine distribution — not a liquidity vacuum. The funding rate at 0.0027% is near neutral, suggesting the futures market has not yet reached extreme negative positioning that might trigger a short squeeze.
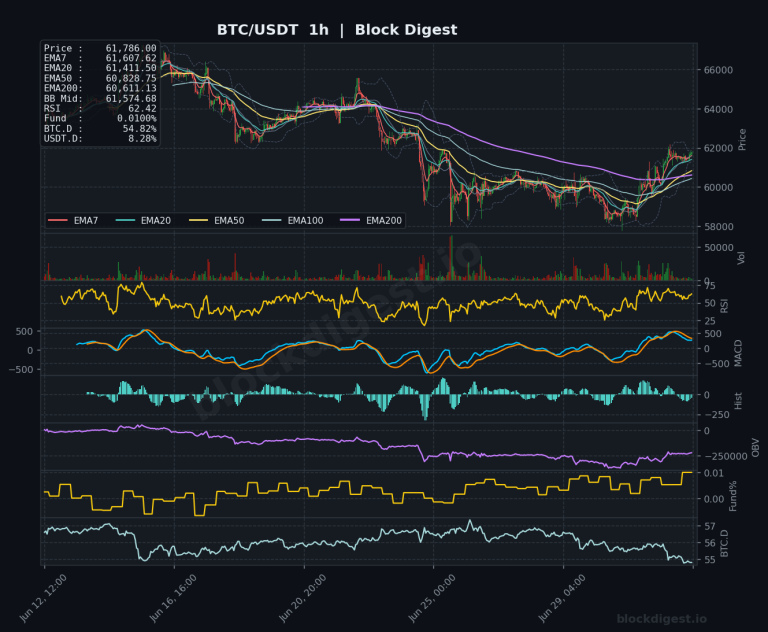
BTC Dominance & Market Sentiment
BTC dominance (BTC.D) stands at 53.90%, maintaining a relatively elevated level that signals continued capital preference for Bitcoin over altcoins including ETH. USDT.D at 8.14% reflects a notable flight to stablecoins — consistent with the broader risk-off environment described in recent market commentary, where capital appears to be rotating toward AI investments, IPO opportunities, and cash rather than risk assets. For ETH specifically, an elevated BTC.D and rising USDT.D is a double headwind: it suggests both that relative flows are leaving ETH and that overall crypto market risk appetite is compressed.
Risk Scenarios
- Bullish case: A decisive hourly close above $1,814 (BB midline) followed by recapture of the $1,861 EMA50 on the 1-hour chart would suggest short-term exhaustion of sellers; a subsequent push toward $1,910–$1,963 becomes achievable if volume confirms the move, potentially driven by catalysts such as the CFTC’s Coinbase perpetual futures approval stimulating renewed institutional demand.
- Bearish case: Failure to hold the $1,738 spot level on a closing basis — particularly on high volume — would open the door to a test of $1,650–$1,680, and a breach there with continued OBV deterioration and persistent BTC.D strength would put the $1,500 psychological level squarely in focus.
Outlook
The technical setup for ETH as of June 4, 2026 is unambiguously bearish across all timeframes, with an extremely oversold daily RSI (18.63) offering the only potential near-term counterargument — though oversold conditions can persist during sustained downtrends and alone do not constitute a buy signal. The most critical trigger to monitor in the next 24–48 hours is whether price can defend the $1,738–$1,750 zone and whether any reclaim of the 1-hour $1,812–$1,814 level emerges on meaningful volume. A change in thesis requires, at minimum, a 4-hour candle close above $1,889 with improving OBV; until then, the path of least resistance remains lower. The broader macro rotation away from crypto toward AI and IPO narratives adds a fundamental headwind that compounds the technical weakness, keeping the near-term outlook cautious.
Disclaimer: This analysis is for informational purposes only and does not constitute financial advice. Cryptocurrency markets are highly volatile and unpredictable. All trading decisions should be made based on your own research and risk tolerance. Block Digest is not responsible for any financial losses incurred as a result of acting on this content.