Ethereum Monthly Analysis: Ethereum Breaks Below $2,000 Monthly Close
Macro Market Overview
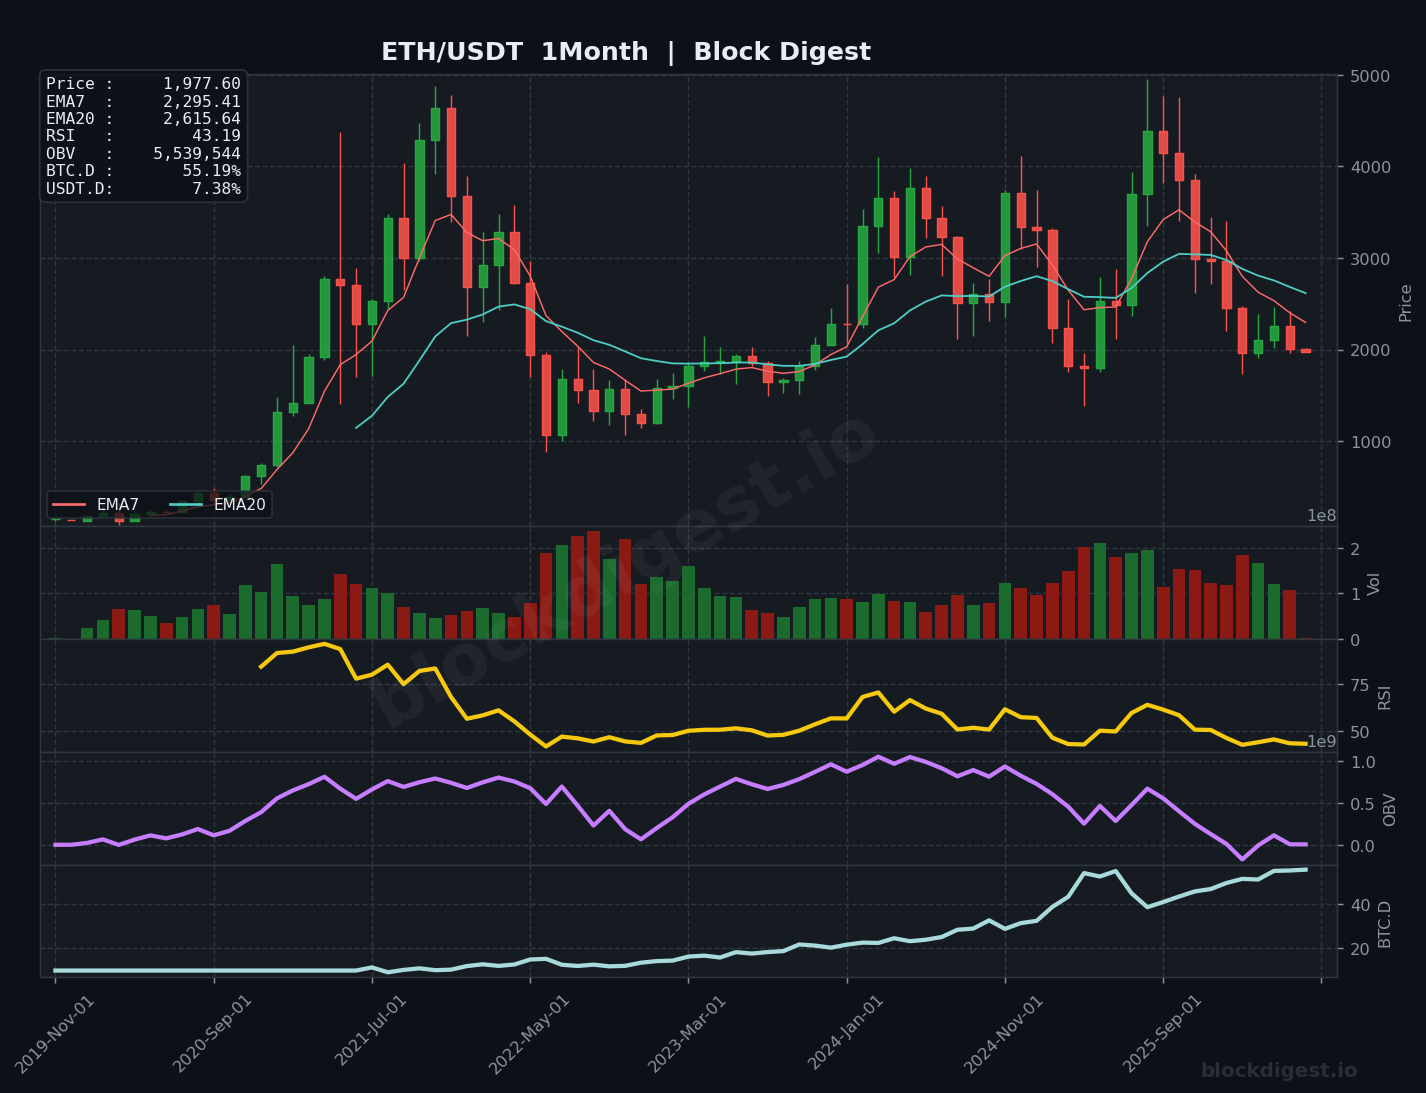
Ethereum enters June 2026 trading near $1,977, printing what amounts to a sobering sub-$2,000 close on the monthly candle — a psychologically significant breakdown that underscores the severity of the ongoing correction from the cycle highs near $4,000 reached in late 2024. The monthly candle structure over the past several months has been consistently bearish, with a sequence of lower highs and lower lows that mirrors the post-peak distribution phase seen following the 2021 cycle top. On the monthly chart, ETH’s EMA7 ($2,295) has crossed decisively below the EMA20 ($2,615), confirming a macro bearish crossover that historically has preceded extended periods of sideways consolidation or further downside. Within the broader market cycle, Ethereum now sits at a critical inflection point — it has surrendered the majority of its bull market gains and is testing multi-year structural support zones that defined the previous cycle’s resistance. The context is further complicated by Bitcoin’s continued dominance and ETH’s notable underperformance relative to BTC throughout this cycle.
Long-Term Trend Structure
The monthly EMA structure tells a clear and cautionary story: EMA7 at $2,295 is not only below EMA20 at $2,615, but the gap between the two continues to widen, signaling that selling pressure remains persistent at the macro level rather than exhibiting any near-term exhaustion. The monthly Bollinger Bands are in an active expansion phase pointing downward, with price pressing against or breaching the lower band near current levels — a condition that in previous cycles (notably mid-2022 and late 2019) preceded either capitulation lows or prolonged basing periods before any meaningful recovery. Key historical support in the $1,800–$2,000 zone has served as a major structural pivot, representing former 2021 cycle resistance that was eventually flipped to support during the 2023–2024 accumulation phase; a sustained breakdown below this zone would open the path toward the $1,400–$1,500 region. The monthly RSI at 43.19 is declining toward the oversold threshold of 30 but has not yet reached the extreme readings (sub-30) that have historically marked durable cycle lows for ETH. The overall cycle phase classification at the monthly level is unambiguously in late-stage distribution transitioning into markdown, with no confirmed structural reversal signals present yet on this timeframe.
Weekly Timeframe Context
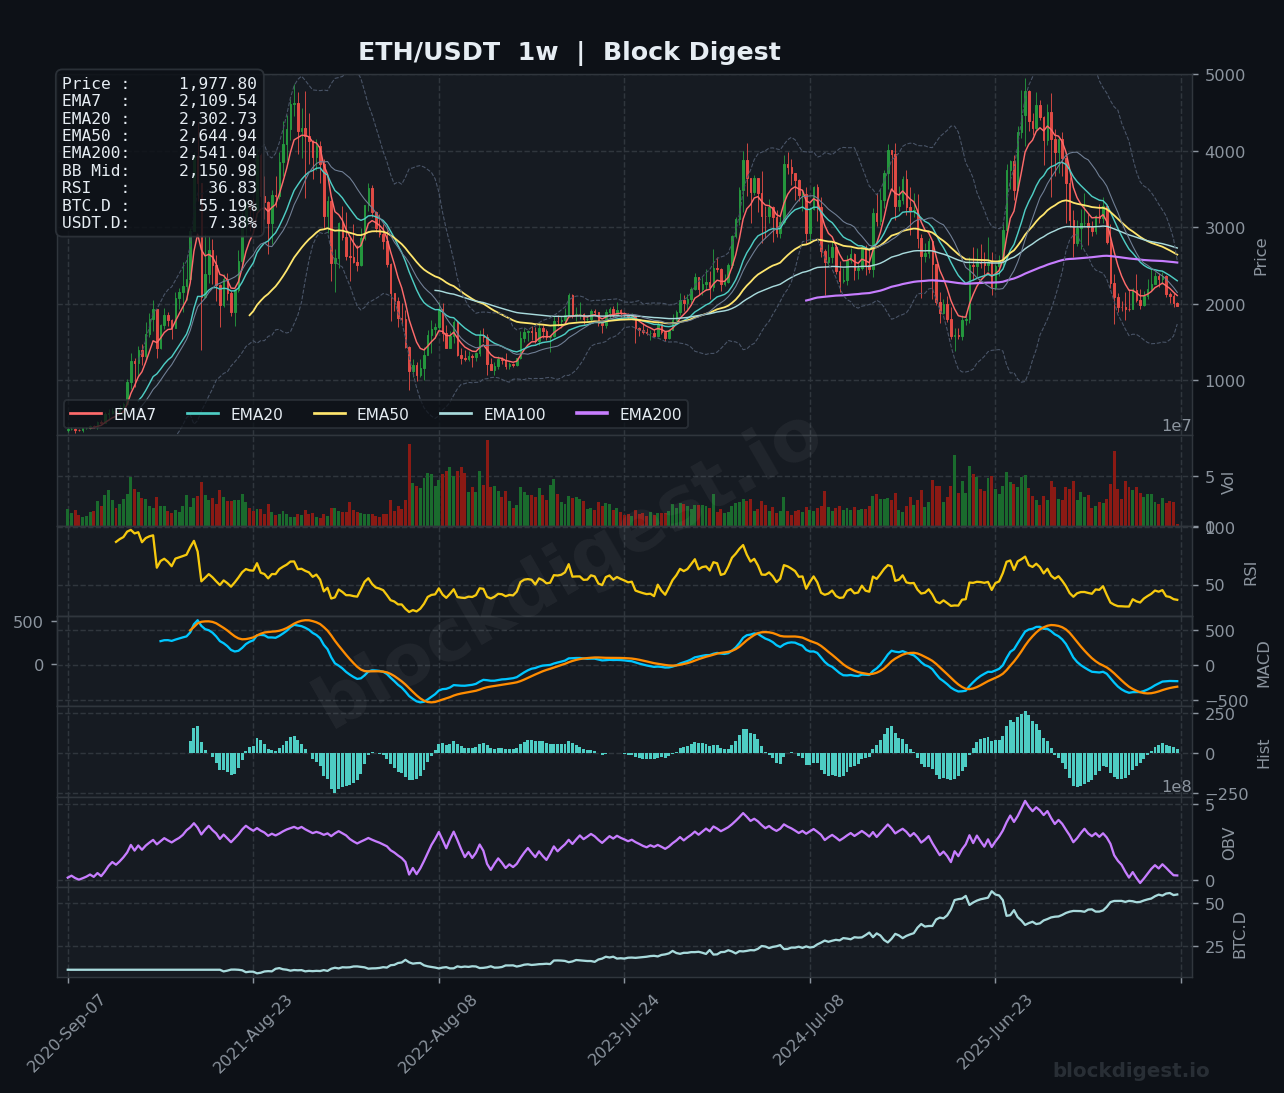
The weekly chart reinforces the bearish macro thesis with striking clarity: all major EMAs are stacked in a fully bearish configuration, with EMA7 (2,109) well below EMA20 (2,302), EMA50 (2,644), EMA100, and EMA200 (2,541), confirming that every significant moving average is acting as overhead resistance. The weekly Bollinger Band midline at $2,150 has repeatedly rejected price on recovery attempts, and price is currently consolidating in a tight range just beneath this level — a bearish sign that suggests the path of least resistance remains to the downside unless a decisive weekly close above $2,150 can be achieved. Weekly RSI at 36.83 is approaching but has not yet breached the oversold zone, and the MACD on the weekly shows both lines deeply negative with a marginally positive histogram — suggesting a possible short-term relief attempt is forming, but one that exists within a broader bearish trend rather than signaling a macro reversal. The weekly OBV has declined sharply from its cycle peak, confirming that net selling volume has dominated this entire corrective phase.
Key Macro Levels
- Major Resistance: $2,150 (weekly Bollinger Band midline and EMA7/EMA20 cluster — immediate overhead supply); $2,300–$2,400 (monthly EMA7 and former consolidation base from early 2024); $2,600–$2,650 (monthly EMA20 and EMA50 confluence — major distribution zone and previous cycle structural pivot); $3,000–$3,100 (psychological round number, previous cycle resistance turned support, and ETH analyst price target cited in current institutional research)
- Major Support: $1,900–$2,000 (current price zone, critical psychological support and the lower end of the 2023–2024 re-accumulation range); $1,750–$1,800 (2022 bear market recovery high and structural swing low — loss of this level would be a significant macro negative); $1,400–$1,500 (2022 capitulation low cluster and major long-term horizontal support from prior cycle structure); $1,000–$1,100 (ultimate macro support, representing the 2020–2021 breakout origin zone and last line of long-term structural defense)
Momentum & Accumulation Analysis
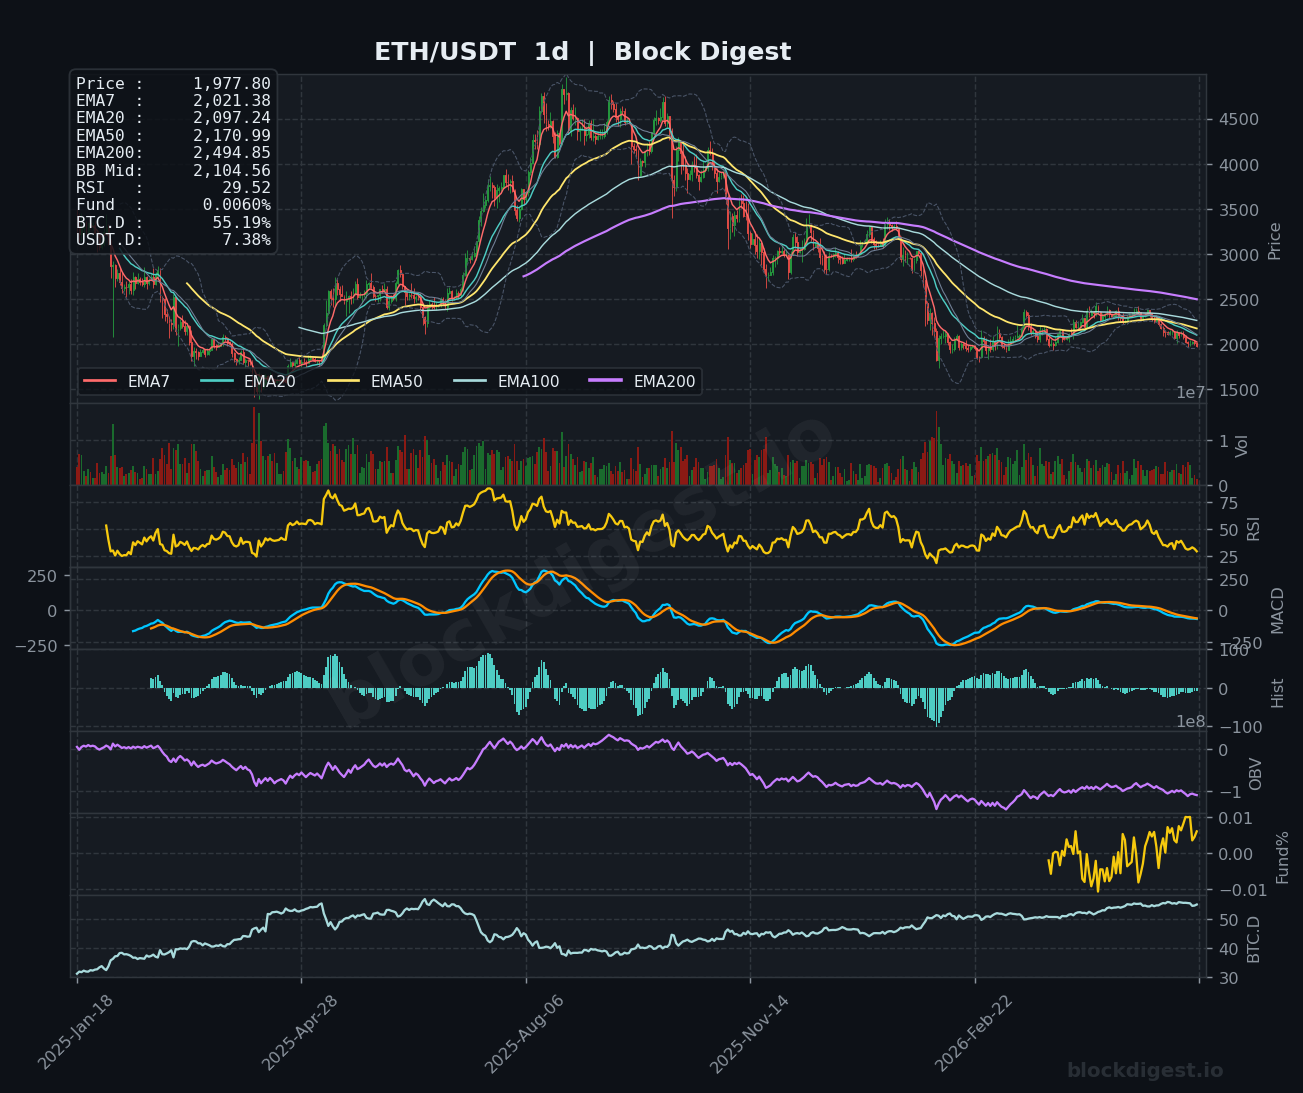
Monthly RSI at 43.19 is in neutral-to-bearish territory, trending lower, and has not yet reached the sub-30 oversold readings that have historically coincided with major ETH cycle bottoms — in both the 2018–2019 bear market and the 2022 capitulation, monthly RSI dropped to or below 25 before durable lows were established, suggesting the current reading does not yet confirm a macro bottom. The monthly OBV continues its downtrend from the cycle peak, with no visible bullish divergence at the current lows, which indicates that institutional and large-player net accumulation has not yet decisively returned at these levels — a contrast to the behavior seen in late 2022 and early 2023 when OBV began flattening ahead of the recovery. On the daily chart, RSI at 29.52 is at oversold extremes, which typically generates short-term bounces, and the daily MACD histogram shows tentative signs of compression that could precede a relief rally toward the $2,100–$2,300 zone. The weekly MACD, while still deeply negative, is showing slight histogram improvement — a pattern consistent with a potential dead-cat bounce or consolidation phase rather than a genuine trend reversal. Overall, momentum and accumulation data suggest ETH remains in a distribution-to-markdown cycle phase with no confirmed macro inflection, though short-term oversold conditions on lower timeframes may provide temporary relief.
BTC Dominance – Cycle Context
BTC dominance is currently at 55.19%, a level that reflects Bitcoin’s sustained outperformance during this cycle — a theme that has been consistent since the 2024 halving and has been reinforced by the wave of Bitcoin ETF inflows and institutional adoption narratives that have largely bypassed altcoins. Historically, BTC dominance peaking and rolling over has been the primary signal for the onset of altcoin season, and while the 55% zone has acted as a resistance ceiling in previous cycles, there is currently no confirmed technical breakdown or momentum reversal in dominance that would signal a rotation into ETH and altcoins is imminent. USDT dominance at 7.38% remains elevated, indicating that a meaningful portion of crypto market participants continue to hold stablecoins on the sidelines — this represents latent liquidity that could accelerate moves in either direction but currently reflects risk-off positioning rather than active deployment into altcoins. Until BTC.D shows a decisive weekly close below the 52–53% range, the macro environment continues to favor Bitcoin over Ethereum in risk-adjusted allocation terms.
Risk Scenarios
- Bull case: A combination of the Amsterdam hard fork catalyst, continued whale accumulation (as evidenced by high-profile purchases like those associated with Erik Voorhees), and a broader altcoin rotation triggered by BTC.D topping out could drive ETH back above the $2,300–$2,400 resistance zone; a sustained reclaim of the monthly EMA7 ($2,295) would be the first structural signal of macro trend recovery, with a subsequent target toward the $3,000–$3,100 analyst consensus level and ultimately a potential retest of the $3,500–$4,000 prior cycle highs if macro conditions remain favorable through 2026.
- Bear case: Failure to hold the $1,800–$2,000 structural support zone on a monthly closing basis would constitute a significant macro breakdown, opening downside toward the $1,400–$1,500 capitulation range; this scenario would be accelerated by continued BTC dominance expansion, macro risk-off conditions (rising yields, USD strength, or broader equity market stress), and any negative developments around Ethereum’s development roadmap or competitive pressures from Layer-1 alternatives. A monthly close below $1,500 would challenge the entire bull market thesis and suggest ETH is entering a deep bear phase comparable in magnitude to the 2022 drawdown.
Monthly Outlook
Entering June 2
Disclaimer: This analysis is for informational purposes only and does not constitute financial advice. Cryptocurrency markets are highly volatile and unpredictable. All trading decisions should be made based on your own research and risk tolerance. Block Digest is not responsible for any financial losses incurred as a result of acting on this content.