Weekly Market Overview
Bitcoin closed the week in the low $62,900s after printing a meaningful recovery from its late-June 21-month low near $58,000, registering approximately a 6% weekly gain. Price action has been constructive on the surface — the bounce squeezed bearish positioning and drew in macro tailwinds from a soft June jobs report (just 57K versus 113K forecast) and dovish commentary from Fed Chair Kevin Warsh. However, the weekly candle is printing below all major EMAs, and the broader trend structure remains decidedly bearish, meaning this recovery must be treated as a counter-trend move until proven otherwise. The market is consolidating in a tight band around $62,900–$63,500, and the coming week’s inflation print on July 14 and the Fed’s July 28–29 meeting will likely serve as the next major directional catalysts.
Higher Timeframe Structure
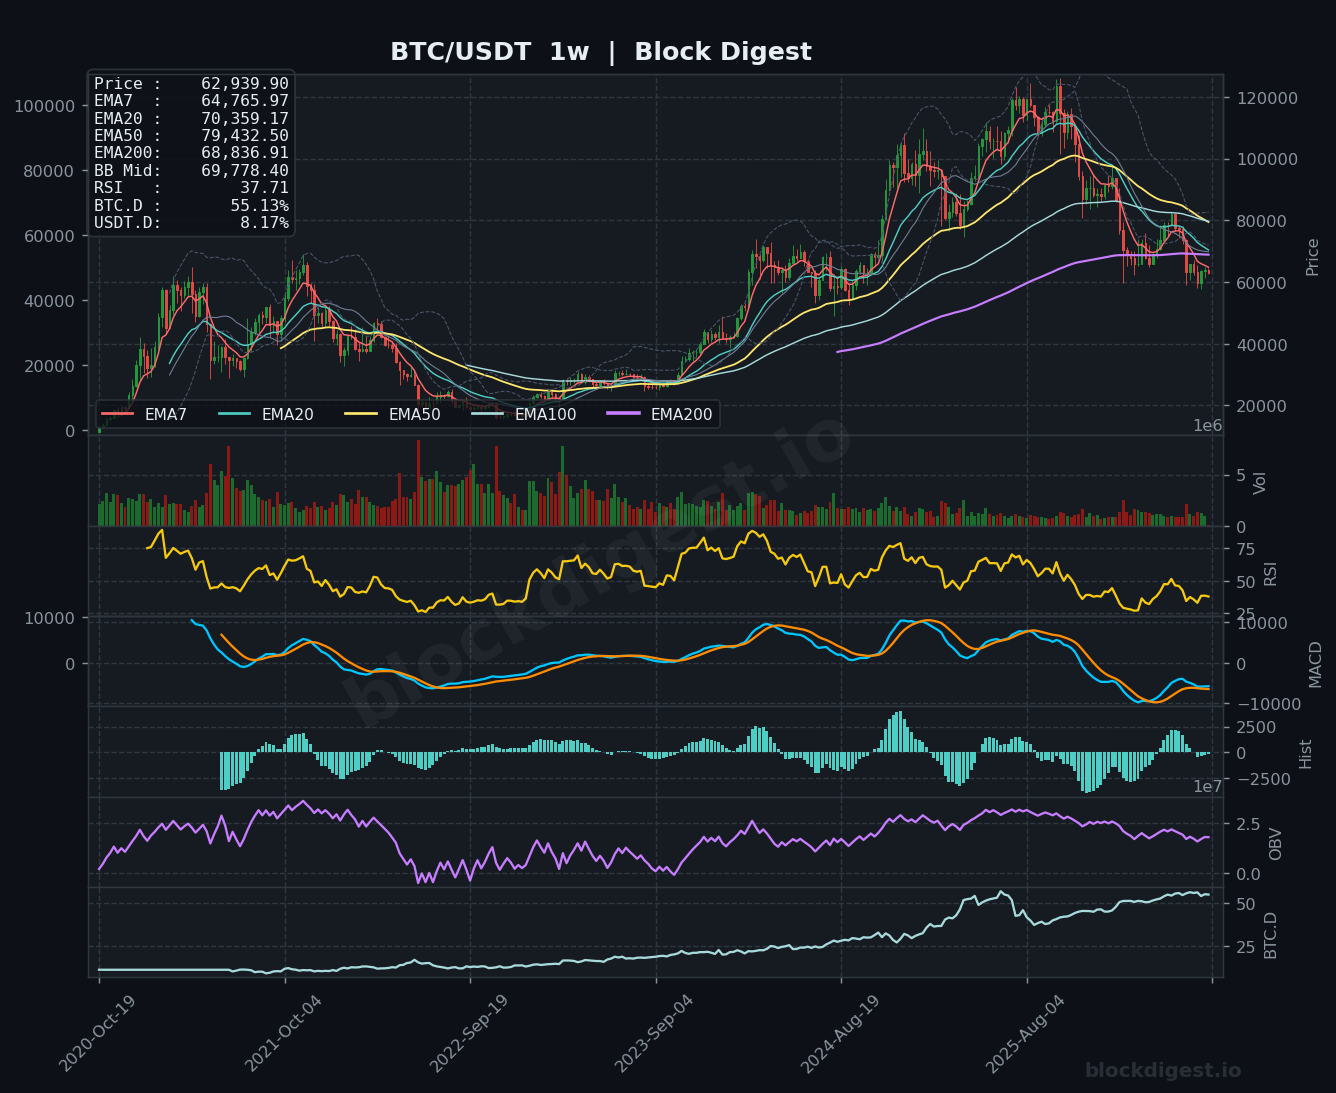
On the weekly chart, the EMA stack is in a severe bearish configuration: the EMA7 sits at $64,765, the EMA20 at $70,359, the EMA50 at $79,432, and the EMA200 at $68,836 — every single key average sits above current price, painting a picture of a market that has surrendered its entire bull-cycle EMA support structure. The weekly Bollinger Band midline at $69,778 represents the first meaningful mean-reversion target to the upside and also the threshold where bearish pressure would begin to meaningfully lighten. Price is currently pressing against the lower Bollinger Band, which historically in prior BTC cycles has indicated at minimum a near-term relief rally — but in macro downtrends can simply compress further before resolution. The weekly RSI at 37.71 is approaching oversold territory but has not yet reached the sub-30 levels that historically mark generational buying opportunities in Bitcoin bear phases, suggesting there may be more technical pain ahead if macro conditions deteriorate.
Multi-Timeframe Confluence
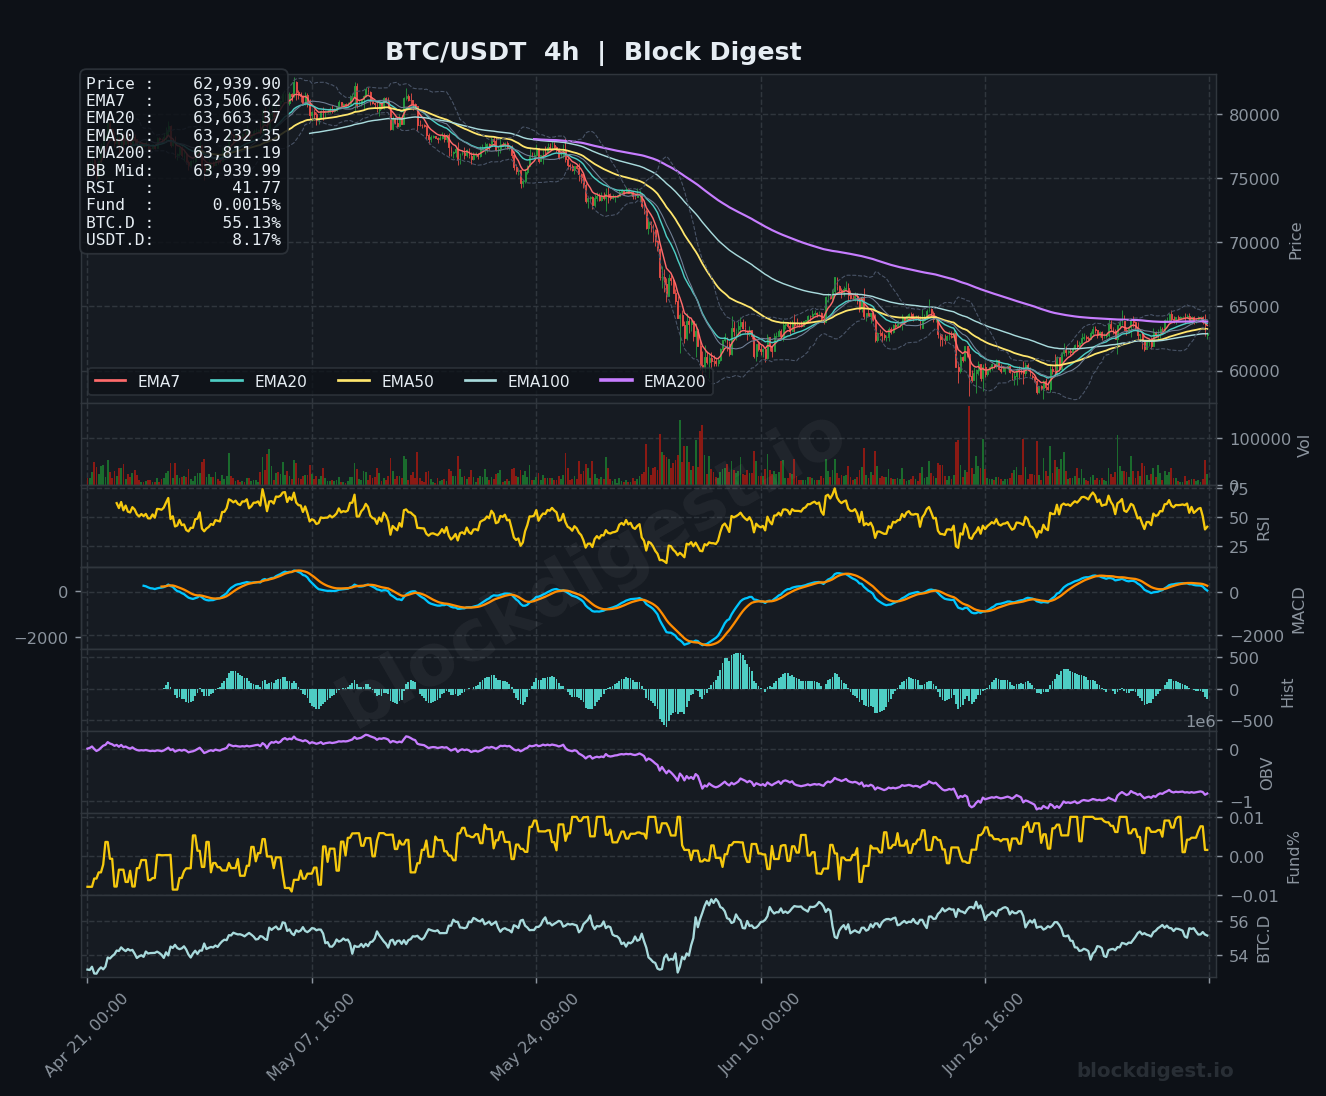
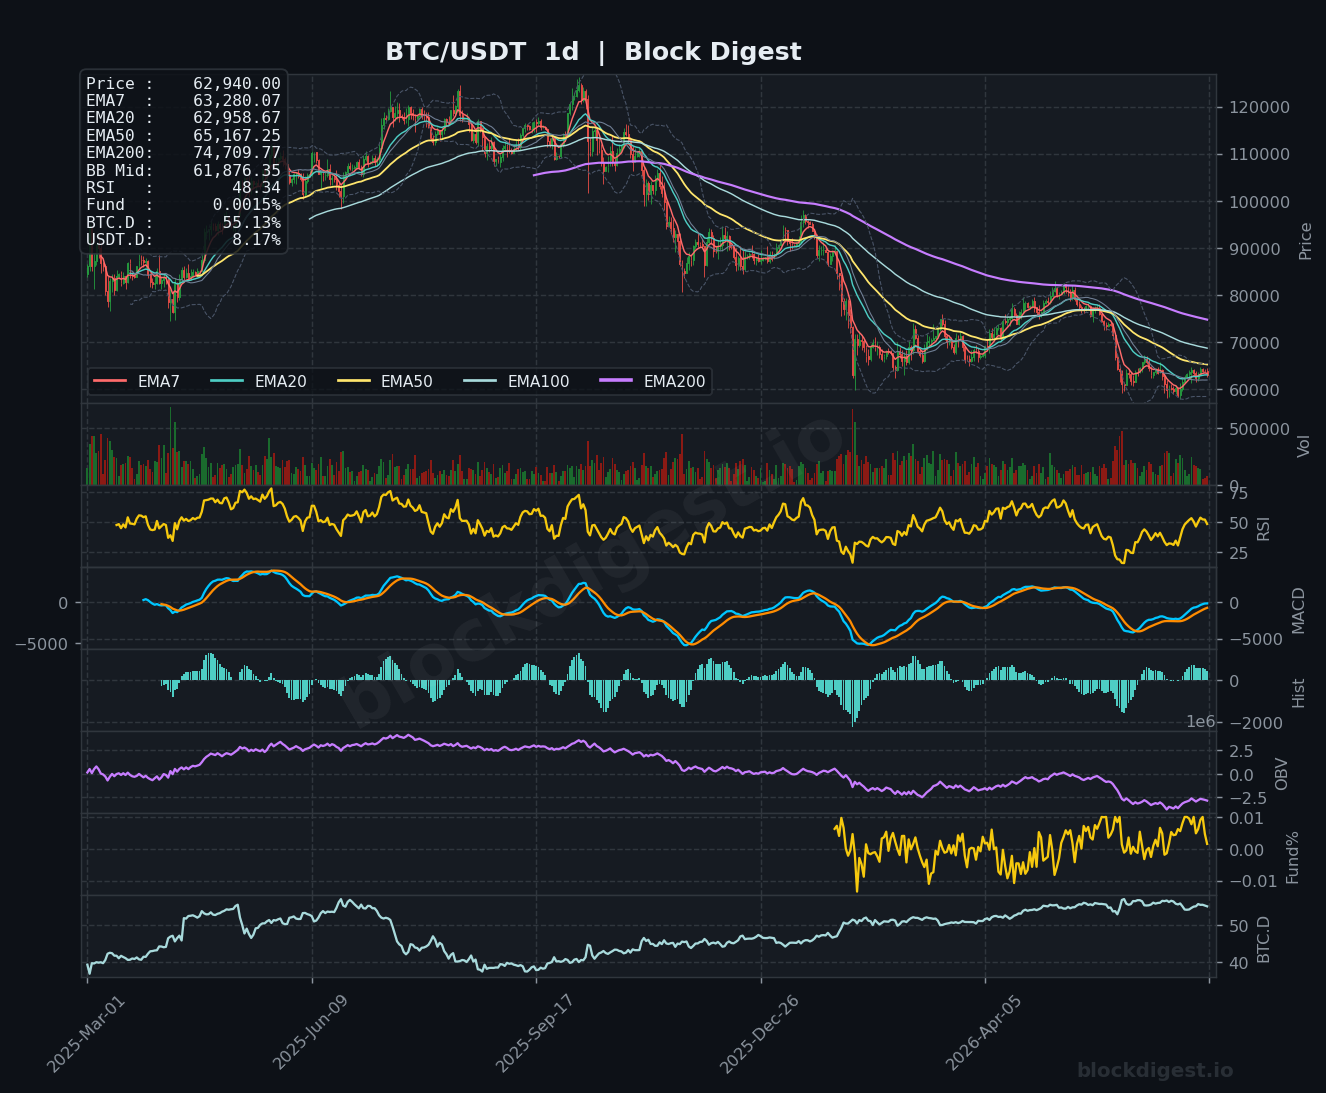
The daily chart shows price hovering between the EMA7 ($63,280) and EMA20 ($62,958), with the daily RSI recovering to 48.34 — technically neutral, offering no strong directional signal in isolation. The daily MACD remains in negative territory but the histogram bars are contracting, suggesting bearish momentum is fading rather than accelerating. On the 4H timeframe, price is trading below all key EMAs (EMA7: $63,506; EMA20: $63,663; EMA50: $63,232; EMA200: $63,811), with the 4H RSI at a weak 41.77 — all EMAs are tightly clustered just overhead, creating a dense resistance ceiling between $63,200 and $63,900 that aligns precisely with the Bollinger Band midline, making the $63,000–$64,000 zone the most critical battleground heading into the week.
Key Weekly Levels
- Weekly Resistance: $64,000–$64,200 (4H EMA cluster + BB midline convergence, immediate overhead resistance); $68,836 (weekly EMA200, macro bear/bull threshold); $70,359 (weekly EMA20, first major mean-reversion target)
- Weekly Support: $61,500–$62,000 (recent consolidation base and near-term demand zone); $59,000–$58,800 (late-June 21-month swing low, critical structural support); $55,000–$56,000 (next major weekly demand shelf from the 2024 breakout region)
Momentum & Volume Analysis
Weekly MACD is deeply negative with the signal line extended well below zero, and while the histogram is showing marginal improvement (shrinking negative bars), a true bullish crossover on this timeframe remains weeks to months away. The weekly OBV is on a sustained downtrend from the cycle peak, indicating that volume on down weeks has consistently outpaced up weeks — a structurally bearish signal that confirms the recovery is not yet supported by genuine accumulation. On the 4H chart, OBV has stabilized and ticked modestly higher during this week’s bounce, providing a small glimmer of near-term buying interest, though it falls far short of reversing the macro OBV trend. The funding rate at a near-neutral 0.0015% is notably telling — despite the sharp bounce from $58K, longs are not aggressively leveraged, which actually reduces liquidation risk to the upside and suggests this move is more driven by short covering than fresh directional conviction.
BTC Dominance & Altcoin Implications
BTC dominance stands at 55.13%, having pulled back modestly from recent highs — on the daily chart, BTC.D peaked around 56–57% and is showing the earliest signs of a rollover, which could indicate capital is tentatively rotating toward large-cap altcoins. However, USDT.D at 8.17% remains elevated, confirming that a substantial portion of the market is still parked in stablecoins as a defensive posture rather than rotating into risk assets. Until USDT.D shows a meaningful decline alongside a sustained BTC.D pullback, any altcoin rally should be treated as short-lived bounces rather than the start of a genuine altseason.
Risk Scenarios
- Bull case: A clean break and daily close above the $64,000–$64,200 EMA cluster, ideally accompanied by improving OBV and a softer-than-expected CPI print on July 14, could trigger a push toward the $68,836 weekly EMA200. A dovish Fed surprise at the July 28–29 meeting would be the highest-conviction catalyst for reclaiming the $70,000 level and shifting the weekly structure to neutral.
- Bear case: Failure to reclaim the $63,500–$64,000 resistance zone on this attempt — particularly on a hot inflation print July 14 — would likely send price back toward the $59,000–$58,800 swing low. A decisive breakdown below $58,000 on elevated volume would open a path toward $55,000 and confirm the broader bear trend is intact with no near-term reversal.
Weekly Outlook
The week of July 13 opens with Bitcoin at a delicate technical crossroads: a meaningful bounce off multi-month lows meets a dense overhead EMA resistance cluster at $63,200–$63,900, creating a high-stakes decision zone. The directional bias for the week leans cautiously neutral-to-bearish, as the macro EMA structure, declining OBV, and Fear & Greed Index still in “extreme fear” (23/100) all argue against a sustained breakout without a significant fundamental catalyst. The July 14 CPI release is the single most important event of the week — a softer-than-expected reading could fuel a short-squeeze continuation toward $65,000–$66,000, while a hot print could rapidly unwind this week’s recovery and retest $60,000. Traders should monitor whether BTC can achieve and hold a 4H close above $64,200 as the first meaningful confirmation of recovery momentum, and treat the $61,500 level as the critical near-term floor to defend. Until weekly EMAs begin to flatten and price reclaims at least the $68,836 EMA200, the path of least resistance on the macro timeframe remains downward, and this bounce is best characterized as a tactical opportunity rather than a structural trend reversal.
Disclaimer: This analysis is for informational purposes only and does not constitute financial advice. Cryptocurrency markets are highly volatile and unpredictable. All trading decisions should be made based on your own research and risk tolerance. Block Digest is not responsible for any financial losses incurred as a result of acting on this content.
Stay Ahead of the Market
Follow BlockDigest for crypto market intelligence, research and real-time updates.