
Market Context
The broader altcoin market is operating under notable stress as of June 28, 2026, with BTC dominance holding firm at 56.84–56.85% — a level that historically suppresses meaningful altcoin outperformance. USDT dominance at 8.62% reflects a cautious risk environment where capital continues to seek shelter rather than rotate aggressively into risk assets. The combination of elevated BTC.D and sticky USDT.D suggests that any near-term altcoin recovery will be shallow and selective until one of these metrics shows a decisive directional shift.
Solana (SOL)
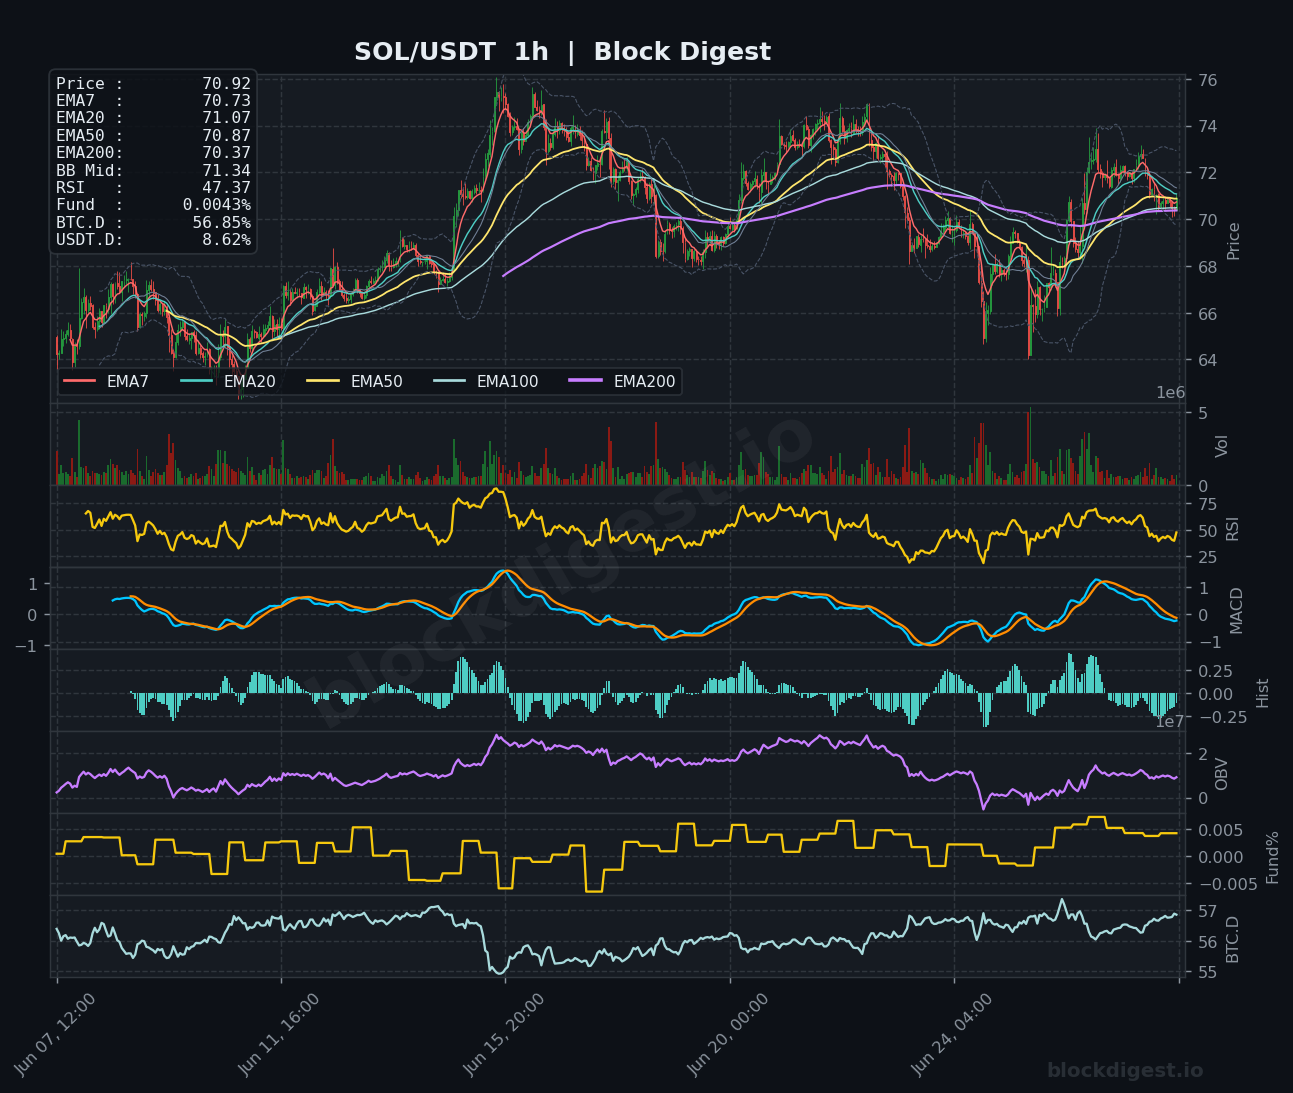
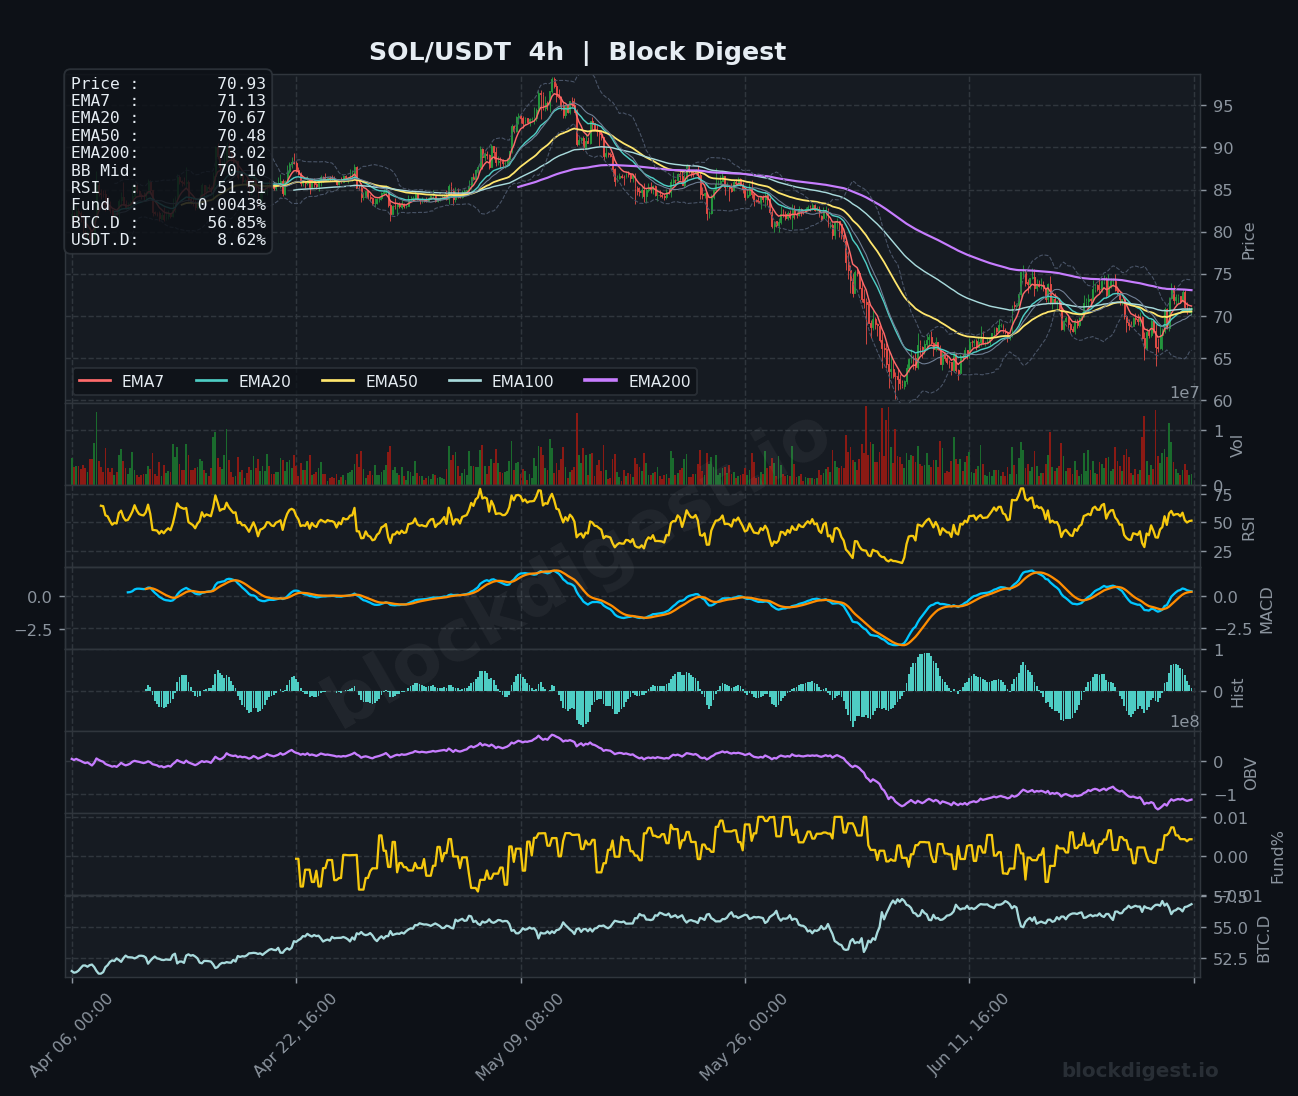
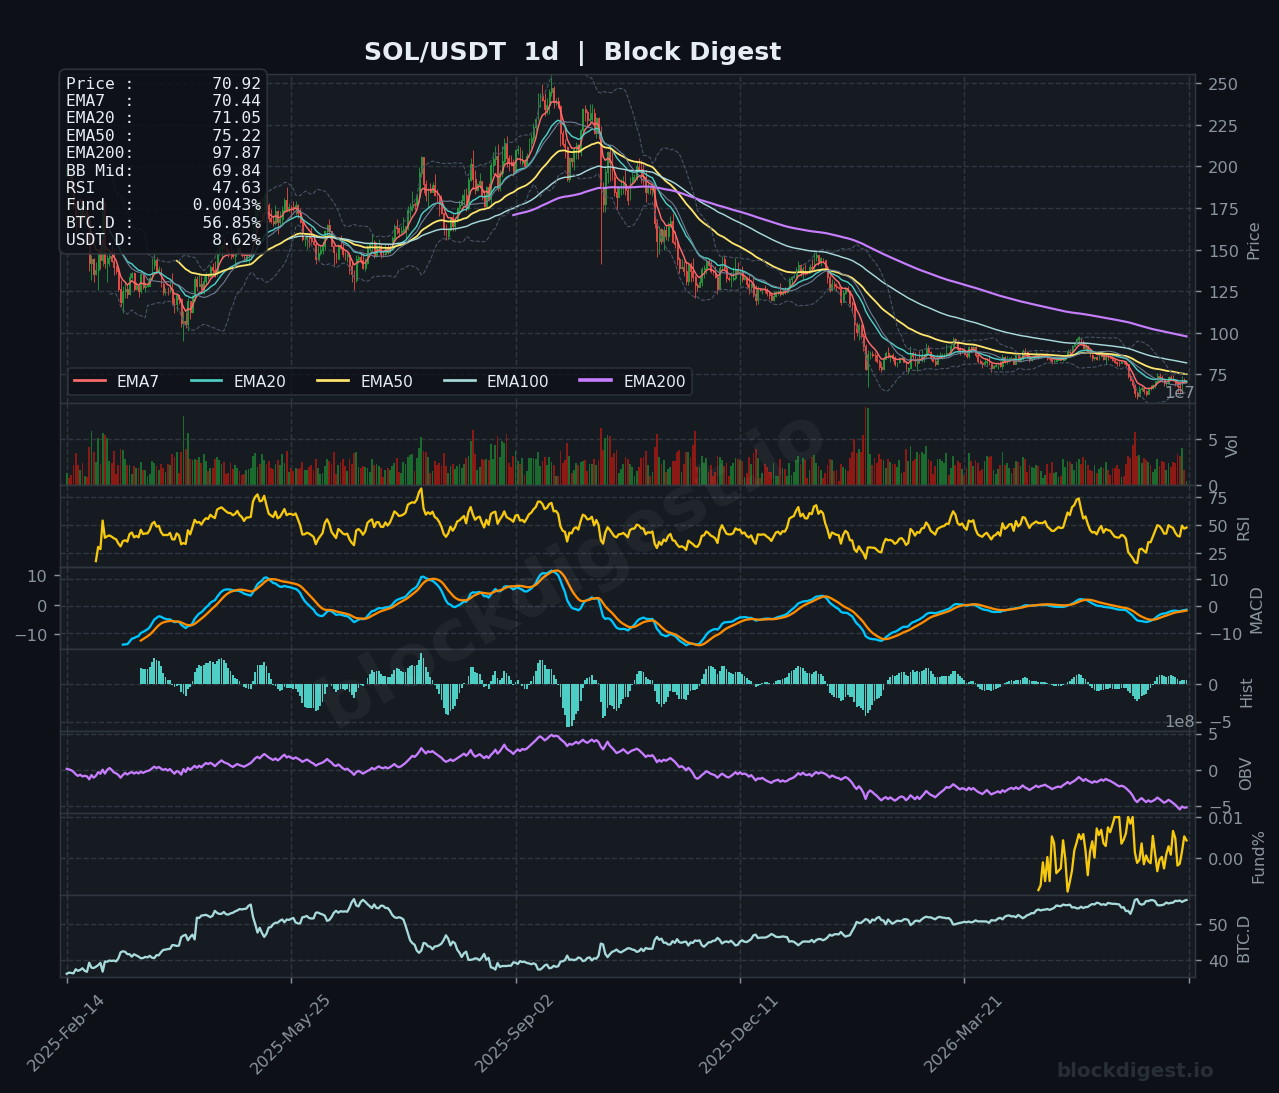
SOL is trading at $70.92, sitting in a tight consolidation band between the EMA7 ($70.73) and EMA50 ($70.87) on the 1-hour chart, signaling indecision at a key structural level. The daily chart paints a bearish picture — price remains well below the EMA50 ($75.22) and the descending EMA200 ($97.87), confirming the broader downtrend that has persisted since the highs above $200. The 1-hour RSI at 47.37 and the 4-hour RSI at 51.51 are both hovering near the neutral midline, while the 4-hour MACD is attempting to curl upward from deeply negative territory but has yet to deliver a confirmed bullish cross. On the daily timeframe, the RSI at 47.63 and a declining OBV reinforce the bearish bias, with $65 acting as near-term support and $74–$75 as the first meaningful resistance cluster to reclaim.
XRP (XRP)
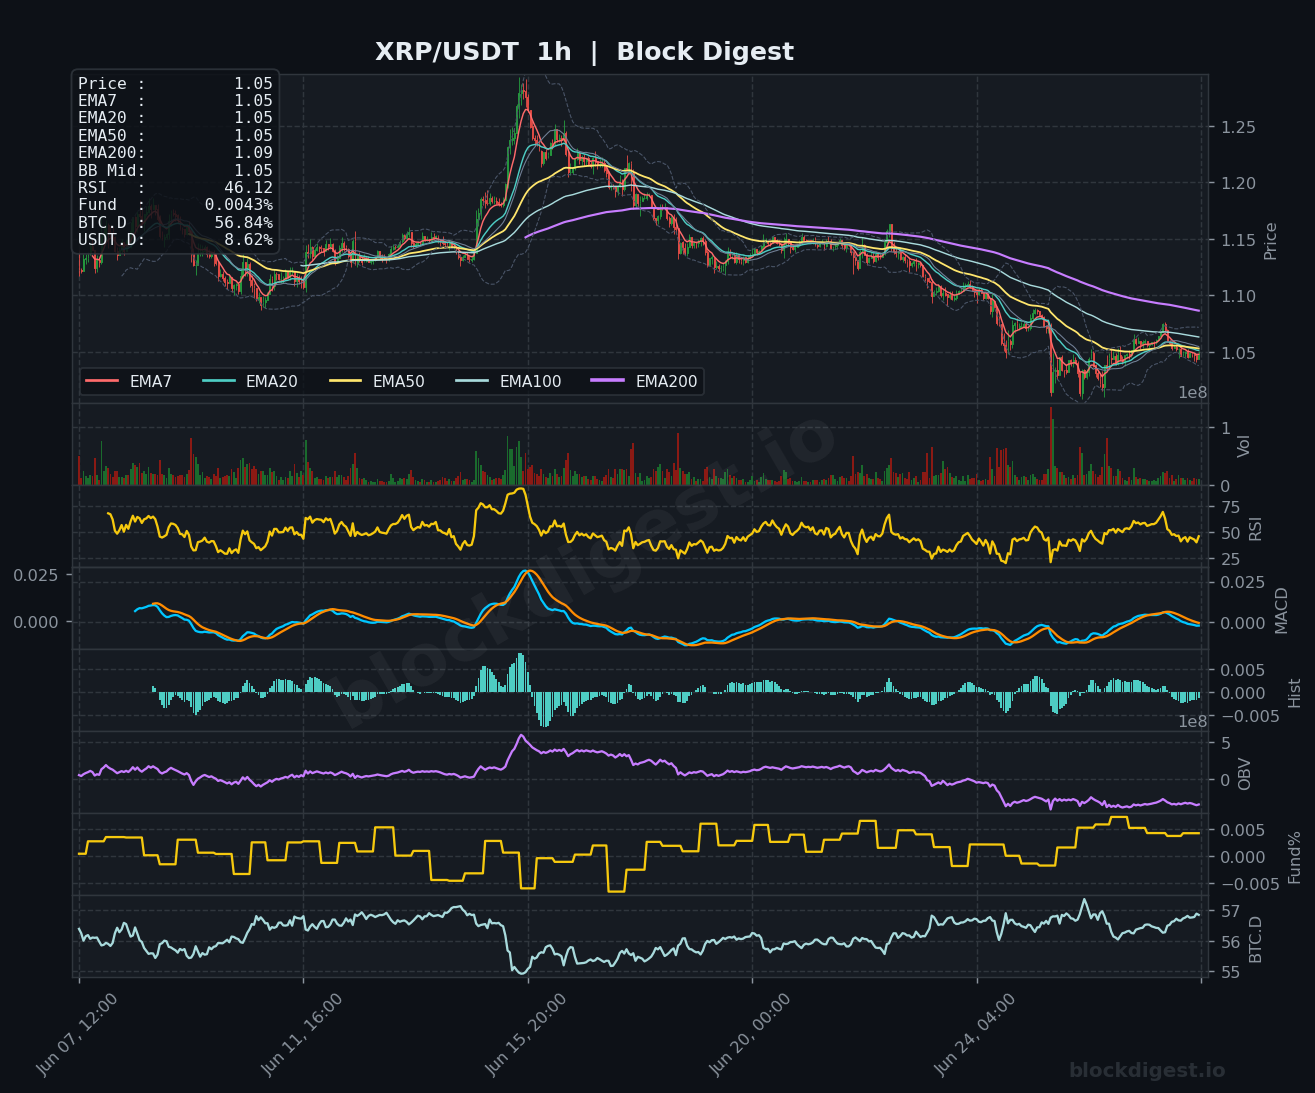
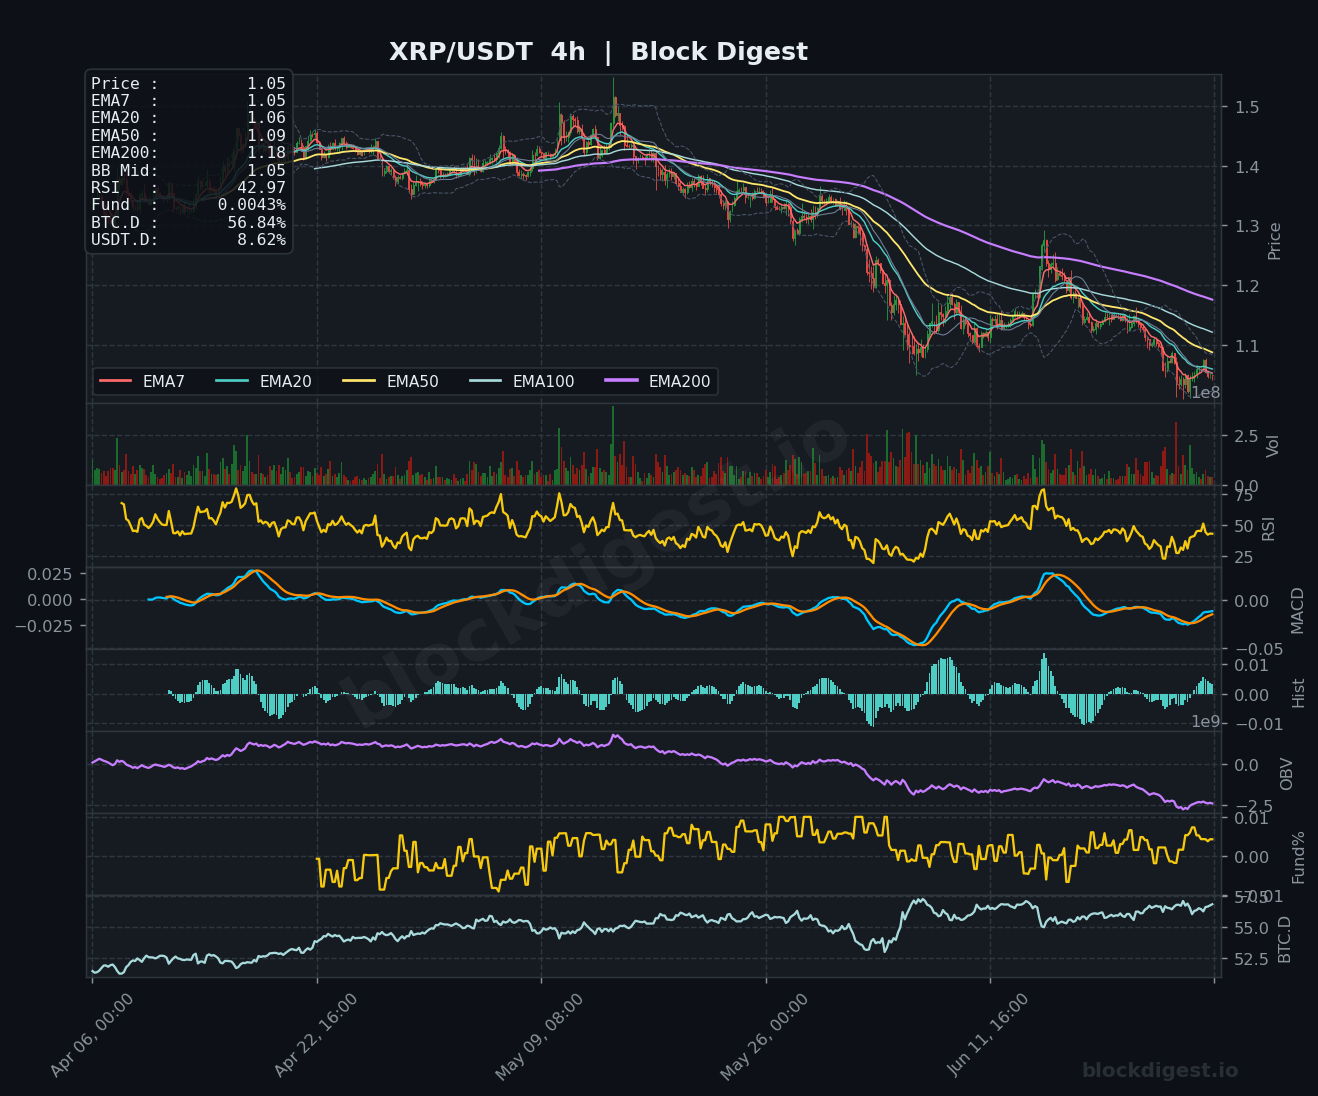
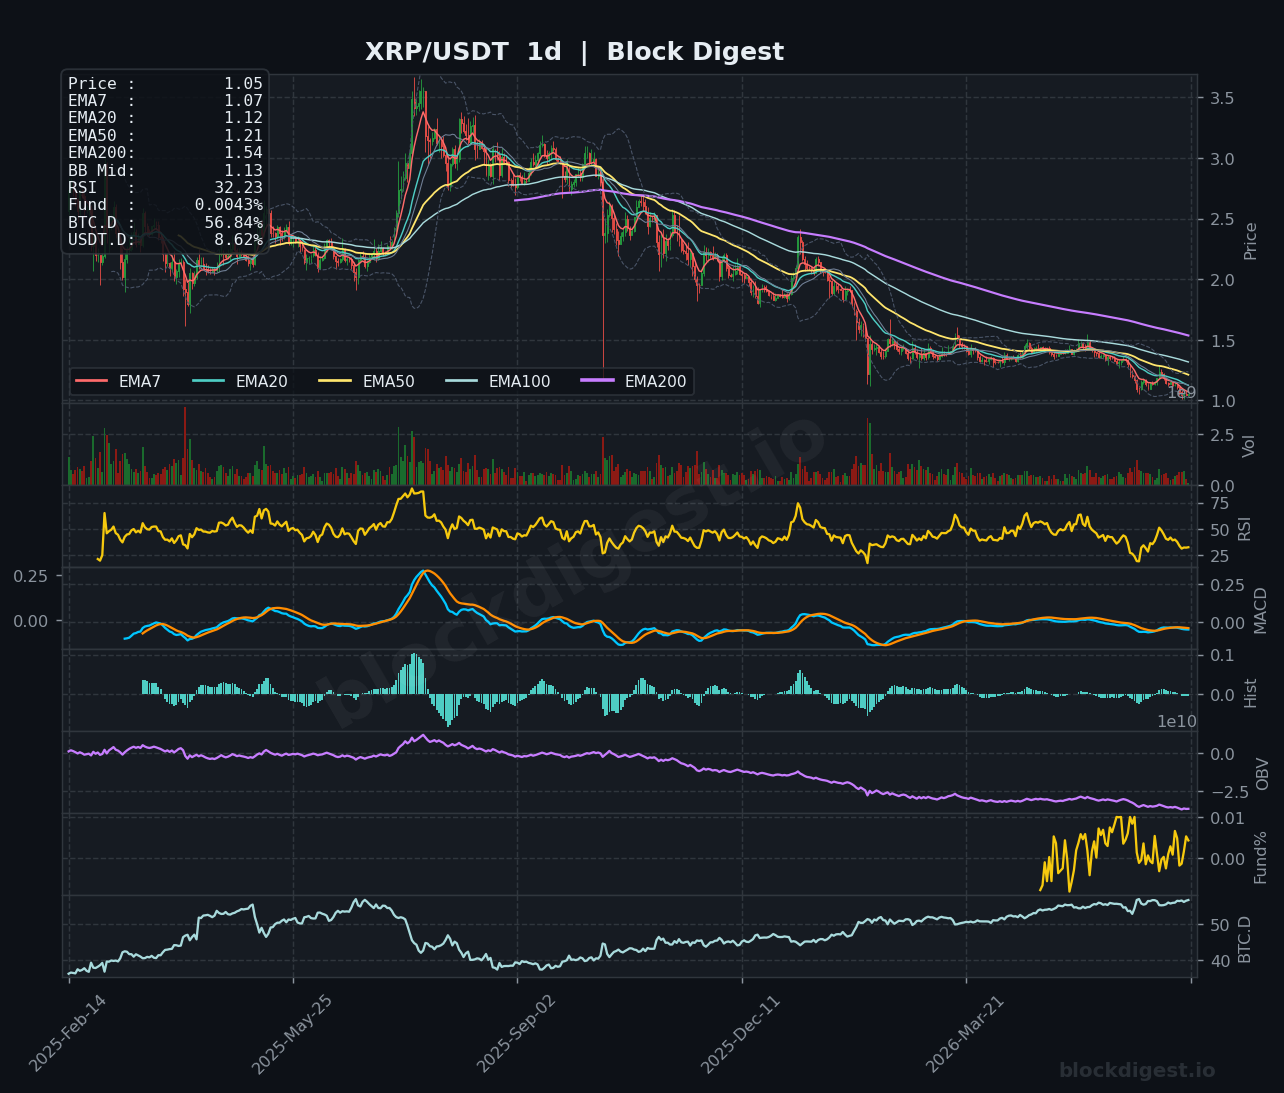
XRP is trading at $1.05, caught in a sustained downtrend following a sharp rejection from highs near $1.50 on the 4-hour chart, with price now pressing into the lower Bollinger Band and all key short-term EMAs stacked bearishly above — EMA7 at $1.05, EMA50 at $1.09, and EMA200 at $1.18. The daily RSI has deteriorated significantly to 32.23, approaching oversold territory, while the daily MACD remains in negative alignment with no clear signs of a bullish histogram reversal. The 4-hour RSI at 42.97 and a declining OBV across all timeframes confirm that selling pressure has been consistent, with the $1.00 psychological level serving as the critical floor to defend. A reclaim of $1.10 would be needed to shift short-term bias to neutral; absent that, the path of least resistance remains to the downside.
BNB (BNB)
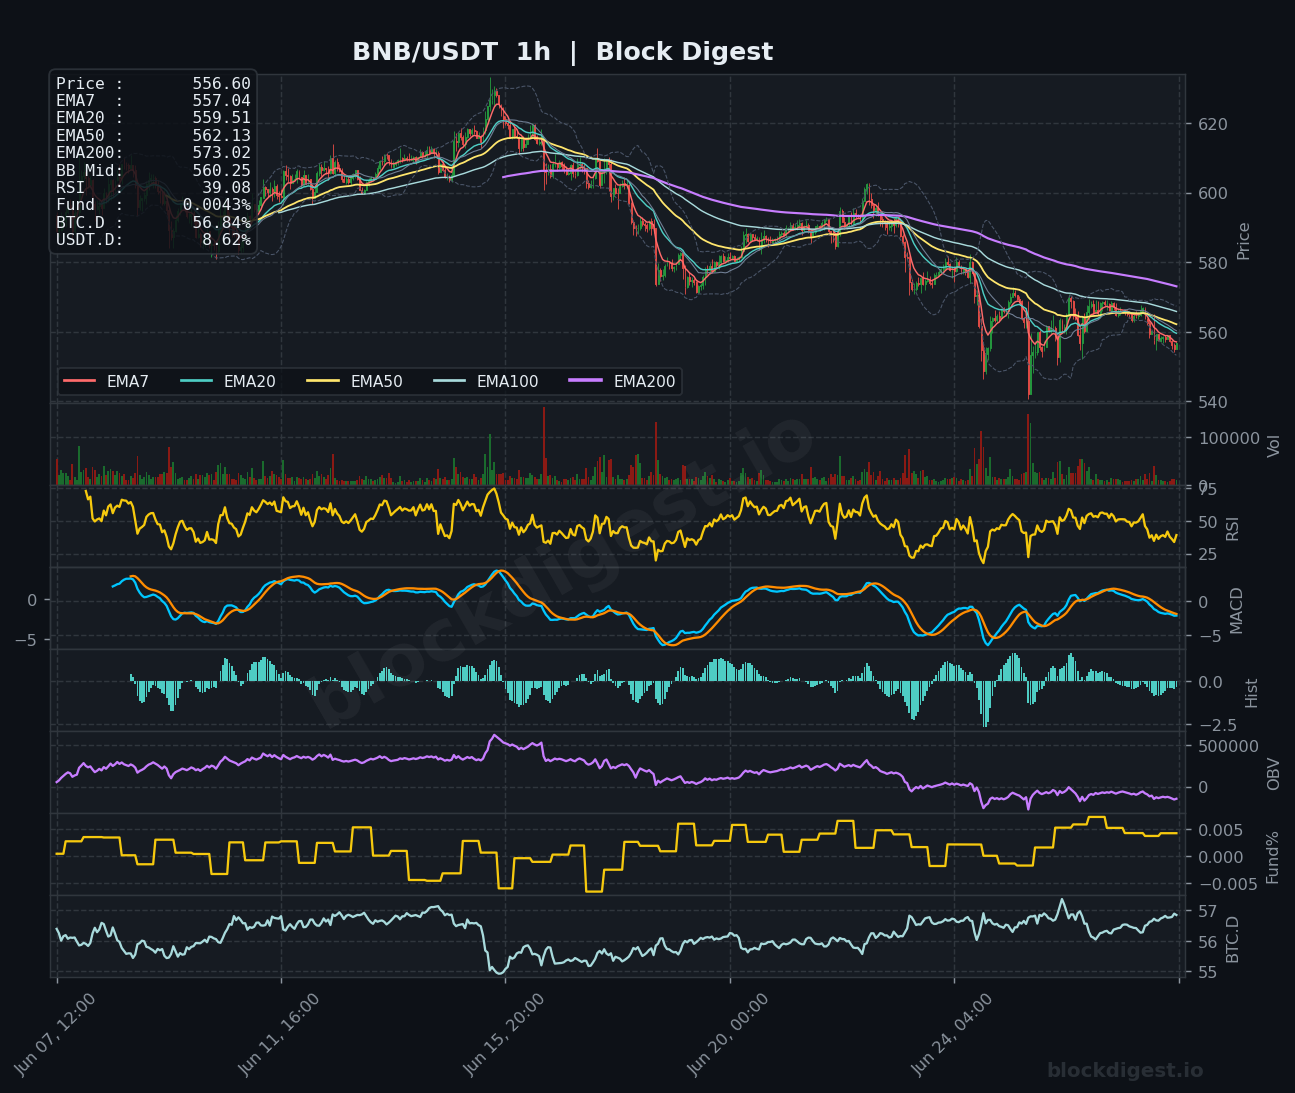
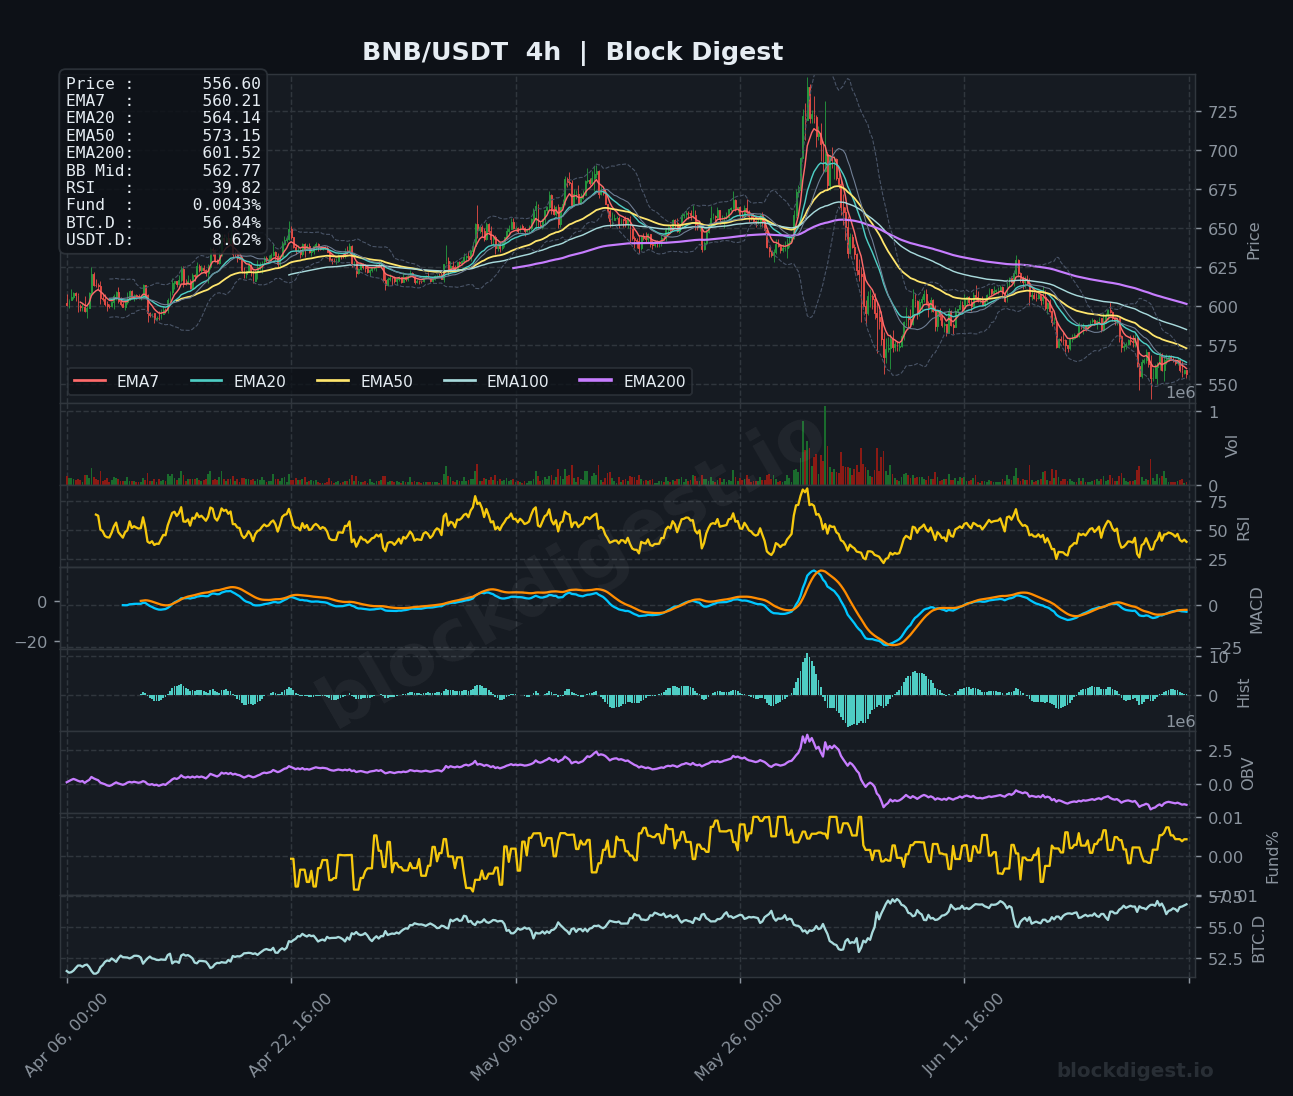
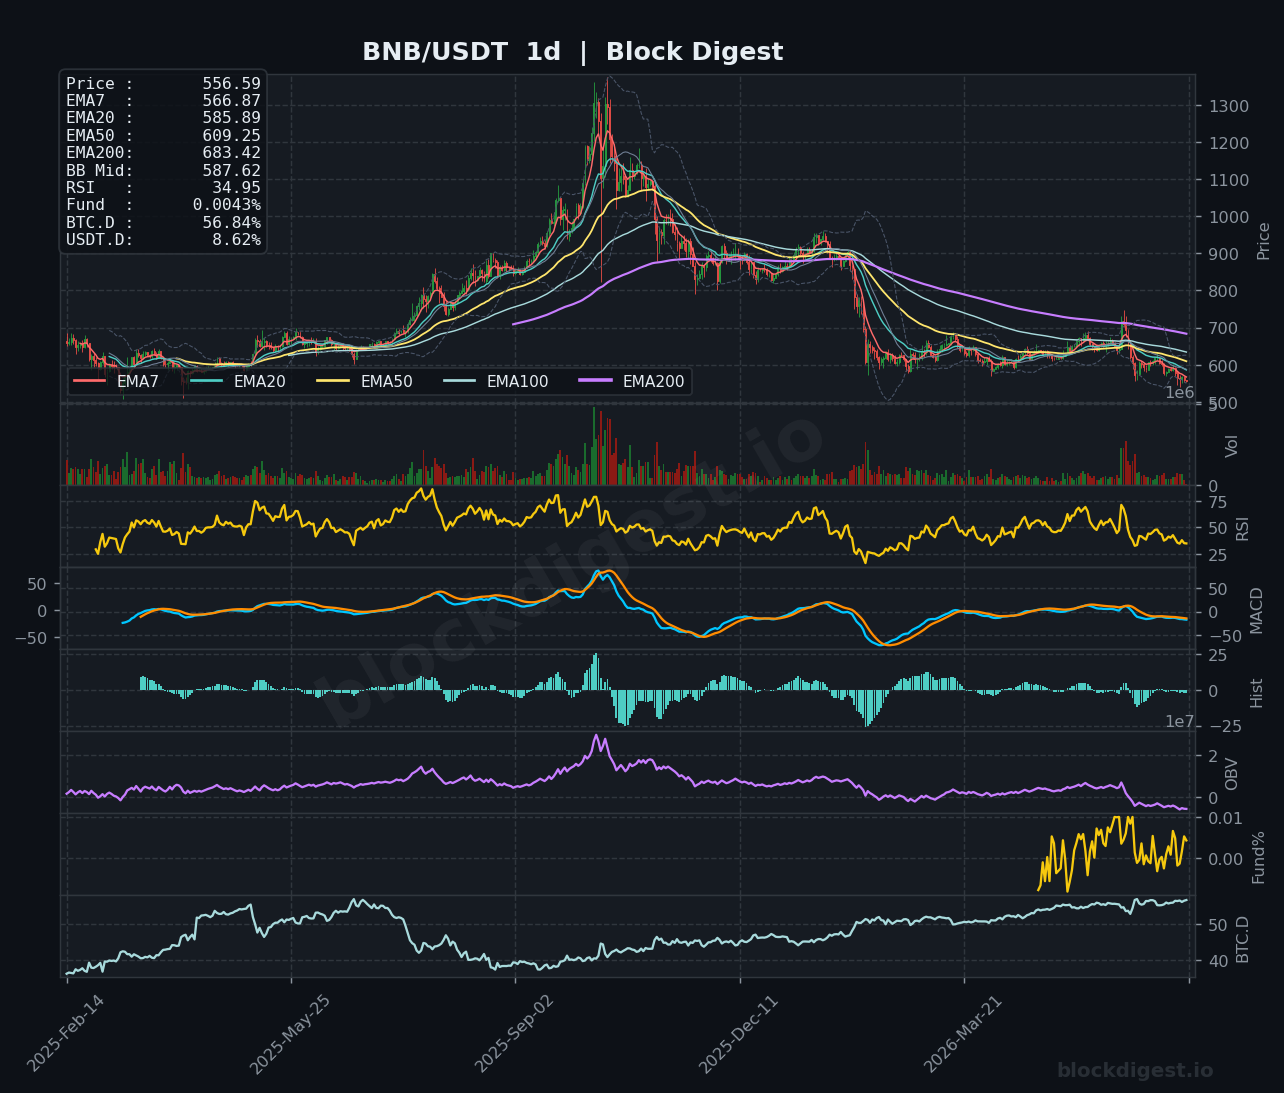
BNB is trading at $556.60, deep in a corrective phase after a sharp rejection from highs near $725 on the 4-hour chart, with the full EMA stack (EMA7 $560.21, EMA20 $564.14, EMA50 $573.15, EMA200 $601.52) all positioned above price in bearish alignment. The 1-hour RSI at 39.08 is approaching oversold levels on shorter timeframes, while the daily RSI at 34.95 signals that BNB is one of the weaker large-cap performers in this cycle. The daily MACD continues to slope negative with no convincing histogram improvement, and OBV on the 4-hour chart has declined sharply from peak levels, reflecting consistent distribution. Immediate support lies around $540–$545, with resistance at $575 and the BB mid at $562.77 acting as near-term overhead pressure; bias remains bearish until a high-volume recovery above $580 materializes.
Dogecoin (DOGE)
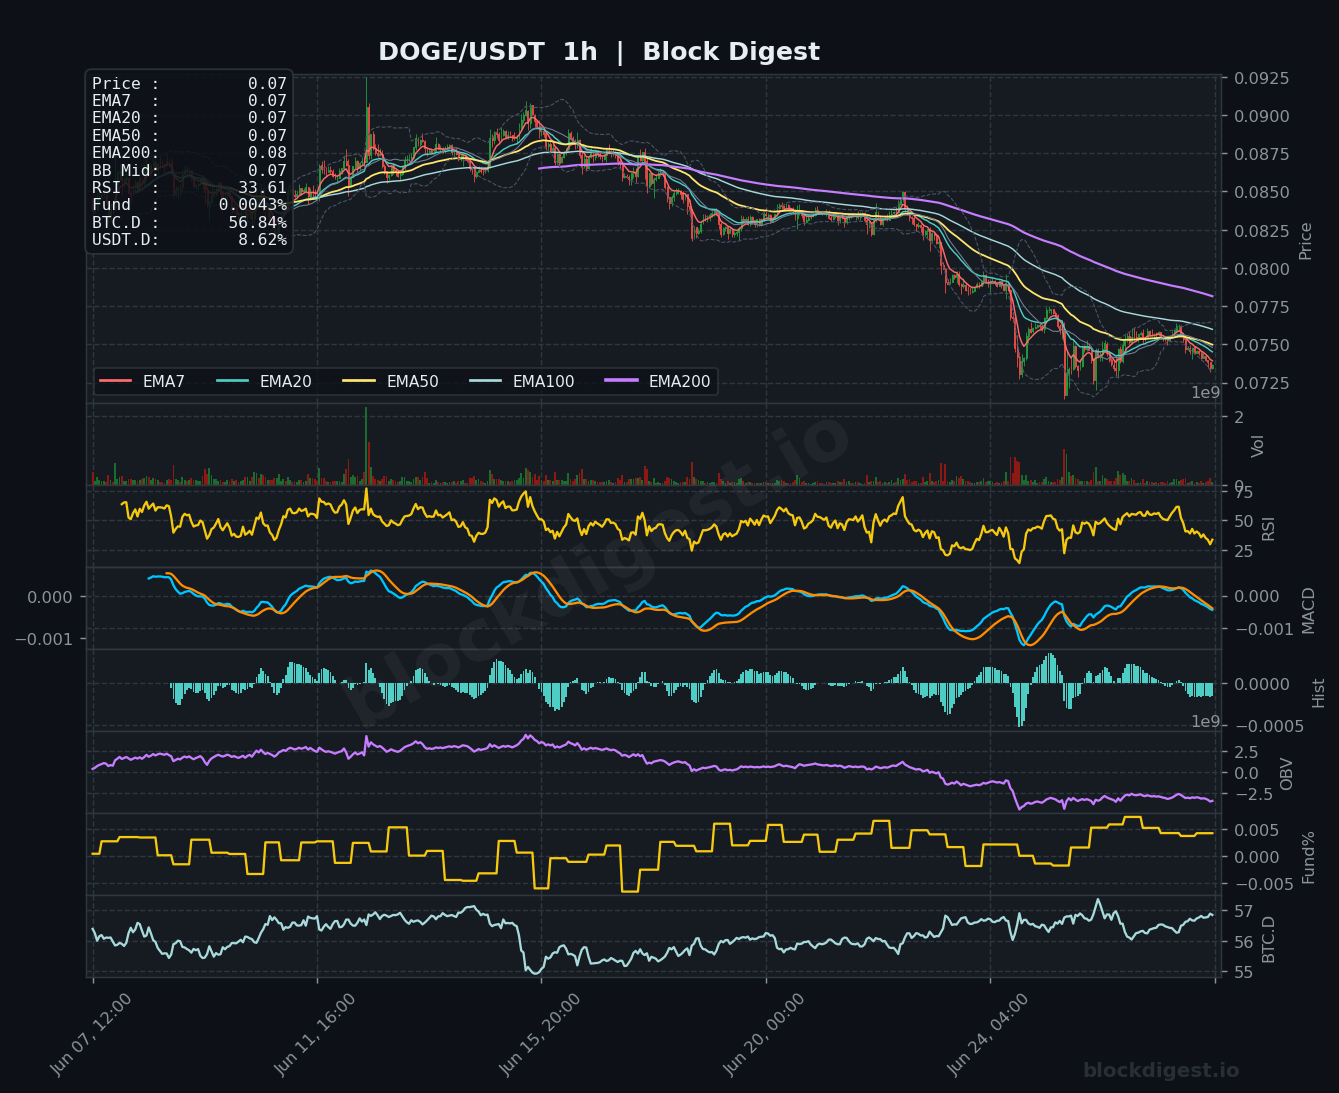
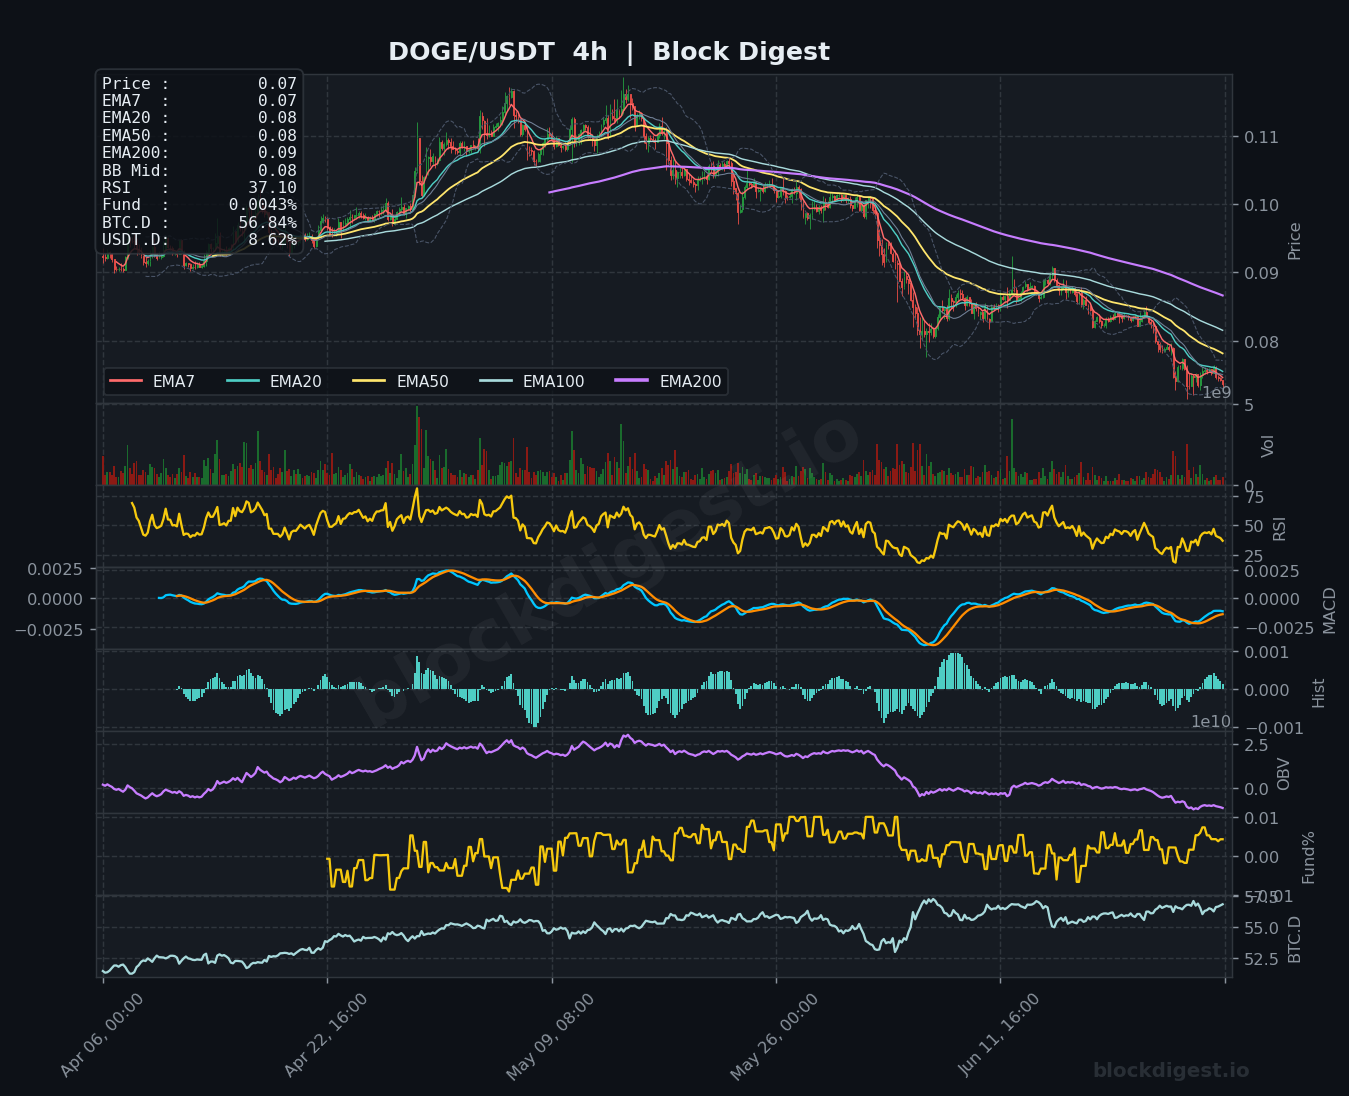
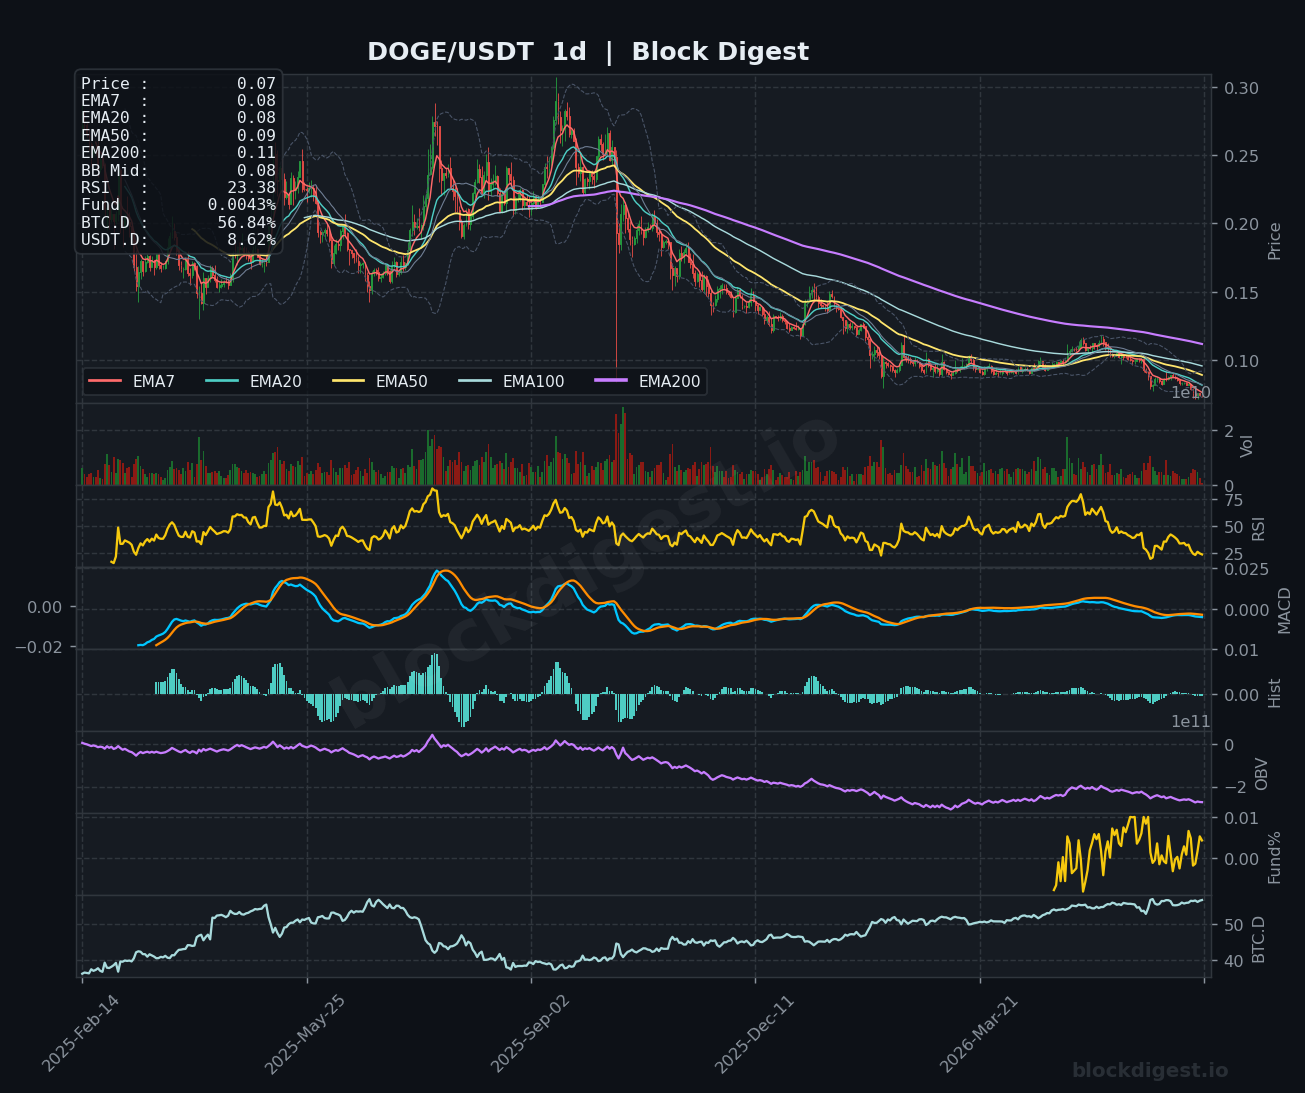
DOGE is trading at $0.07 and is among the weakest setups in today’s review, with the daily RSI collapsing to 23.38 — firmly in oversold territory — and price trading below all major EMAs on every timeframe. The 1-hour chart shows a steady step-down structure from the $0.09 range, with the EMA200 at $0.08 now acting as overhead resistance and the current price hugging the lower end of the Bollinger Band. The 4-hour MACD is attempting a weak recovery from its most negative readings, but the histogram improvement is marginal and OBV continues to deteriorate, suggesting any bounce is likely corrective rather than trend-reversing. Key support sits around the $0.070–$0.072 zone; a sustained close above $0.078 would be the minimum requirement to neutralize the current bearish momentum.
Litecoin (LTC)
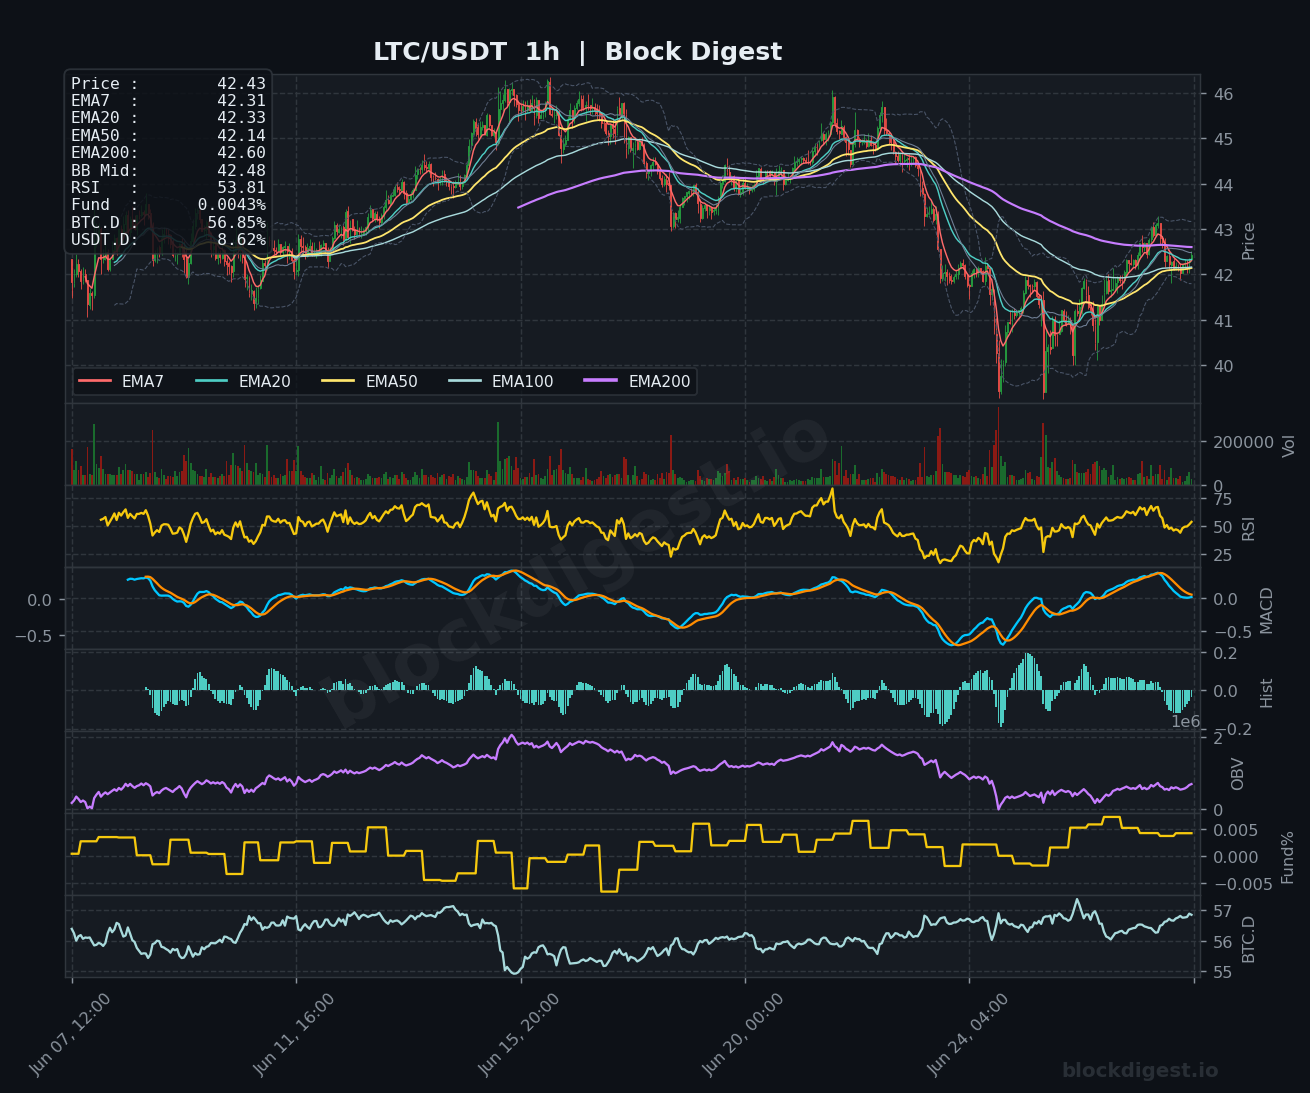
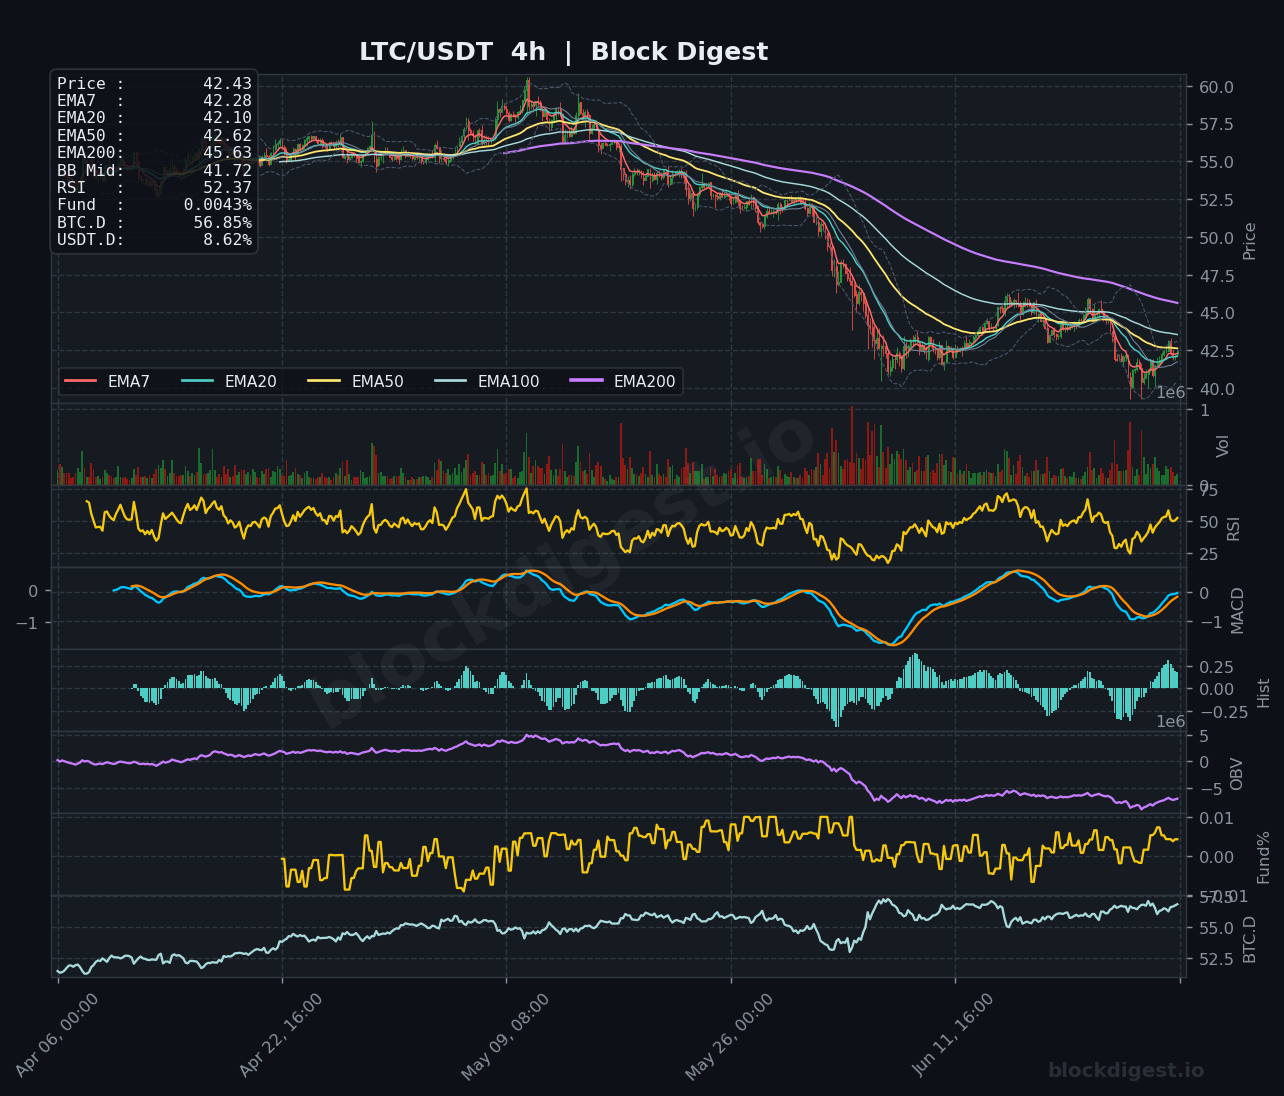
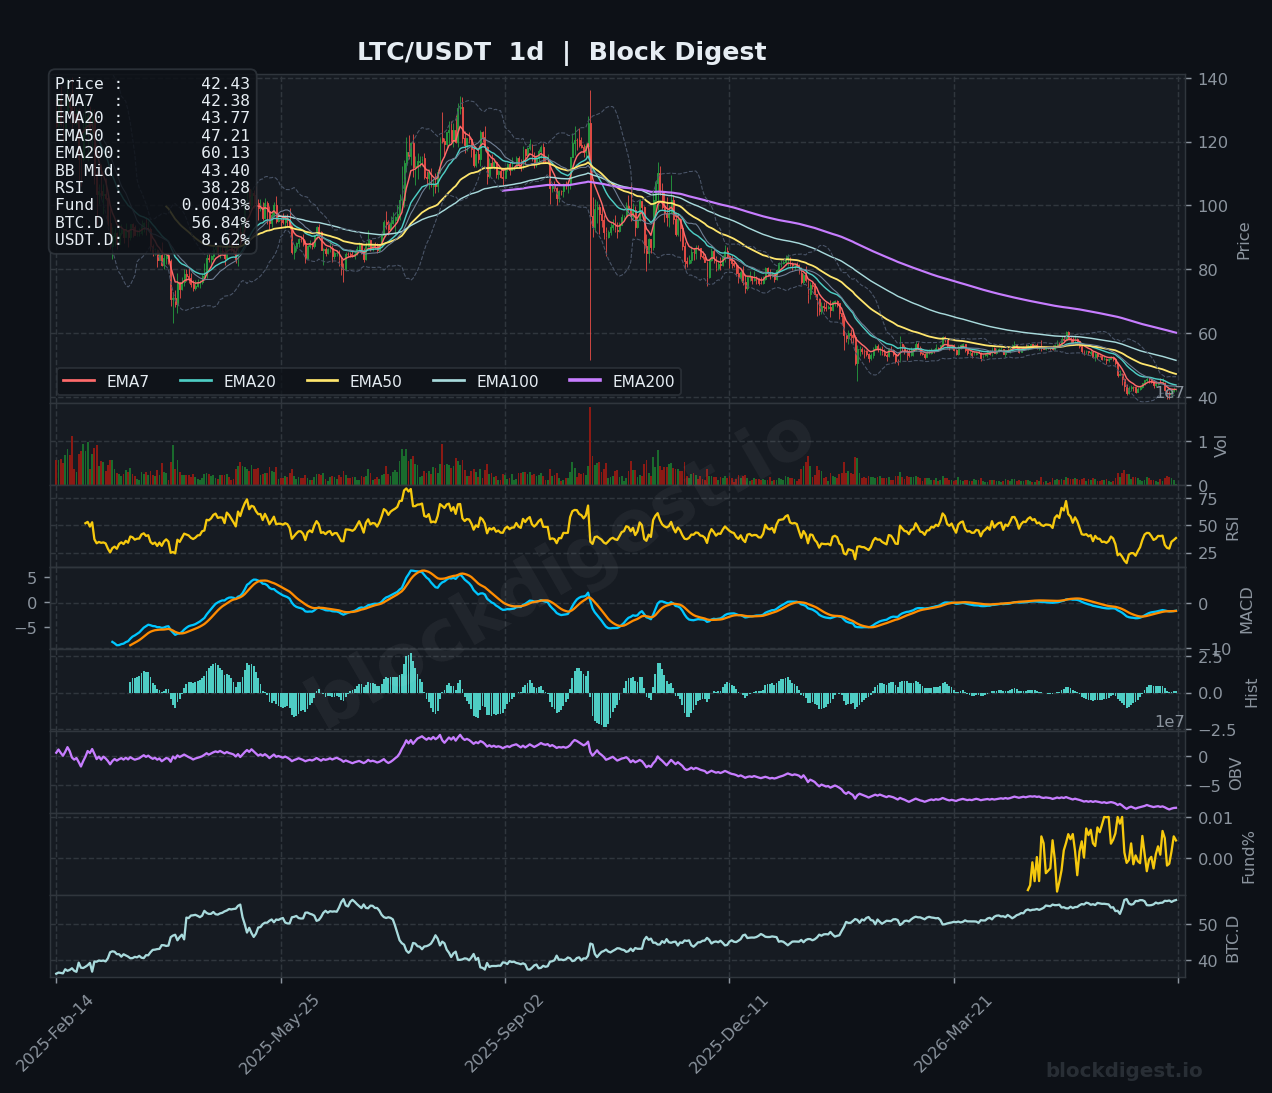
LTC is trading at $42.43, showing a relatively more stable short-term picture than its peers — the 1-hour RSI at 53.81 is above the midline, and the short-term EMAs (EMA7 $42.31, EMA20 $42.33, EMA50 $42.14) are converging tightly near current price, suggesting a potential base-building attempt. However, the daily chart tells a more cautious story: RSI at 38.28 remains in bearish territory, the EMA200 at $60.13 is a distant target, and OBV on both daily and 4-hour frames has trended lower since the local top near $60. The 4-hour MACD is attempting a bullish crossover from deeply negative levels, which warrants monitoring, but the broader trend structure remains bearish as long as price stays below the $47–$48 resistance cluster. LTC’s relatively neutral hourly momentum makes it a mild standout versus DOGE and XRP, though the downtrend on higher timeframes must be respected.
TRON (TRX)
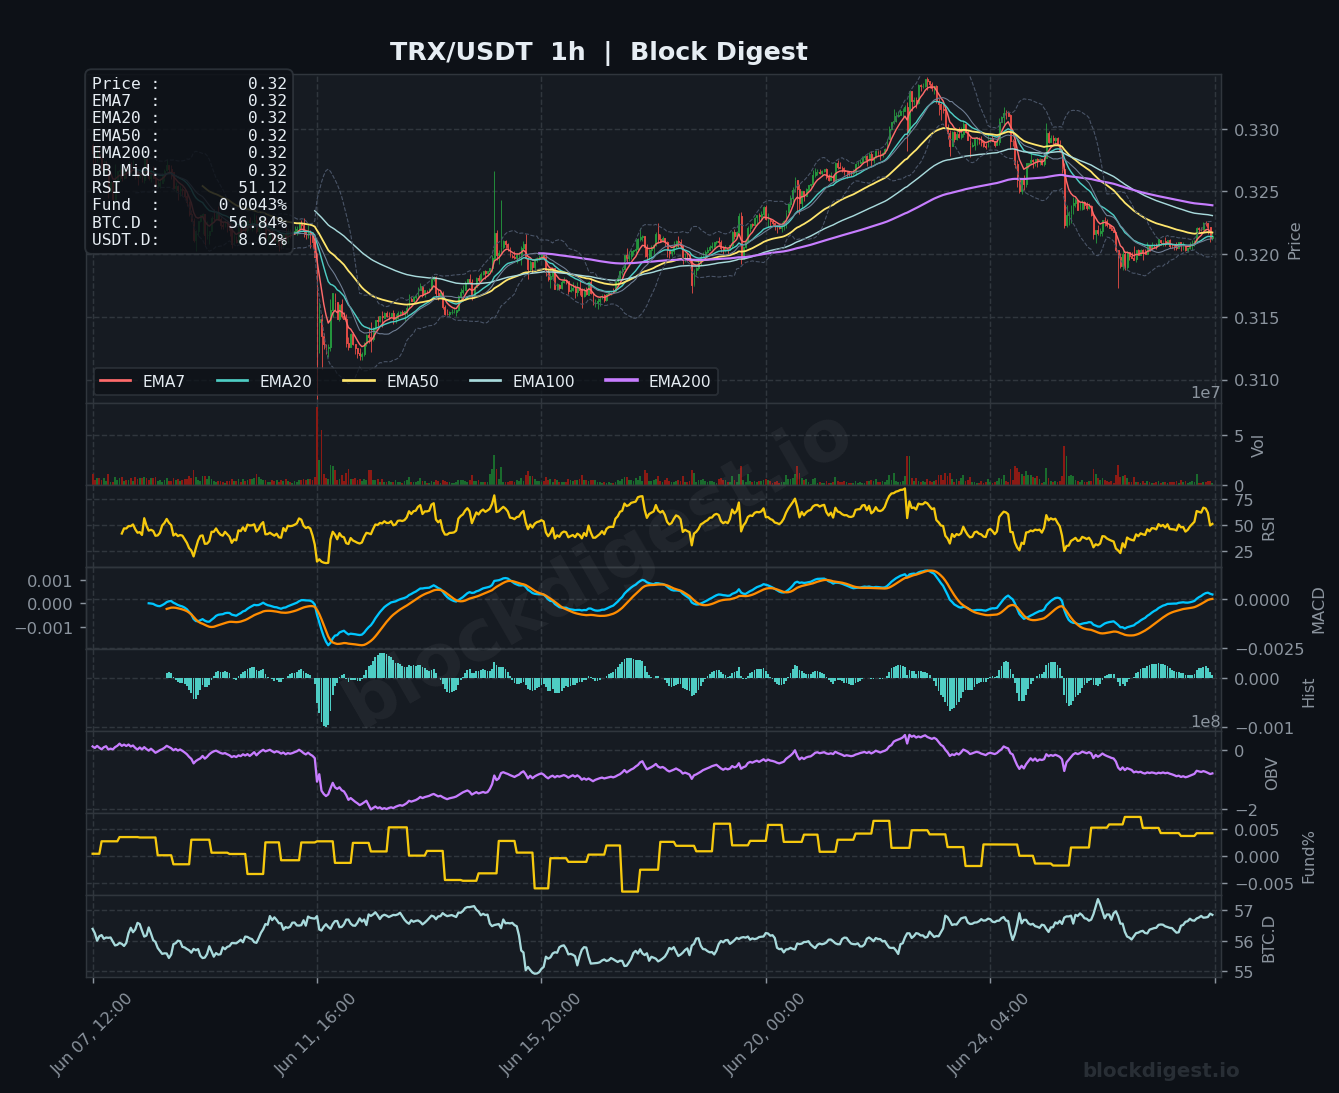
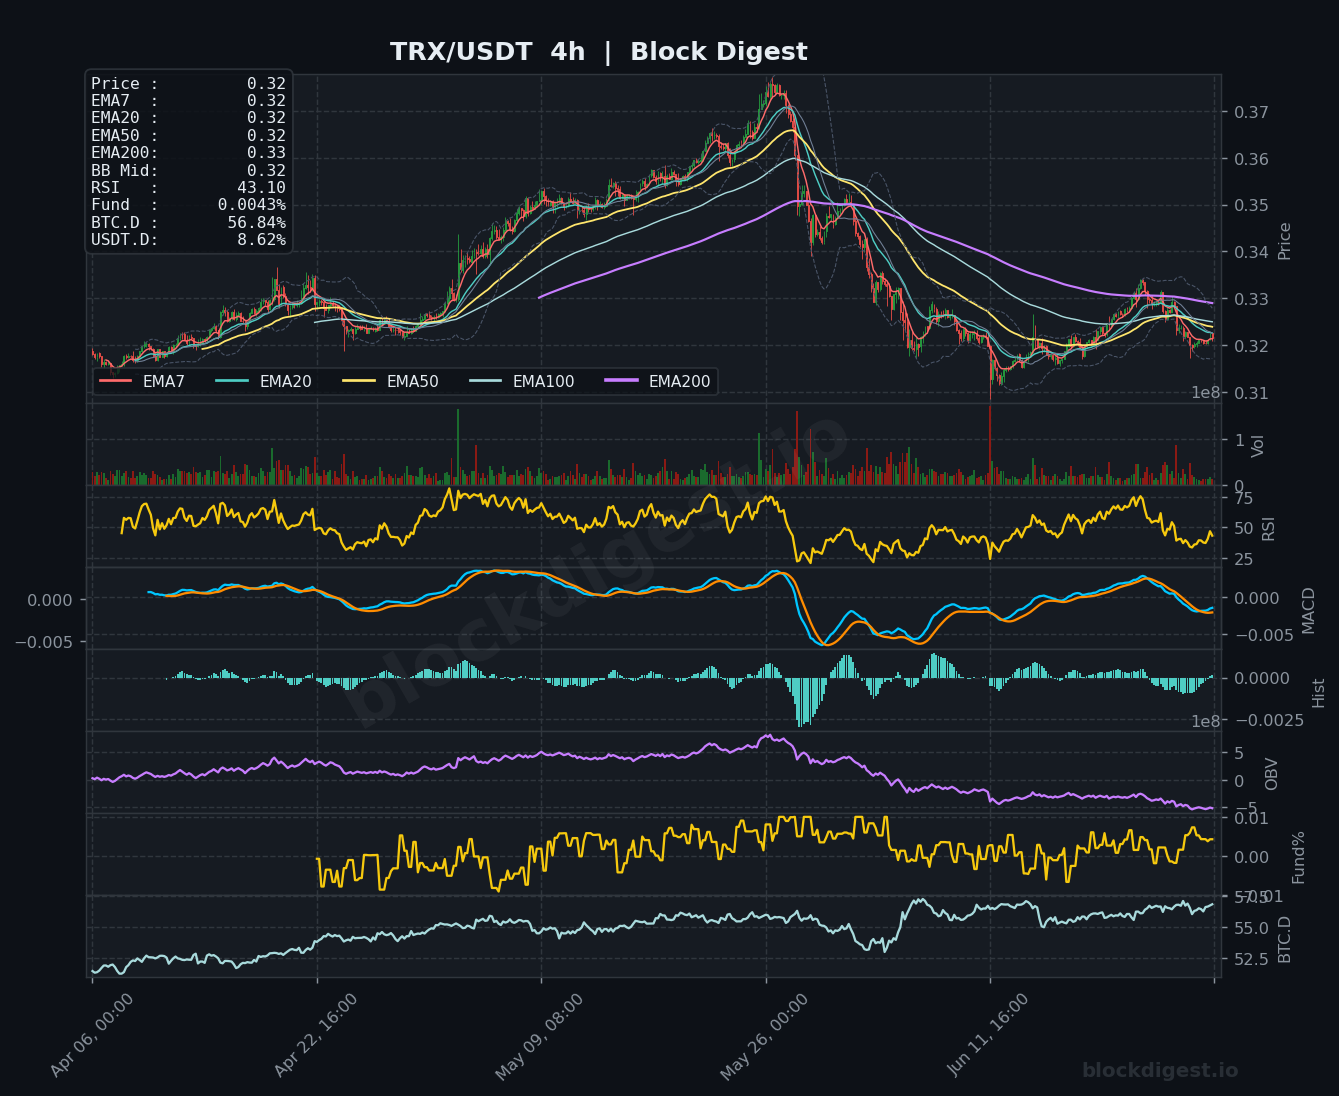
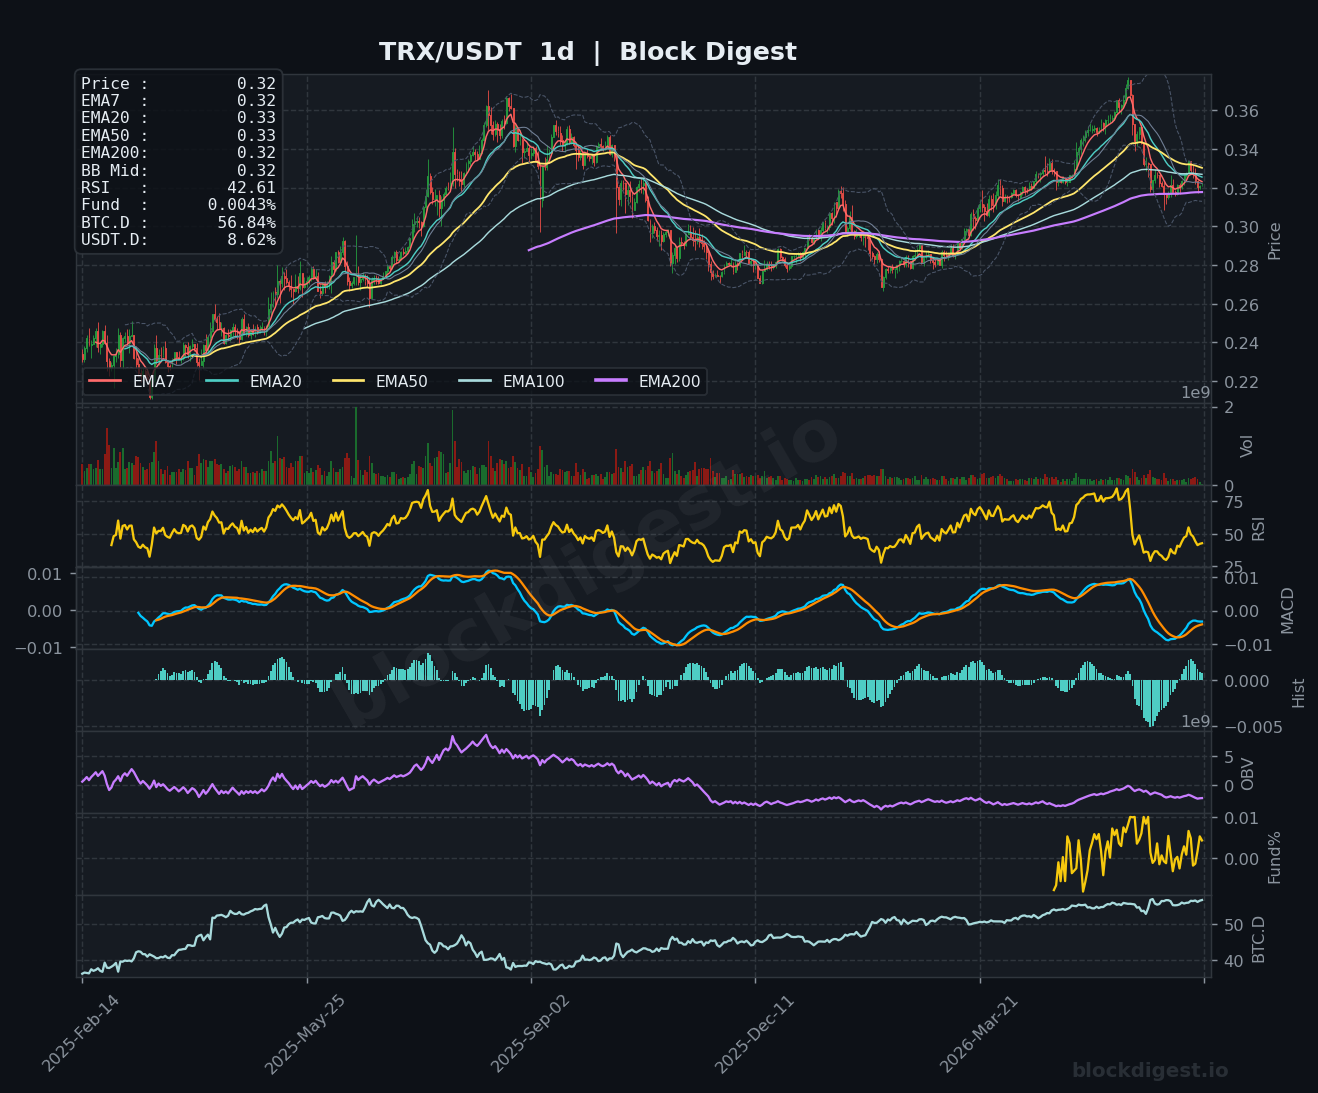
TRX is trading at $0.32 and displays a notably more resilient structure compared to most altcoins in this roundup. On the daily chart, price is trading near the EMA200 ($0.32), with the EMA7 and EMA20 also clustered tightly around $0.32–$0.33, suggesting the token is holding a key long-term support zone. The 1-hour RSI at 51.12 is neutral-to-slightly-bullish, and the 4-hour RSI at 43.10 — while not strong — is less deteriorated than peers like DOGE or XRP. The daily MACD is showing a slight negative divergence in the histogram, but OBV has not collapsed as severely as other altcoins, indicating relatively better demand absorption. Resistance sits near $0.335–$0.340, and a sustained hold above $0.320 would keep the neutral-to-cautiously-bullish daily bias intact; a break below $0.315 would invalidate the current support thesis.
Altcoin Outlook
The overall altcoin landscape as of June 28, 2026 is decidedly bearish to neutral, with BTC dominance near 57% and USDT.D elevated at 8.62% leaving little room for a broad-based recovery. Among the coins reviewed, TRX and LTC present the least damaged technical setups, with TRX holding critical EMA support on the daily and LTC showing early signs of short-term stabilization on the 1-hour chart. XRP, BNB, and DOGE remain the weakest setups — DOGE in particular is flashing an extreme daily RSI oversold reading of 23, which may trigger a technical bounce but does not signal a trend reversal in isolation. Traders should watch for a BTC.D pullback below 55.5% and USDT.D declining toward 7.5% as the key macro catalysts required to trigger a meaningful altcoin rotation; until those thresholds are tested, defensive positioning remains the prudent approach.
Disclaimer: This analysis is for informational purposes only and does not constitute financial advice. Cryptocurrency markets are highly volatile and unpredictable. All trading decisions should be made based on your own research and risk tolerance. Block Digest is not responsible for any financial losses incurred as a result of acting on this content.
Stay Ahead of the Market
Follow BlockDigest for crypto market intelligence, research and real-time updates.


