BTC Daily Analysis — May 15, 2026
BTC Daily Analysis – May 15, 2026
Market Overview
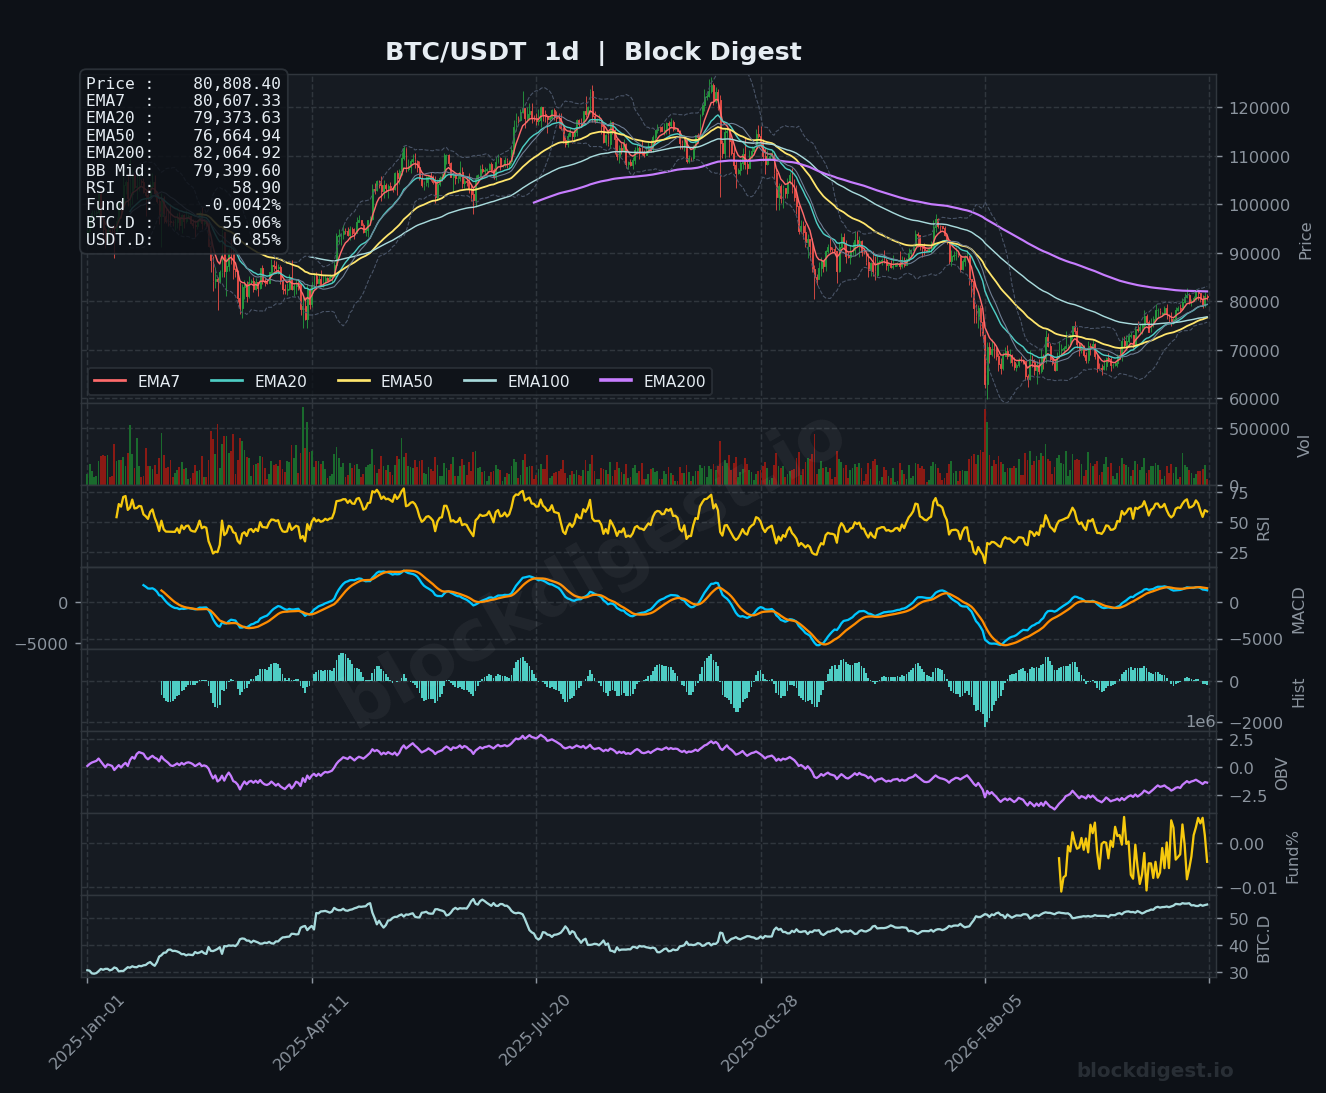
Bitcoin is currently trading at $80,808, positioned above its short-term exponential moving averages but notably below the key EMA200 at $82,065 on the daily timeframe. The price structure shows BTC consolidating within a tight range between $79,400 and $81,015 (Bollinger Band midpoint), suggesting indecision following the 25% decline from January’s all-time high near $126,000. On the daily chart, Bitcoin remains in a corrective phase with price action compressed between the EMA50 ($76,665) and EMA200 ($82,065), while the shorter-term EMAs have flattened, indicating a lack of directional conviction in the current market structure.
Multi-Timeframe Confluence
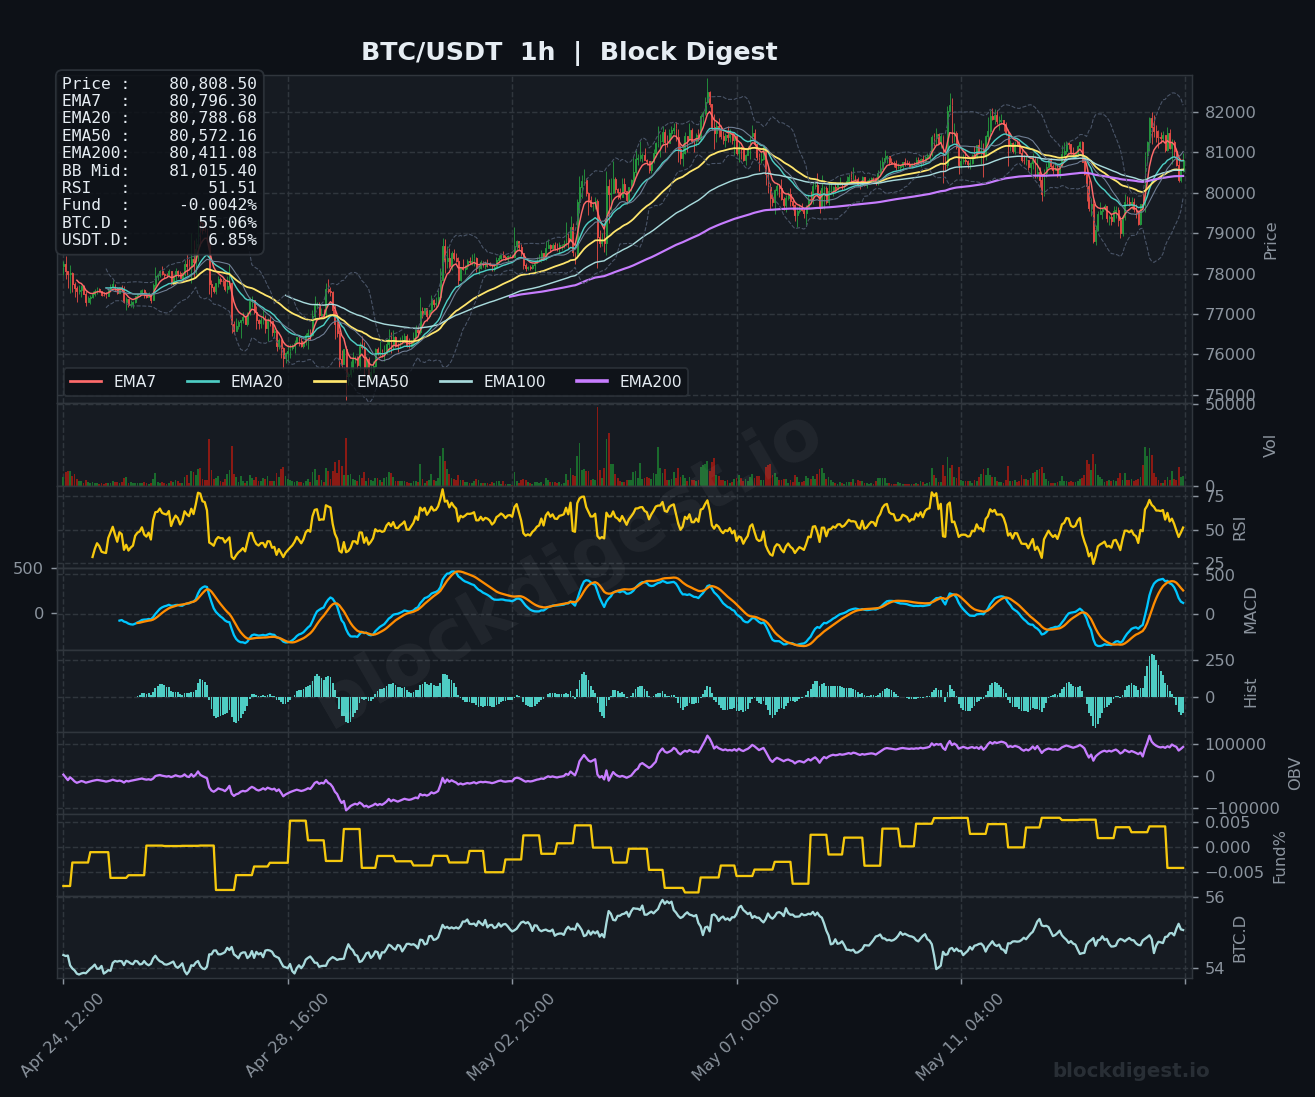
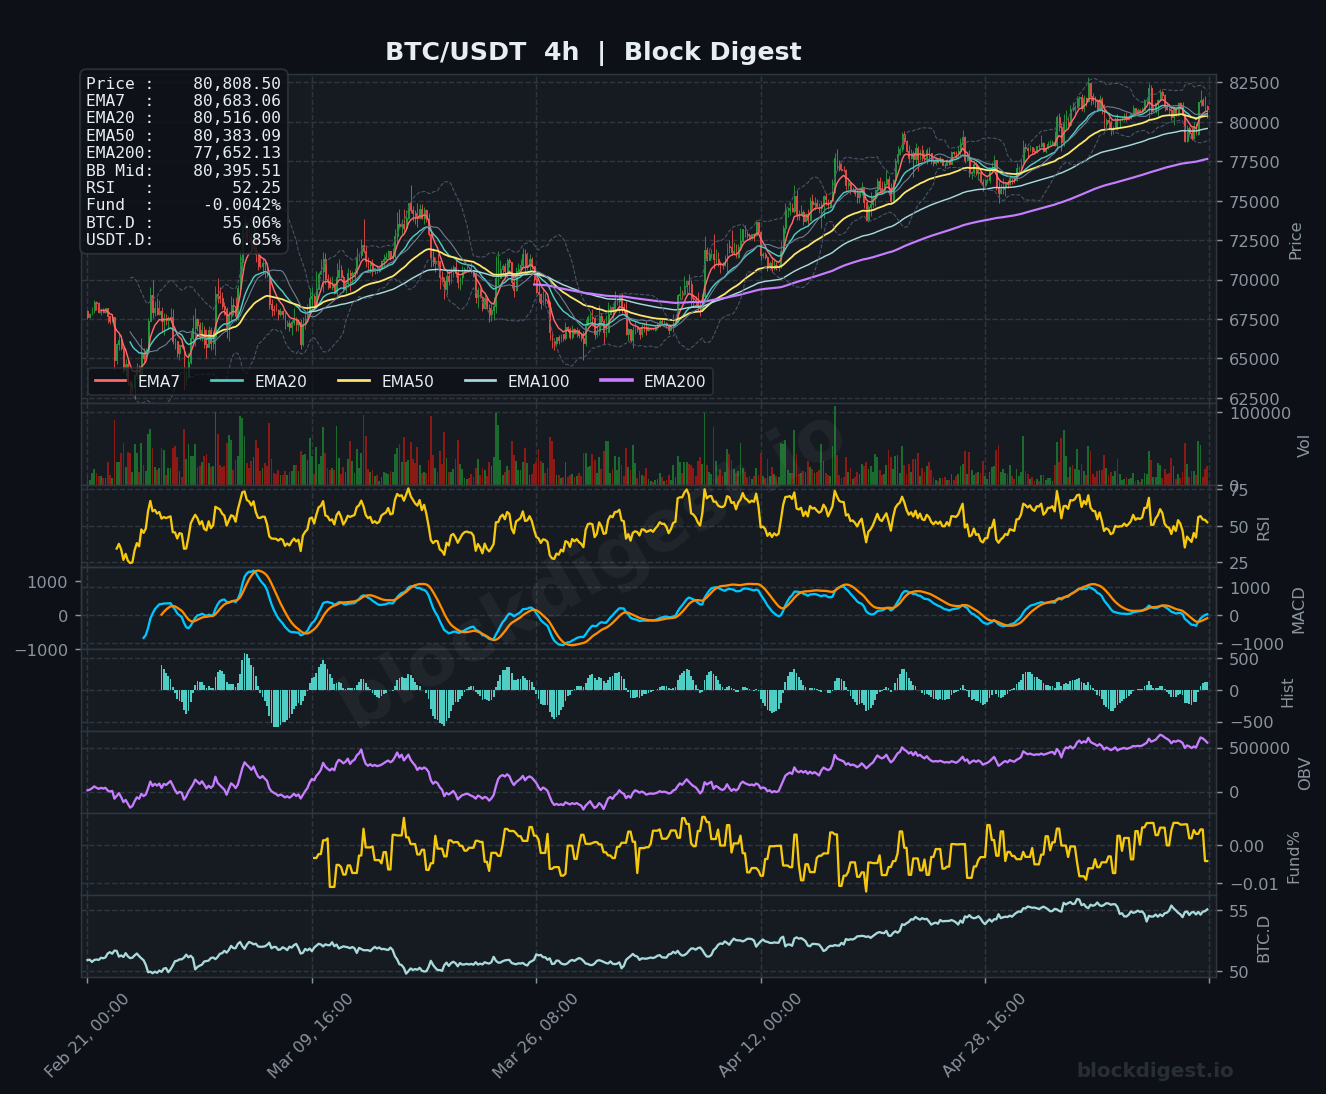
The multi-timeframe analysis reveals conflicting signals across different horizons. The 1-hour chart shows price consolidating tightly above all shorter-term EMAs (EMA7: $80,796, EMA20: $80,789, EMA50: $80,572), with the EMA ribbon compressed and nearly flat, suggesting equilibrium. The 4-hour timeframe presents a more constructive picture with price above the EMA7 ($80,683) and EMA20 ($80,516), though it’s testing resistance at the EMA50 ($80,383) and facing significant overhead supply at the EMA200 ($77,652). However, the daily timeframe tells a different story—price is struggling beneath the EMA200 ($82,065), which has acted as formidable resistance during recent rally attempts, while the downward-sloping EMA200 continues to cap upside momentum.
Key Levels to Watch
Resistance:
- $82,065 – Daily EMA200, the most critical resistance level that has consistently rejected rallies and represents the dividing line between structural recovery and continued correction
- $82,500 – Recent swing high visible on the 4-hour chart and psychological level that aligns with previous consolidation zones
- $84,000-$85,000 – Major resistance zone from earlier price action that would signal a complete trend reversal if reclaimed
Support:
- $80,383 – 4-hour EMA50 and current pivot support; loss of this level would trigger short-term bearish pressure
- $79,400 – Lower Bollinger Band on the daily chart and key support from recent price consolidation; critical near-term floor
- $76,665 – Daily EMA50, representing the last line of defense before a potential test of deeper support levels in the $73,000-$75,000 range
Momentum & On-Chain Signals
Momentum indicators present a mixed but gradually improving picture across timeframes. The RSI on the 1-hour (51.51) and 4-hour (52.25) charts both hover in neutral territory, suggesting neither overbought nor oversold conditions, while the daily RSI (58.90) sits comfortably above the midpoint, indicating underlying strength despite the rangebound price action. The MACD across all timeframes shows compressed histograms with the signal lines converging near zero, reflecting the current consolidation phase without clear directional bias. On-Balance Volume (OBV) on the daily chart has stabilized after significant distribution during the January-April correction, now showing slight accumulation patterns that suggest smart money may be quietly building positions. The funding rate remains slightly negative at -0.0042%, indicating minimal short-term speculative positioning and a neutral to slightly bearish sentiment among perpetual traders, which paradoxically can support upside moves when positioning is not overly crowded.
BTC Dominance & Market Sentiment
Bitcoin dominance stands at 55.06%, reflecting BTC’s continued outperformance relative to altcoins and suggesting risk-off behavior within the crypto market as capital concentrates in the leading asset. Meanwhile, USDT dominance at 6.85% remains relatively elevated, indicating that stablecoin positioning is still significant and liquidity hasn’t fully rotated back into risk assets. This combination of elevated BTC.D and sustained USDT.D suggests cautious market sentiment, where investors prefer Bitcoin’s relative safety over altcoin speculation but haven’t fully committed capital back into crypto, keeping dry powder in stablecoins. This dynamic typically precedes either a broader market recovery (if BTC breaks higher and drags alts along) or further consolidation until clearer directional catalysts emerge.
Risk Scenarios
Bullish case: A decisive 4-hour close above the daily EMA200 at $82,065, accompanied by expanding volume and positive MACD crossover, would confirm short-term trend reversal and target the $84,000-$85,000 resistance zone. Sustained strength above $85,000 could trigger momentum acceleration toward $88,000-$90,000 as short covering and FOMO buying intensify.
Bearish case: Failure to reclaim $82,065 followed by a breakdown below $79,400 would expose the daily EMA50 at $76,665, with potential for an extended move toward the $73,000-$75,000 demand zone. A loss of $76,000 would likely trigger cascade liquidations and test conviction among remaining bulls, potentially setting up a deeper correction toward $70,000.
Outlook
Bitcoin remains structurally neutral-to-bullish in the near term, with consolidation around $80,800 offering a potential launchpad for the next directional move. The critical catalyst over the next 24-48 hours will be the market’s response to the $82,065 daily EMA200 resistance—a convincing break above this level on volume would shift momentum decidedly bullish, while repeated rejections could lead to range compression breakdown toward $79,000. Given the neutral RSI readings, compressed MACD, and stabilizing OBV, the setup favors patience until a clear breakout or breakdown occurs. Traders should monitor volume expansion at key levels, as the current low-volatility environment typically precedes significant directional moves. The combination of elevated funding neutrality and cautious dominance metrics suggests limited downside risk below $79,000, making this zone attractive for risk-defined entries targeting the $84,000-$85,000 breakout zone.
Disclaimer: This analysis is for informational purposes only and does not constitute financial advice. Cryptocurrency markets are highly volatile and unpredictable. All trading decisions should be made based on your own research and risk tolerance. Block Digest is not responsible for any financial losses incurred as a result of acting on this content.