BTC Daily Analysis — May 14, 2026
BTC Daily Analysis – May 14, 2026
Market Overview
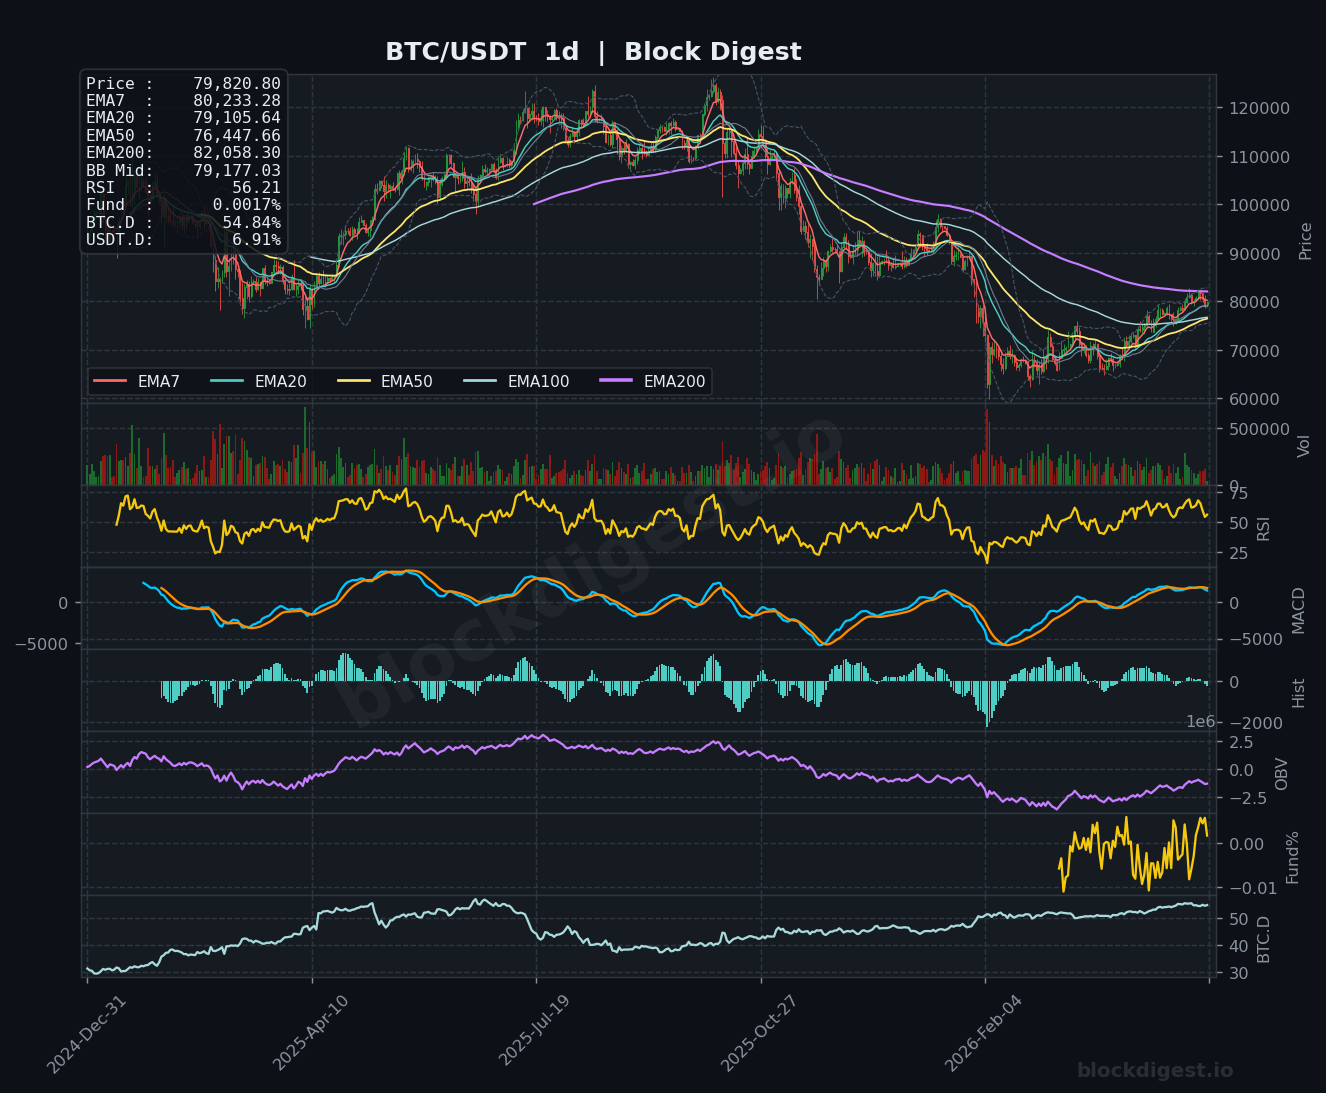
Bitcoin is currently trading at $79,820, positioned precariously below the critical $80,000 psychological level following today’s hotter-than-expected U.S. PPI data. On the daily timeframe, price remains trapped below a declining EMA200 ($82,058) and is testing the EMA50 ($76,447) as immediate support, with the Bollinger Band midline at $79,177 providing additional confluence. The dominant trend structure shows bearish pressure building, as BTC trades below its shorter-term moving averages on the 1h and 4h charts while attempting to stabilize near the daily EMA7 ($80,233). The recent rejection from the $82,500 resistance zone and subsequent breakdown below $80,000 confirms the market’s fragile state amid macro headwinds.
Multi-Timeframe Confluence
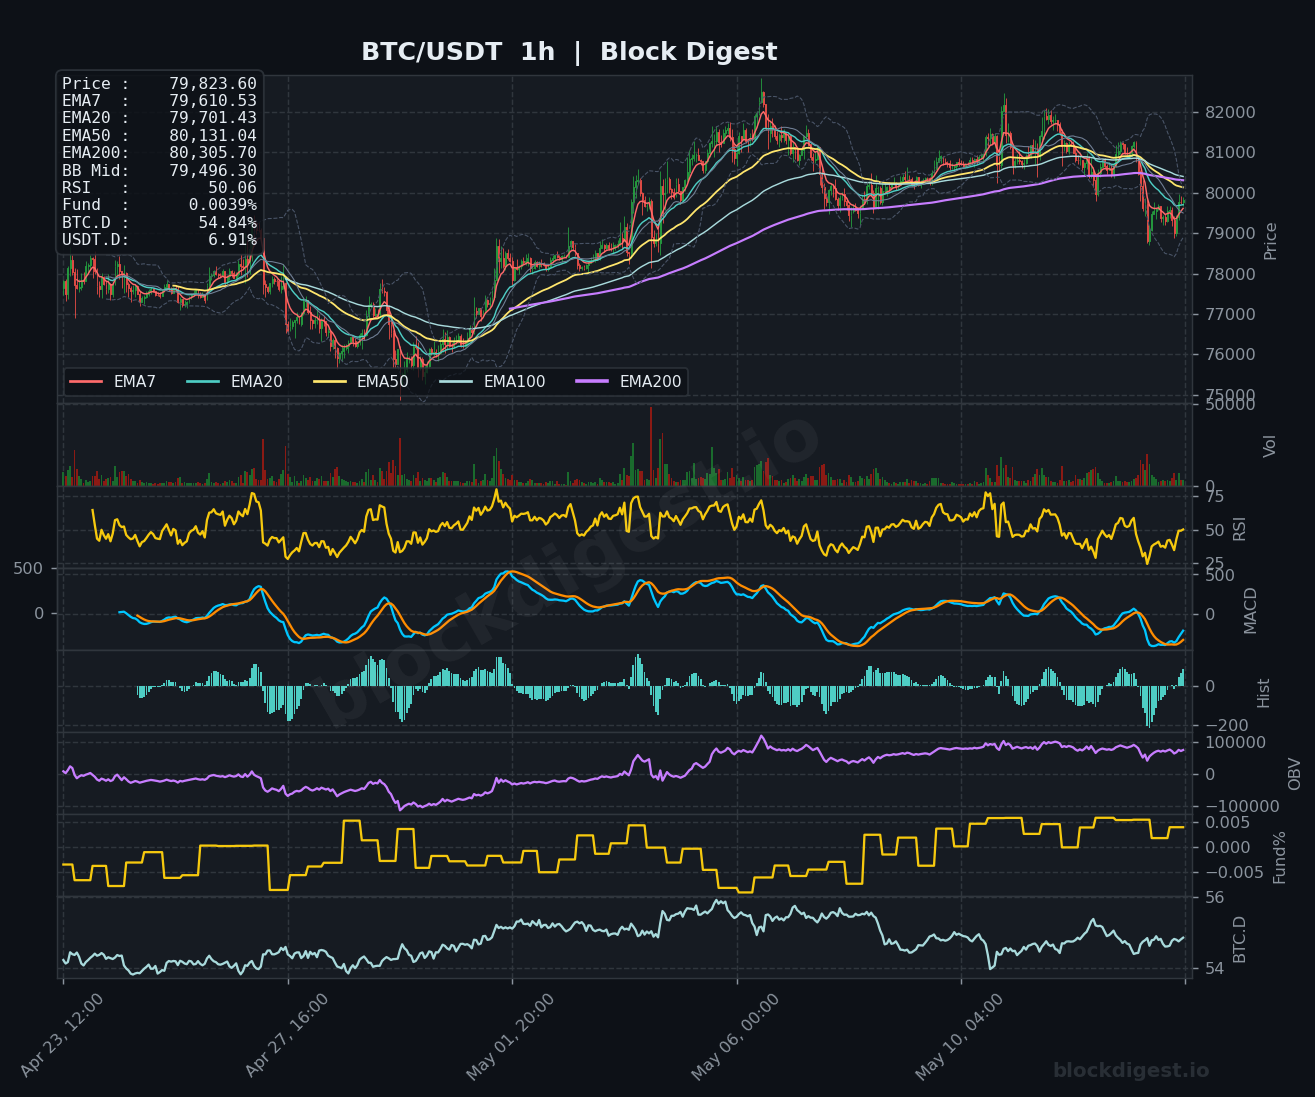
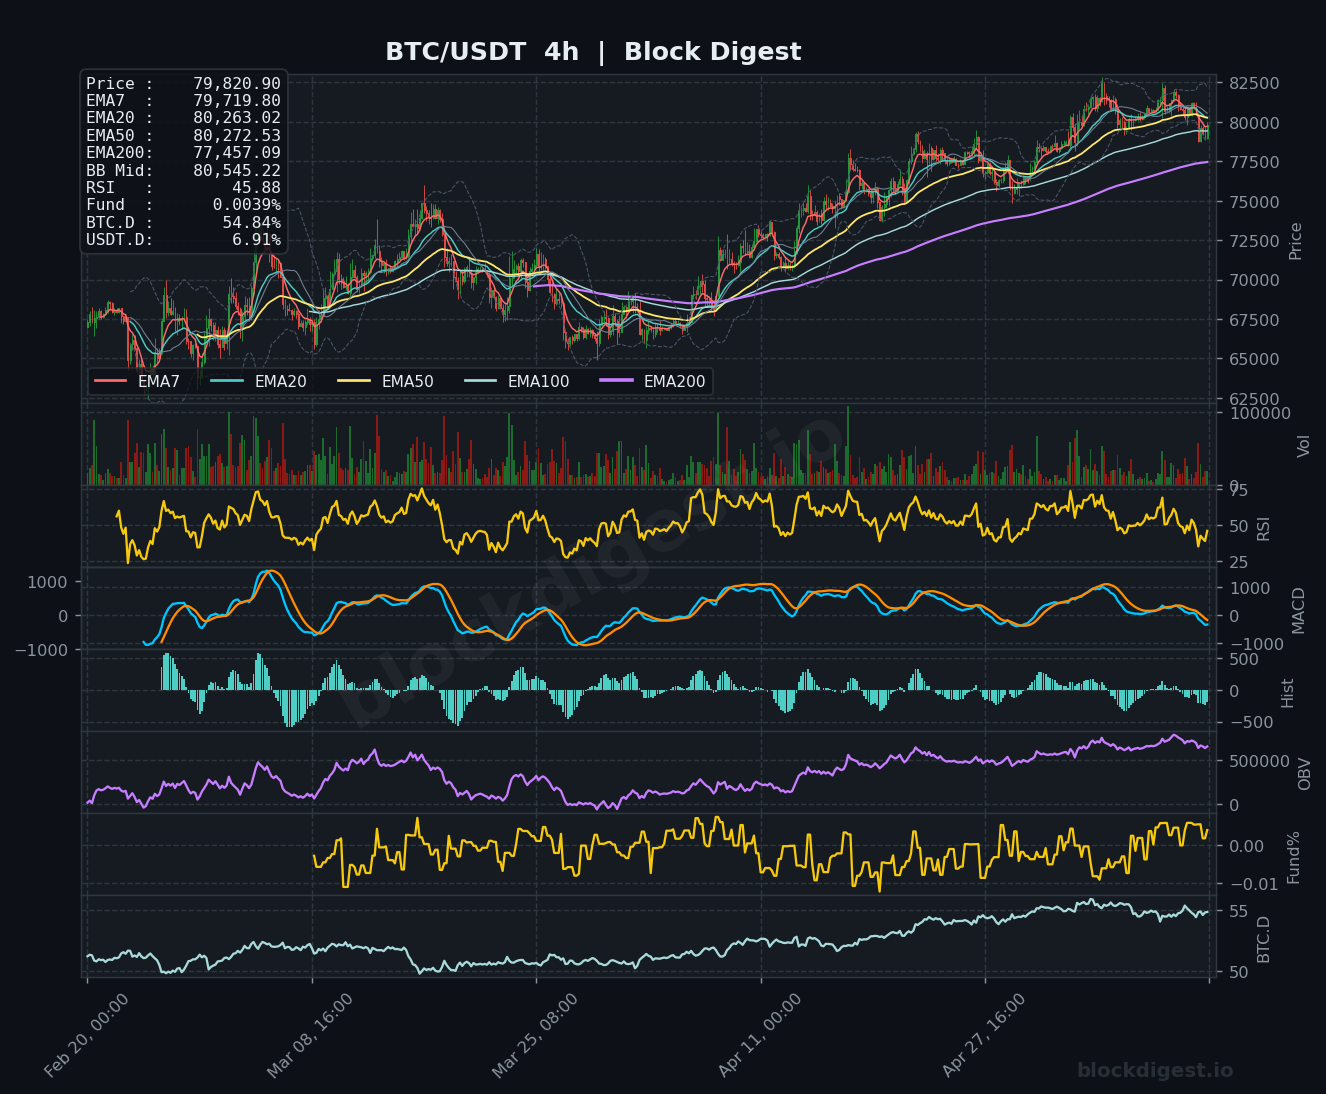
Cross-timeframe analysis reveals deteriorating technical conditions with limited bullish support. The 1h chart shows price trading below all major EMAs (7/20/50/200), with the EMA death cross pattern intact and price compressed near the lower Bollinger Band ($79,496), suggesting oversold conditions but no reversal confirmation yet. The 4h timeframe mirrors this bearish structure, with price recently breaking below the EMA50 ($80,272) and now testing the EMA200 ($77,457) as the next significant support level. The daily chart provides the clearest perspective: BTC remains in a broader corrective phase, trading below the EMA200 and struggling to reclaim the EMA20 ($79,105), though the EMA50 at $76,447 has held as a floor multiple times. The alignment of resistance at $80,000-$80,500 across all timeframes creates a formidable barrier that must be reclaimed to invalidate the near-term bearish bias.
Key Levels to Watch
Resistance:
- $80,000-$80,500: Critical psychological level coinciding with the 4h EMA50 ($80,272), 1h EMA200 ($80,305), and daily EMA7 ($80,233). This zone represents the immediate bull/bear battleground and must be reclaimed for any sustainable recovery attempt.
- $82,000-$82,500: Major resistance cluster containing the daily EMA200 ($82,058), 4h resistance from recent swing highs, and the upper boundary of the current range. This level capped the most recent rally attempt and aligns with institutional supply.
- $84,000-$85,000: The ultimate resistance zone that would confirm trend reversal, marked by previous local highs and the 1d Bollinger Band upper limit, requiring substantial momentum to reach.
Support:
- $79,100-$79,500: Immediate support zone comprised of the daily EMA20 ($79,105), 1h Bollinger Band midline ($79,496), and current price consolidation area. A breakdown here opens the path to deeper retracement.
- $76,400-$77,500: Critical support confluence featuring the daily EMA50 ($76,447) and 4h EMA200 ($77,457). This zone has historically provided strong buying interest and represents the last line of defense before capitulation.
- $74,000-$75,000: Final major support from previous consolidation lows visible on the daily chart. A breach of this level would signal a return to deeper bearish market structure.
Momentum & On-Chain Signals
Momentum indicators across timeframes paint a concerning picture with slight oversold divergences emerging. The 1h RSI sits at 50.06, having bounced from oversold territory below 30 earlier, suggesting temporary exhaustion of selling pressure but no clear bullish momentum buildup. The 4h RSI at 45.88 remains below the neutral 50 level, confirming sustained bearish control, while the daily RSI at 56.21 shows resilience above midpoint but trending lower from the 70+ overbought readings seen at recent peaks. The MACD on all timeframes shows bearish crossovers with negative histogram readings, particularly pronounced on the 4h where the lines have crossed below zero, signaling continued downside momentum. OBV trends reveal concerning distribution patterns, with declining volume on the daily chart indicating smart money liquidation during recent bounces. The Funding Rate at 0.0039% (1h) and 0.001% (1d) remains marginally positive but compressed, suggesting balanced positioning with no excessive leverage on either side—a condition that often precedes volatility expansion.
BTC Dominance & Market Sentiment
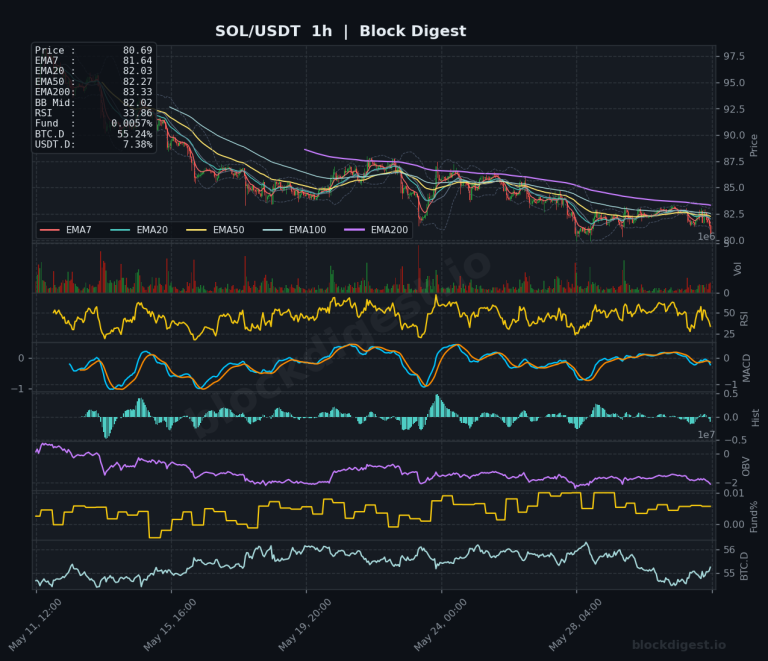
Bitcoin Dominance stands at 54.84%, maintaining elevated levels that suggest continued flight-to-quality dynamics within the crypto market, with capital concentrated in BTC rather than flowing into altcoins during this period of macro uncertainty. USDT Dominance at 6.91% remains relatively stable but elevated compared to risk-on environments, indicating defensive positioning and reduced appetite for speculative assets. The combination of high BTC.D and elevated USDT.D reflects a market in preservation mode rather than expansion, where investors prefer Bitcoin’s relative safety over altcoins but remain cautious enough to hold significant stablecoin reserves. This configuration typically persists during consolidation or corrective phases and would require both metrics to shift—BTC.D declining as capital rotates to alts and USDT.D dropping as stablecoin holders deploy capital—to signal renewed risk appetite and bullish market structure.
Risk Scenarios
Bullish case: A decisive reclaim of $80,500 with sustained 4h closes above this level, accompanied by RSI breaking above 50 on the 4h timeframe and MACD histogram turning positive, would confirm short-term bullish reversal and target the $82,000-$82,500 resistance zone. Successful breach of $82,500 with increasing OBV would open the path toward $84,000-$85,000, particularly if supported by improving macro sentiment and declining USDT dominance indicating capital deployment.
Bearish case: Failure to reclaim $80,000 followed by a breakdown below $79,100 support with increasing volume would activate downside targets toward $76,400-$77,500, where the daily EMA50 and 4h EMA200 converge. A decisive breach of $76,400 on elevated selling volume with RSI on the daily dropping below 50 would signal deeper correction toward $74,000-$75,000, potentially accelerated by cascading liquidations if leveraged positions remain concentrated at these levels.
Outlook
Bitcoin’s technical structure remains under pressure following today’s inflation-driven selloff, with price action now firmly centered on the $80,000 reclamation battle. The near-term bias leans cautiously bearish while below $80,500, with the path of least resistance pointing toward a test of the $76,400-$77,500 support zone unless bulls can engineer a swift recovery above the EMA cluster resistance. Critical triggers for the next 24-48 hours include sustained closes above or below the $79,500-$80,000 range, MACD crossover attempts on the 4h timeframe, and any shifts in funding rates that would indicate positioning changes. The $80,500 level represents the line in the sand—reclaim it decisively to invalidate the bearish thesis, or fail and expect continuation toward lower support zones as macro uncertainty from rising oil prices and inflation concerns weighs on risk assets.
Disclaimer: This analysis is for informational purposes only and does not constitute financial advice. Cryptocurrency markets are highly volatile and unpredictable. All trading decisions should be made based on your own research and risk tolerance. Block Digest is not responsible for any financial losses incurred as a result of acting on this content.