Altcoin Daily Analysis — May 10, 2026
Altcoin Daily Roundup – May 10, 2026
Market Context
The altcoin market is displaying mixed technical signals as Bitcoin dominance hovers around 54.85%, suggesting a relatively neutral environment for altcoin performance. USDT dominance at 6.83% indicates moderate risk appetite, with capital neither aggressively flowing into stablecoins nor exiting en masse. This creates a selective environment where individual coin fundamentals and technical setups matter more than broad sector momentum.
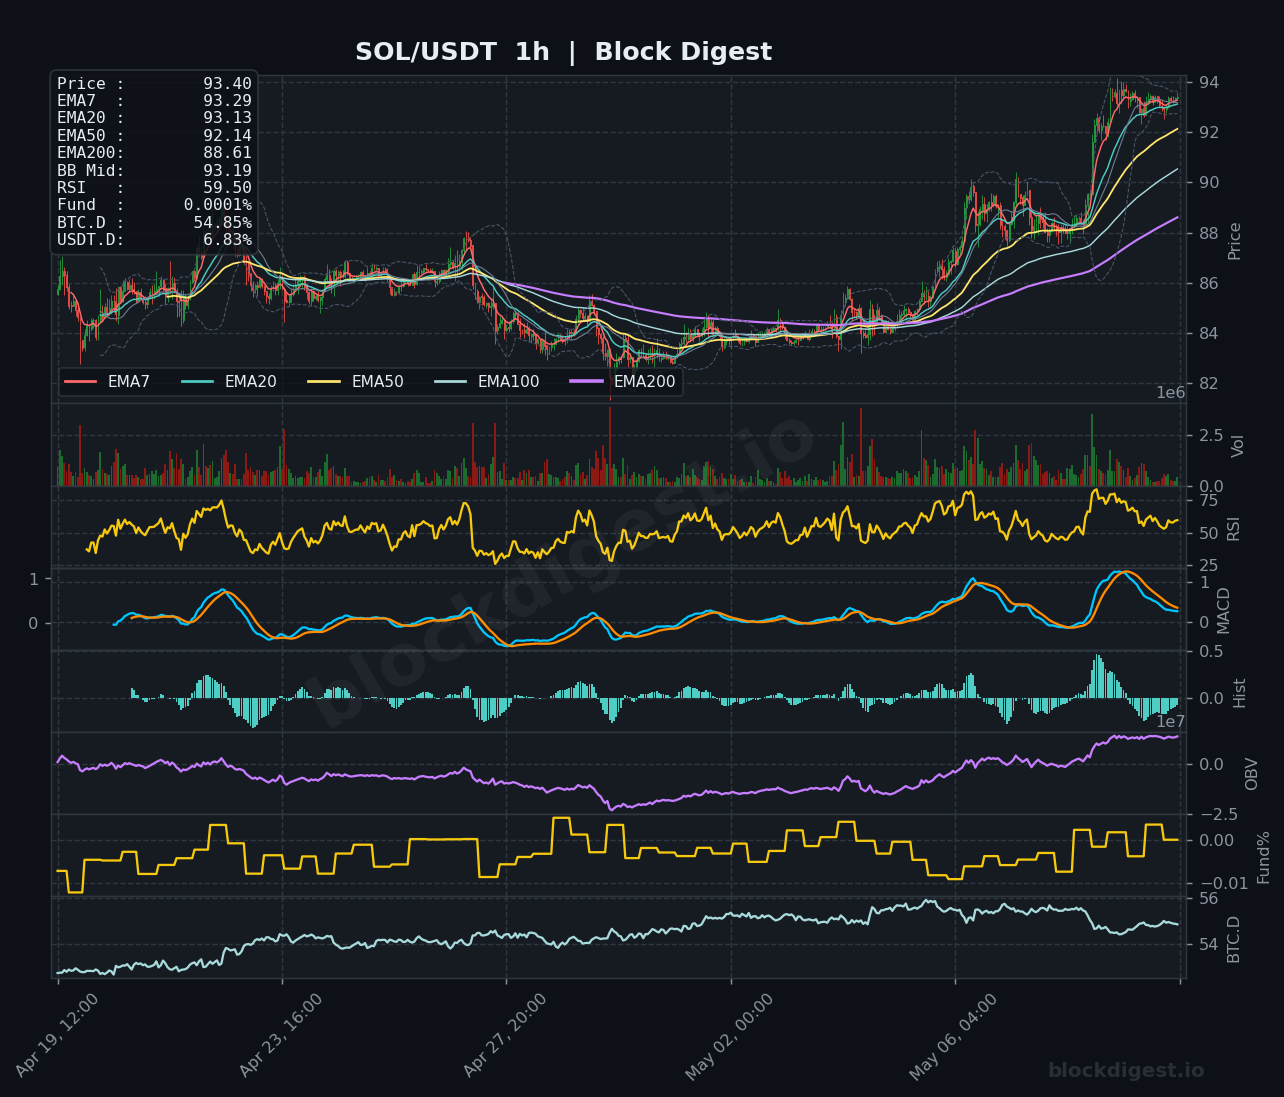
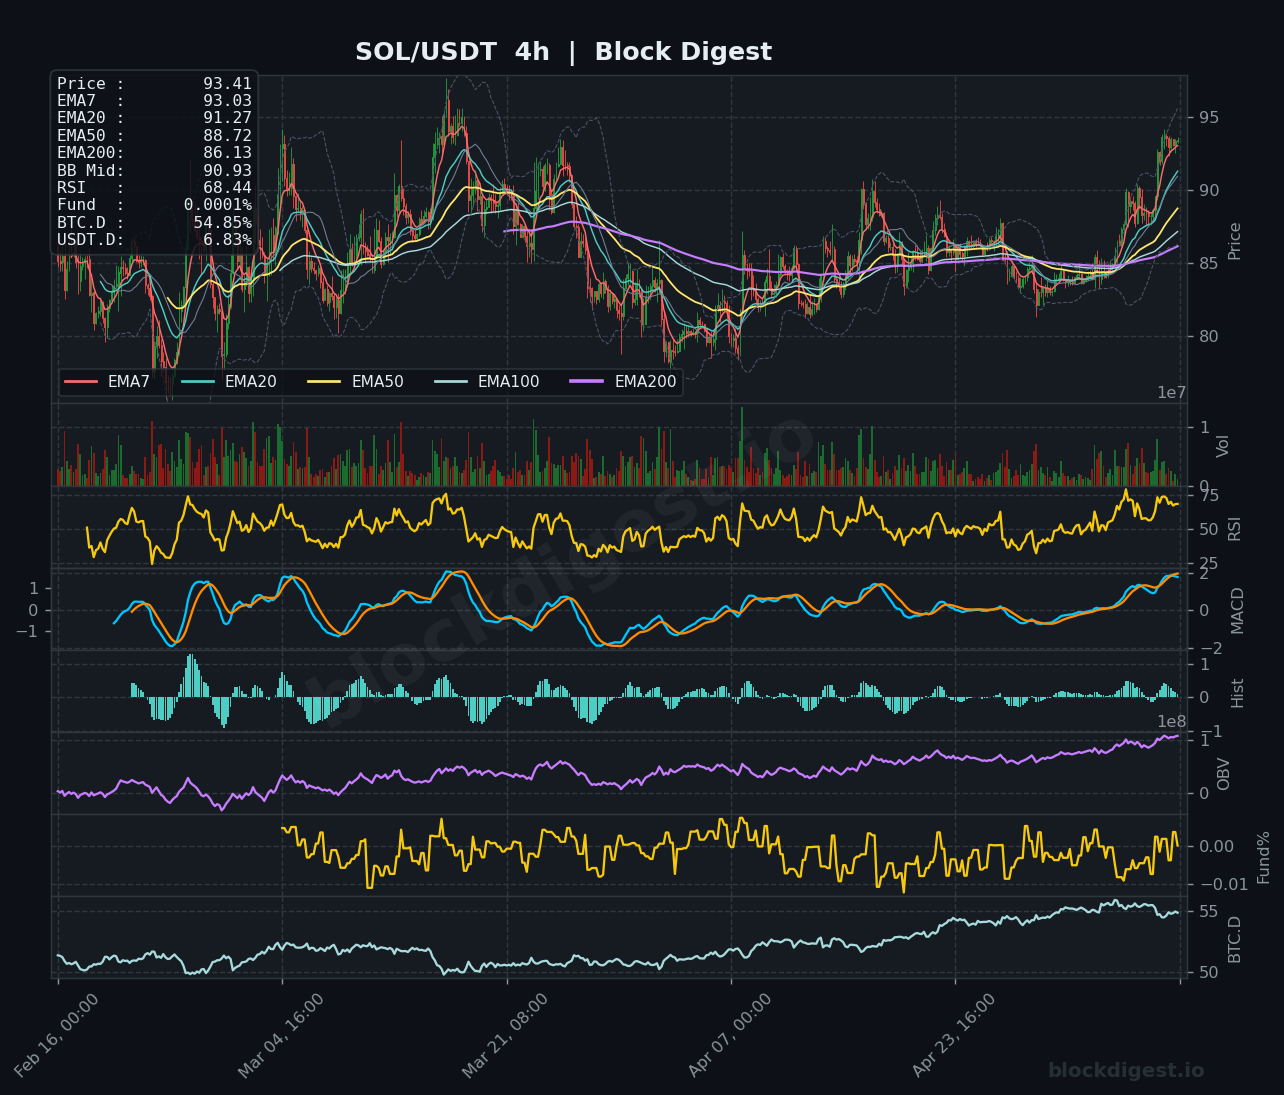
Solana (SOL)
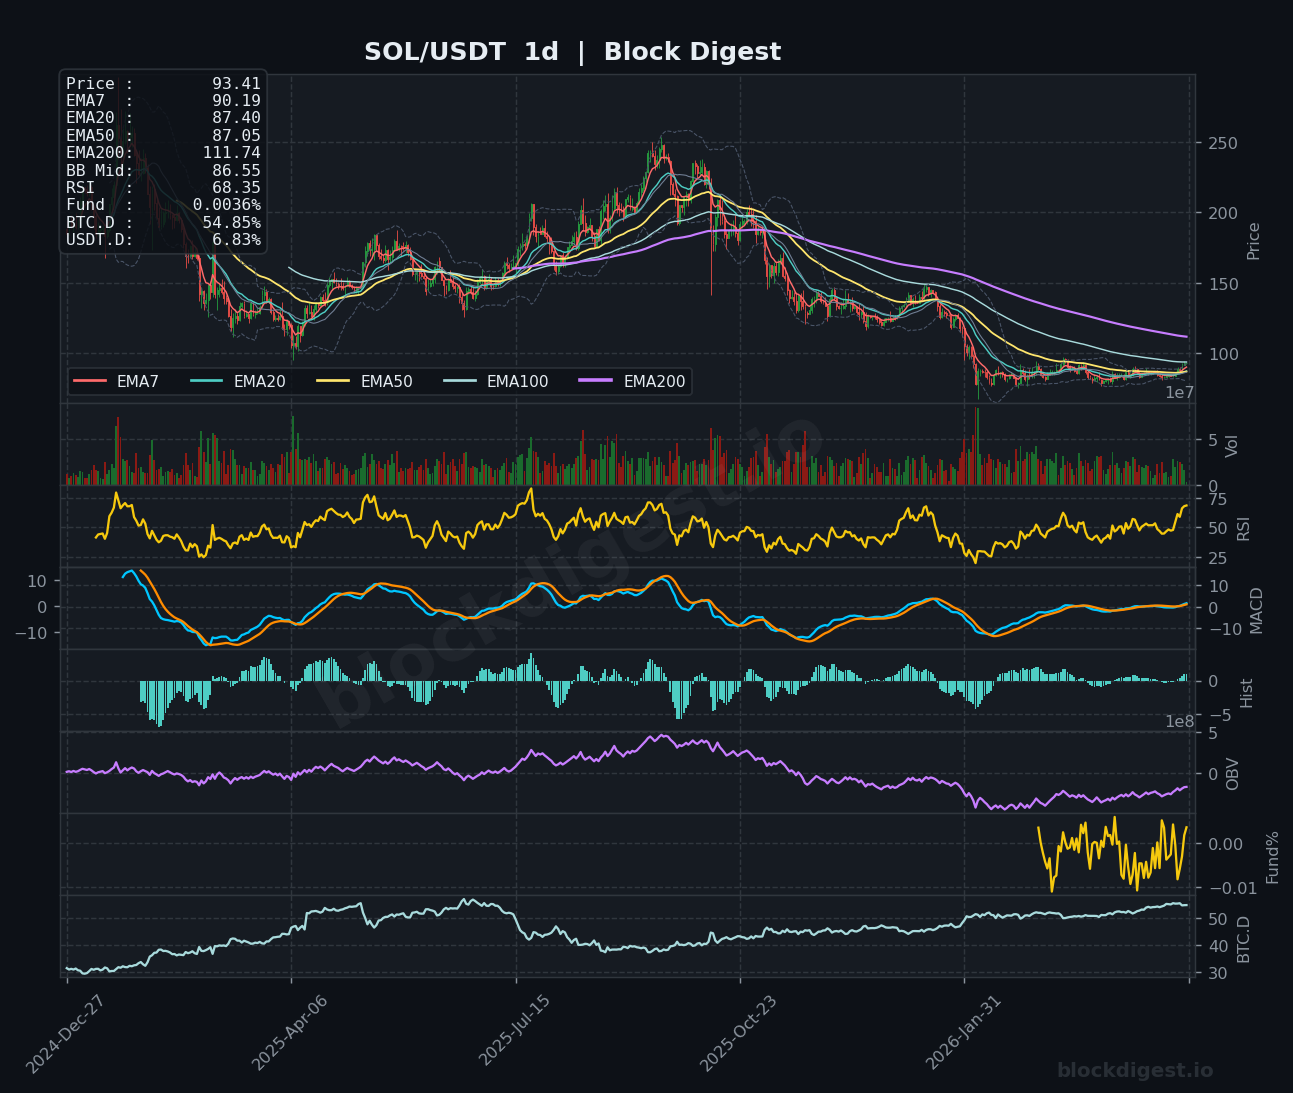
Solana trades at $93.41, showing impressive short-term recovery after breaking above all major moving averages on the 1-hour and 4-hour timeframes. Price has reclaimed the $93 level with the EMA7 ($90.19) now providing dynamic support, while the daily chart reveals the token is attempting to establish a base after a prolonged downtrend from January highs. The RSI readings of 59.50 (1h) and 68.44 (4h) suggest bullish momentum without reaching overbought extremes, though the daily RSI at 68.35 warrants caution. The MACD has crossed positively on lower timeframes, confirming strengthening momentum, with immediate resistance at $94-95 and critical support at the $88-90 zone.
XRP (XRP)
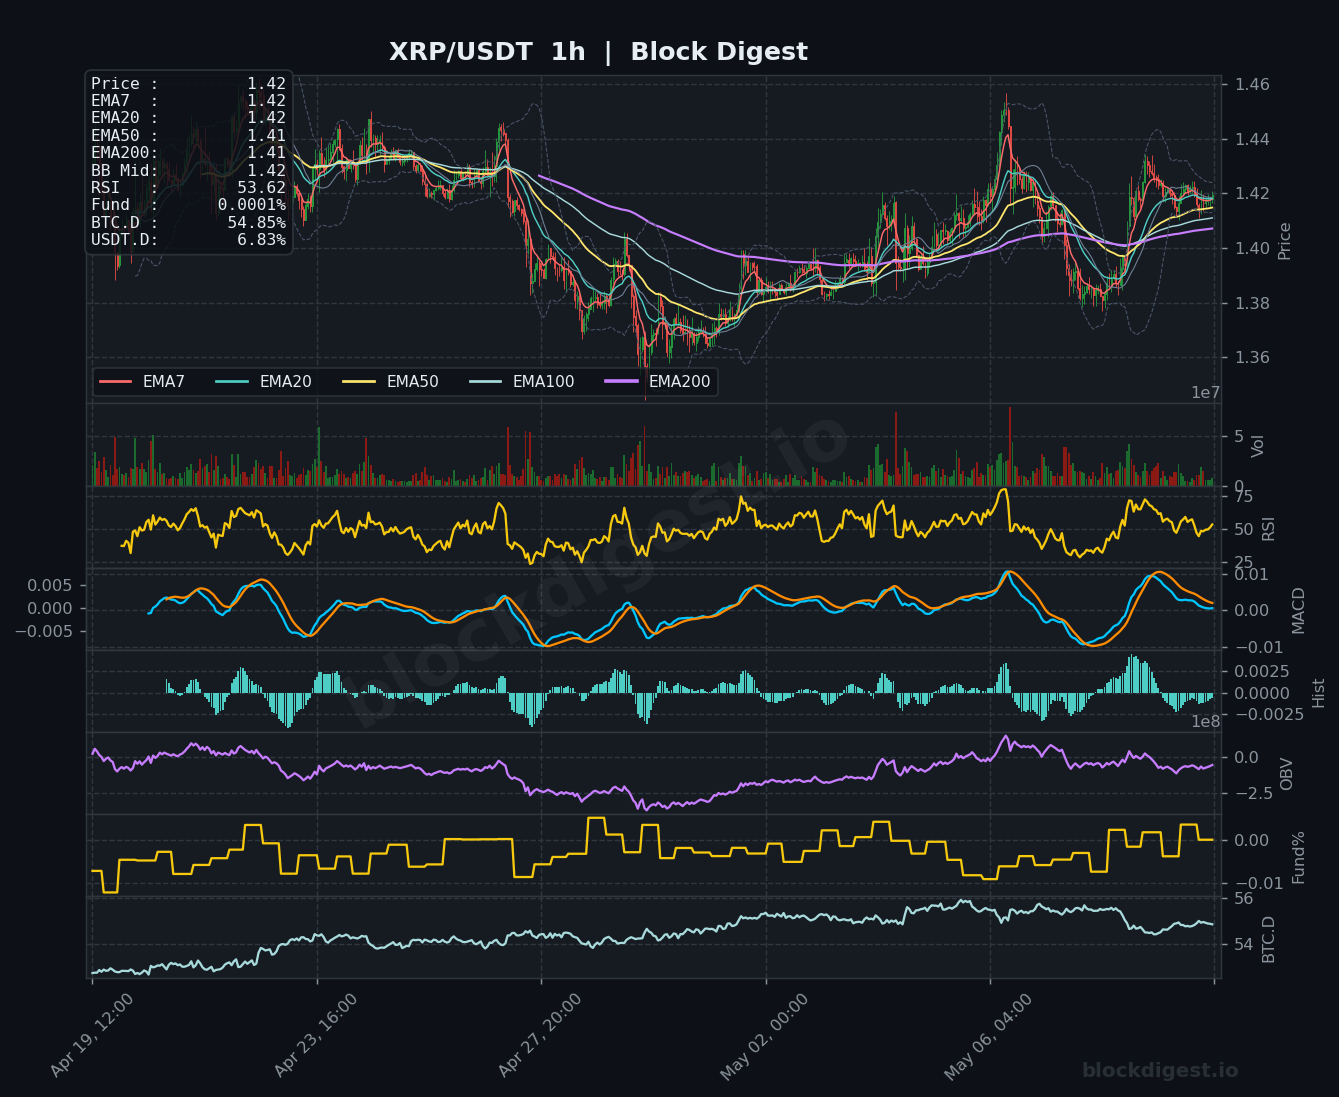
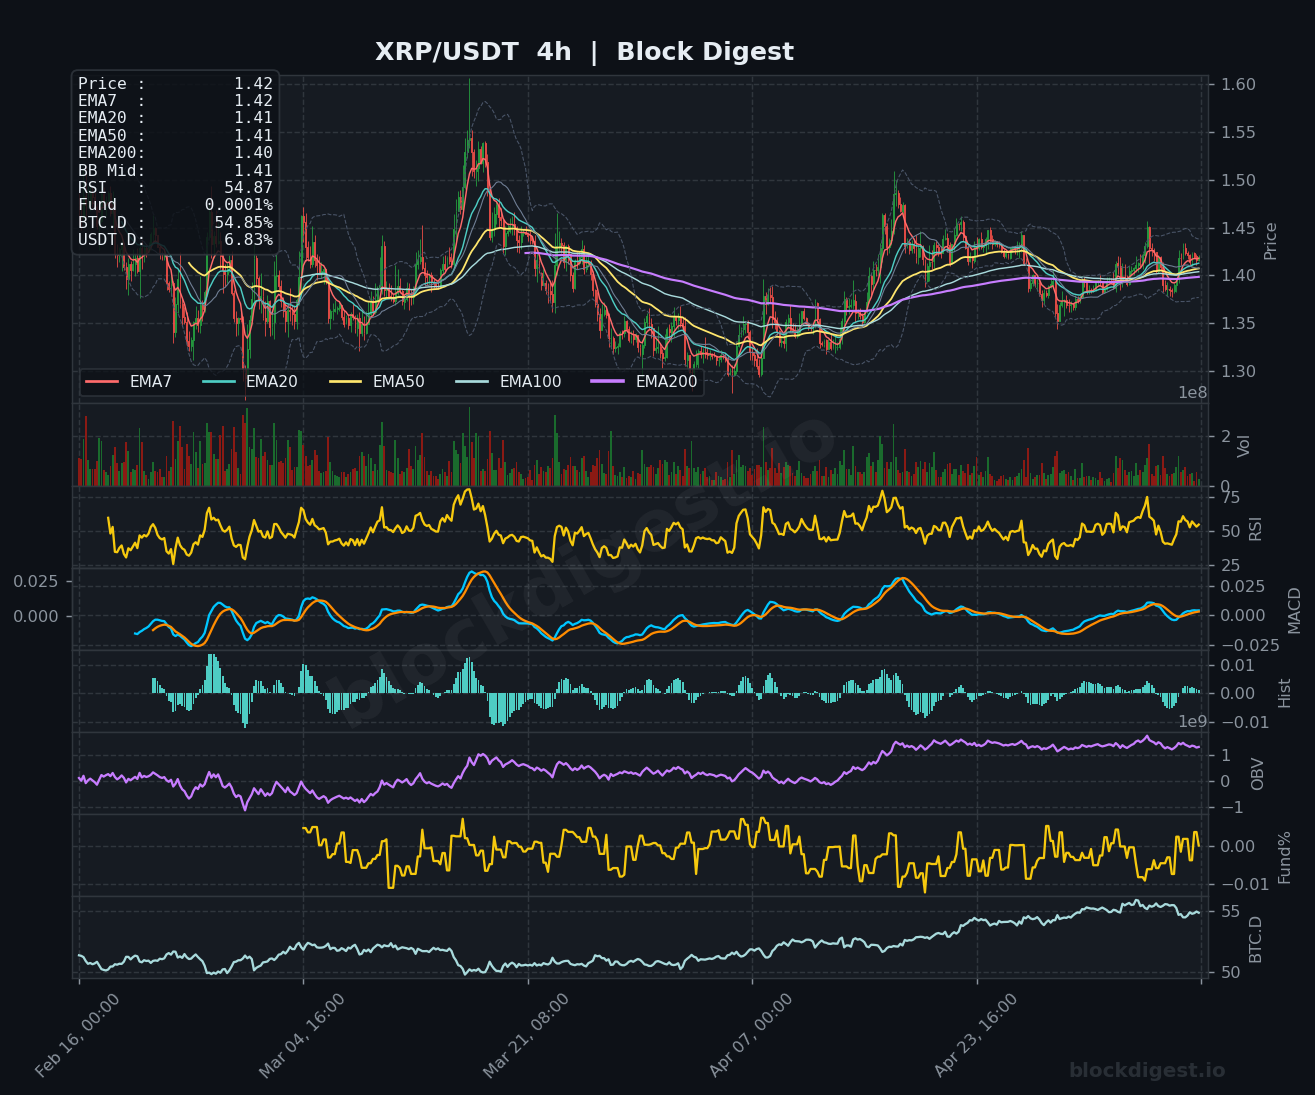
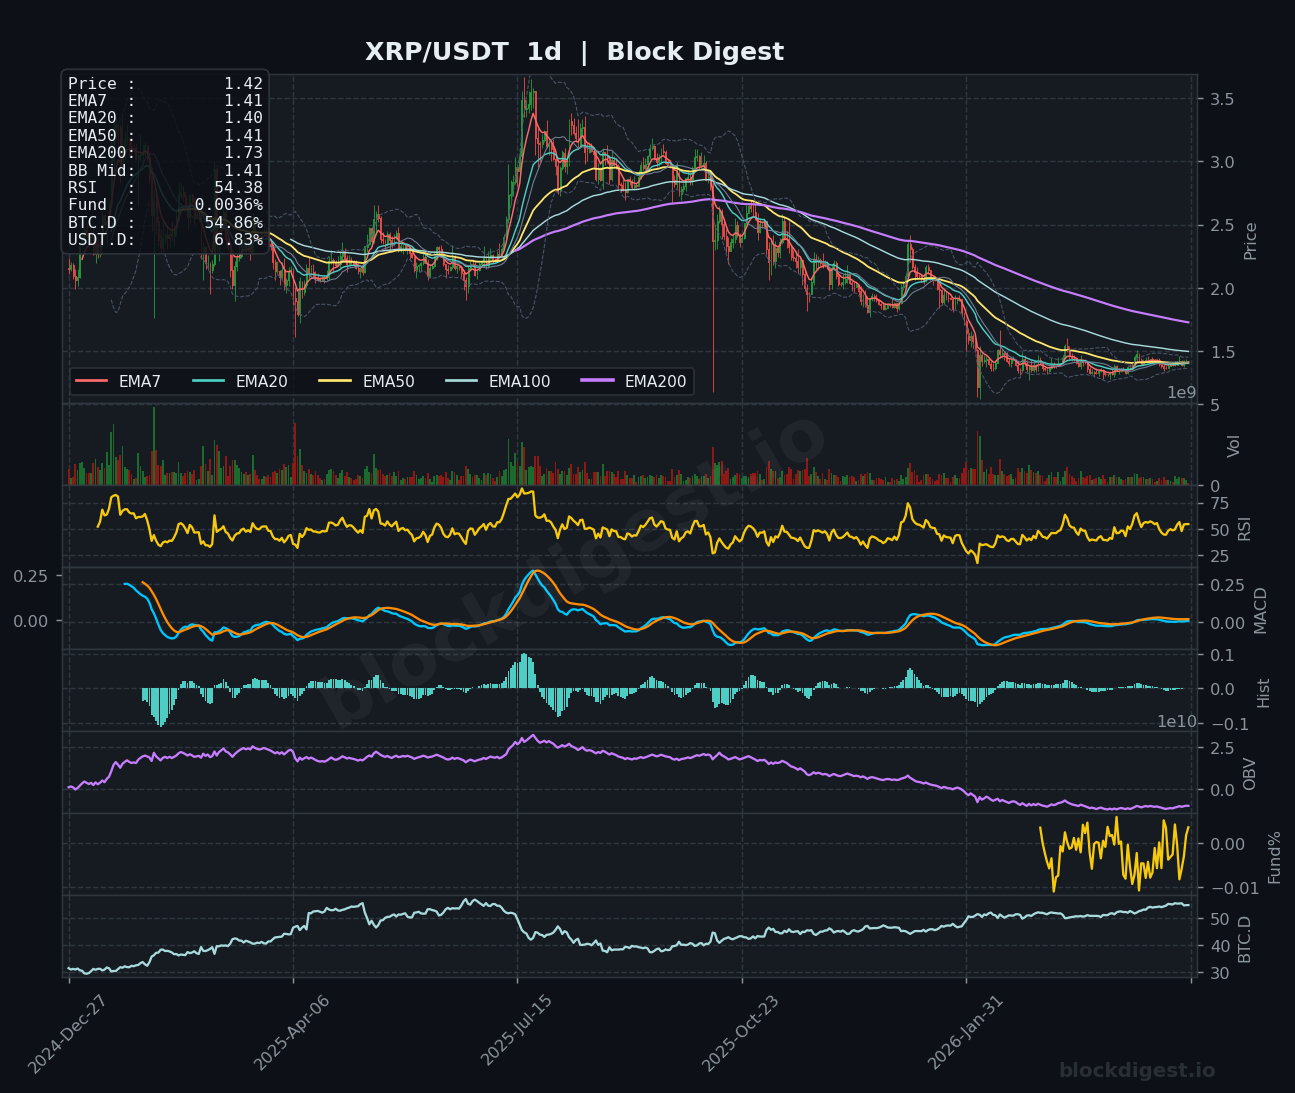
XRP consolidates at $1.42, trapped in a tight range as price action coils between converging moving averages across all timeframes. The token faces significant overhead resistance from the EMA200 at $1.43 on shorter timeframes, while the daily chart shows price struggling beneath a downtrending EMA200 at $1.73. RSI readings hover in neutral territory (53.62 on 1h, 54.87 on 4h, 54.38 on 1d), indicating neither buyers nor sellers have established dominance. MACD remains flat near the zero line across all timeframes, reflecting the current indecision. A decisive break above $1.45 could trigger momentum toward $1.50, while failure to hold $1.40 may lead to a retest of $1.35 support.
BNB (BNB)
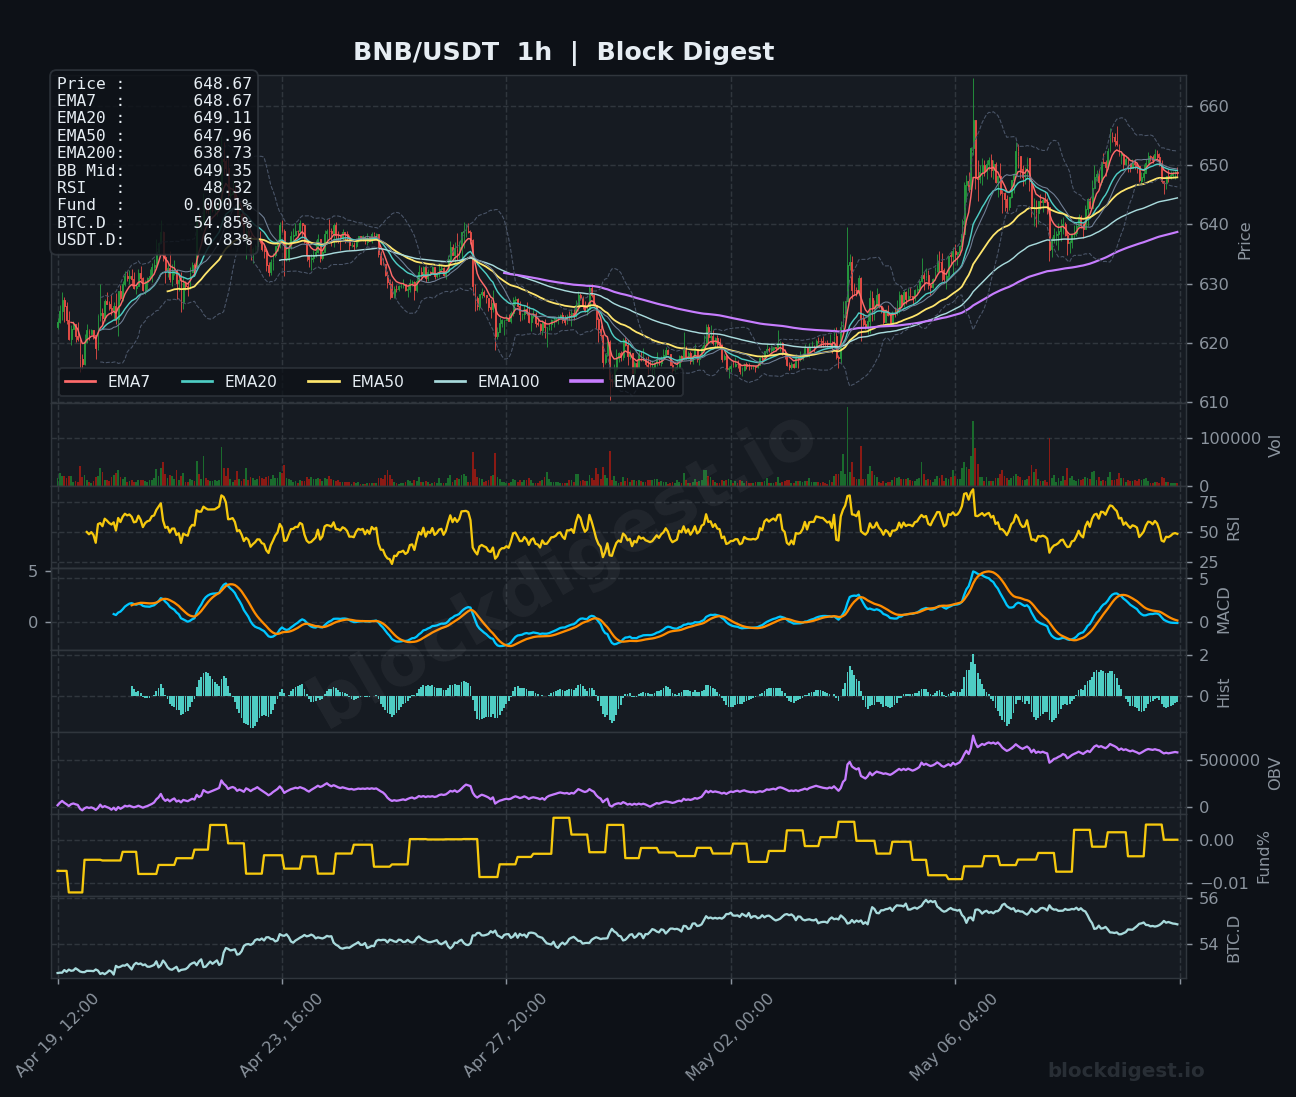
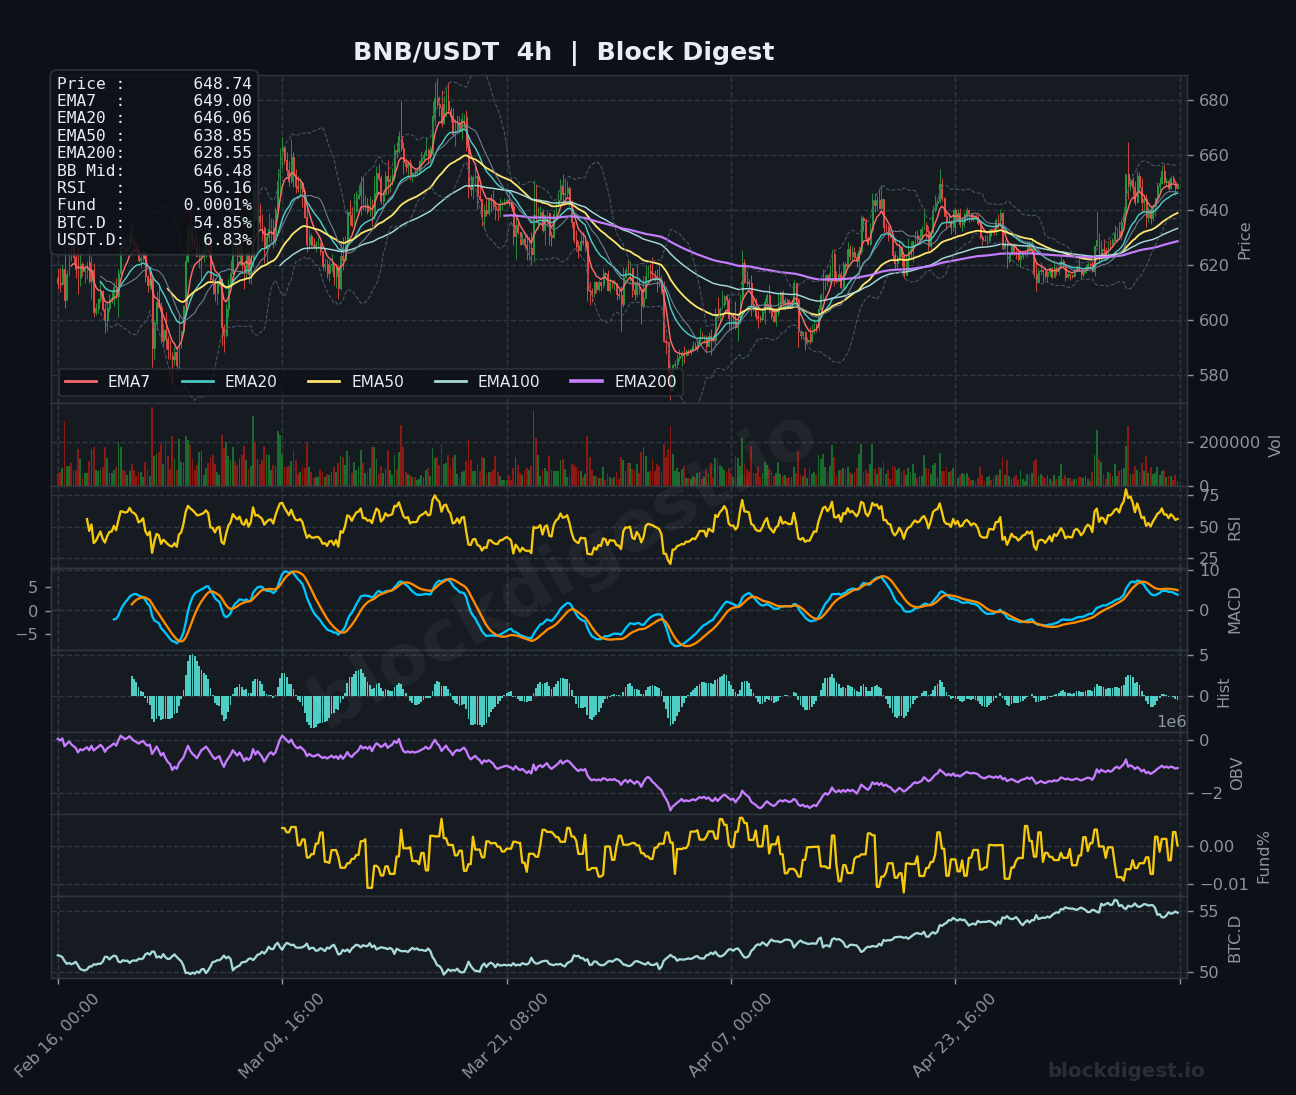
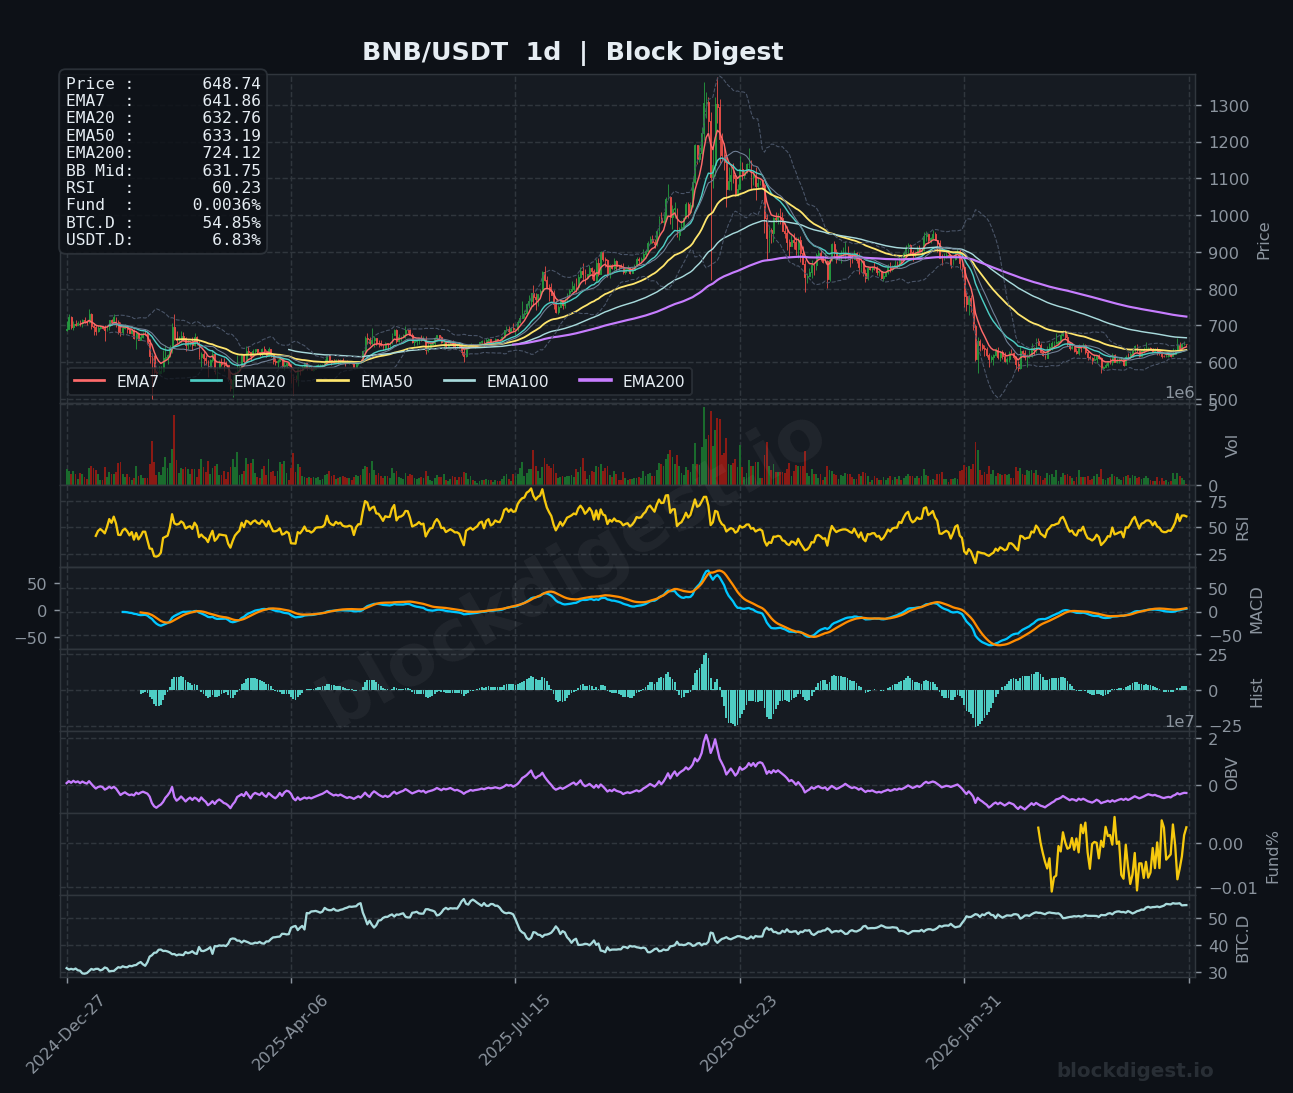
BNB trades at $648.74, demonstrating relative strength with price comfortably above the EMA50 on all timeframes and maintaining proximity to key moving averages. The token has established a tight consolidation pattern on the 1-hour chart with the Bollinger Bands contracting, suggesting an imminent volatility expansion. RSI readings are subdued at 48.32 (1h) and 56.16 (4h), providing room for upside movement before reaching overbought conditions, while the daily RSI at 60.23 remains constructive. The MACD shows a recent bullish crossover on the 4-hour chart, with histogram bars expanding positively. Immediate resistance lies at $660, with support firmly established at $640, and the broader daily structure suggests potential for a move toward $680-700 if current support holds.
Dogecoin (DOGE)
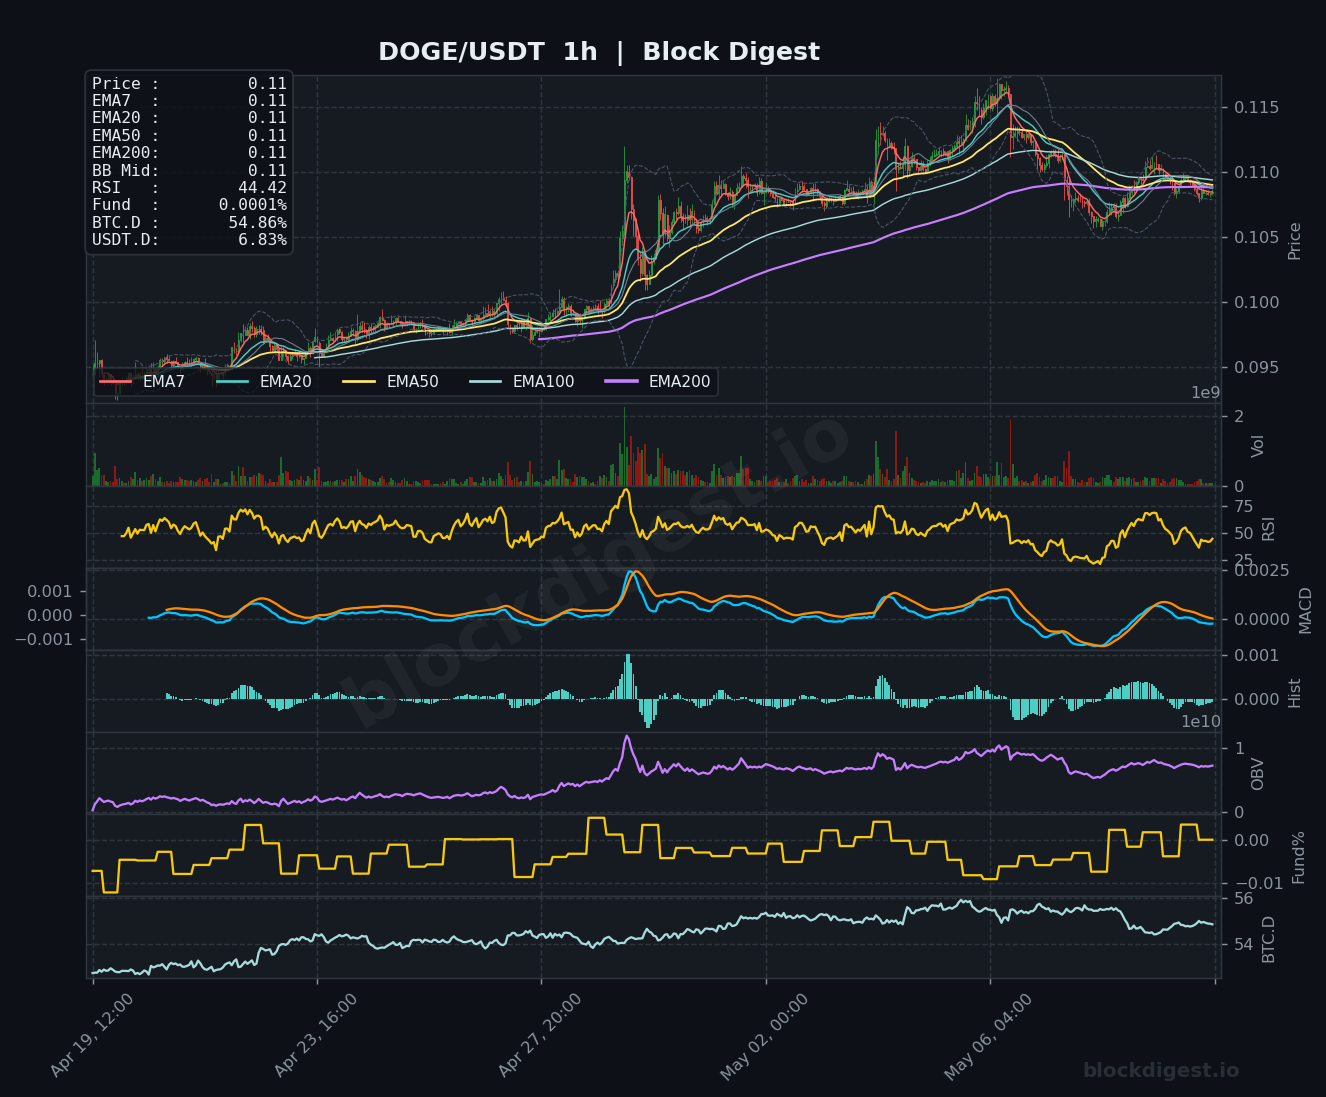
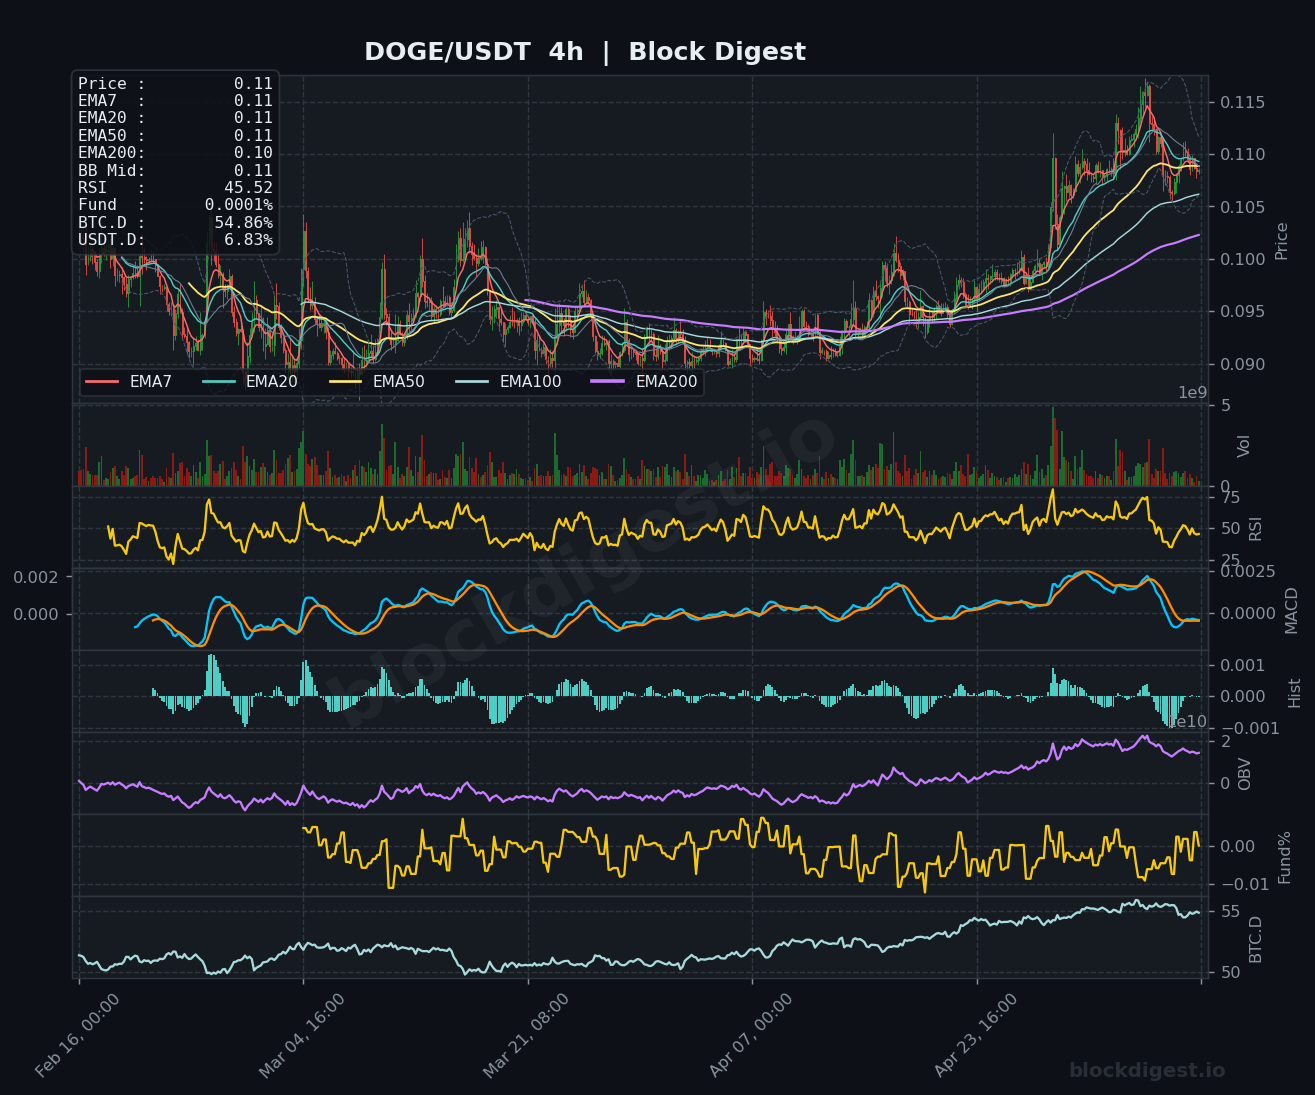
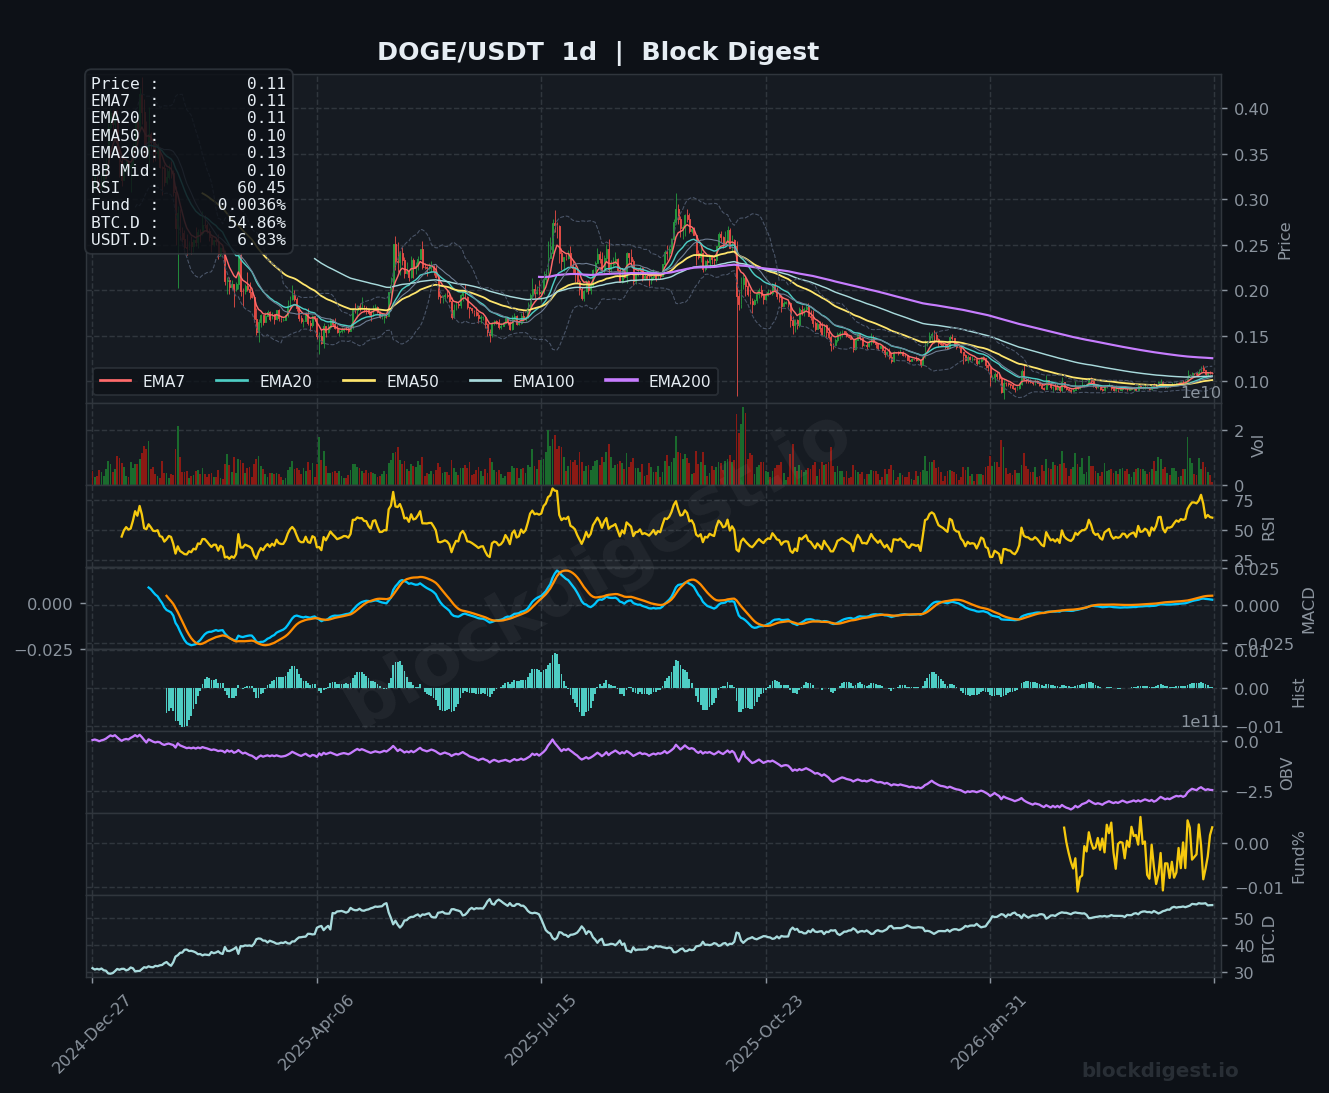
Dogecoin trades at $0.11, displaying a concerning loss of momentum after failing to sustain levels above $0.115. The 1-hour and 4-hour charts show price compression beneath all major moving averages, with EMAs converging in a tight band indicating directional uncertainty. RSI has declined to 44.42 (1h) and 45.52 (4h), entering bearish territory and suggesting selling pressure is building, while the daily RSI at 60.45 remains elevated due to the longer-term rally. The MACD has crossed bearish on the 1-hour timeframe with expanding negative histogram bars, signaling deteriorating short-term momentum. Critical support at $0.108 must hold to prevent a deeper correction toward $0.105, while bulls need to reclaim $0.112 to stabilize the structure.
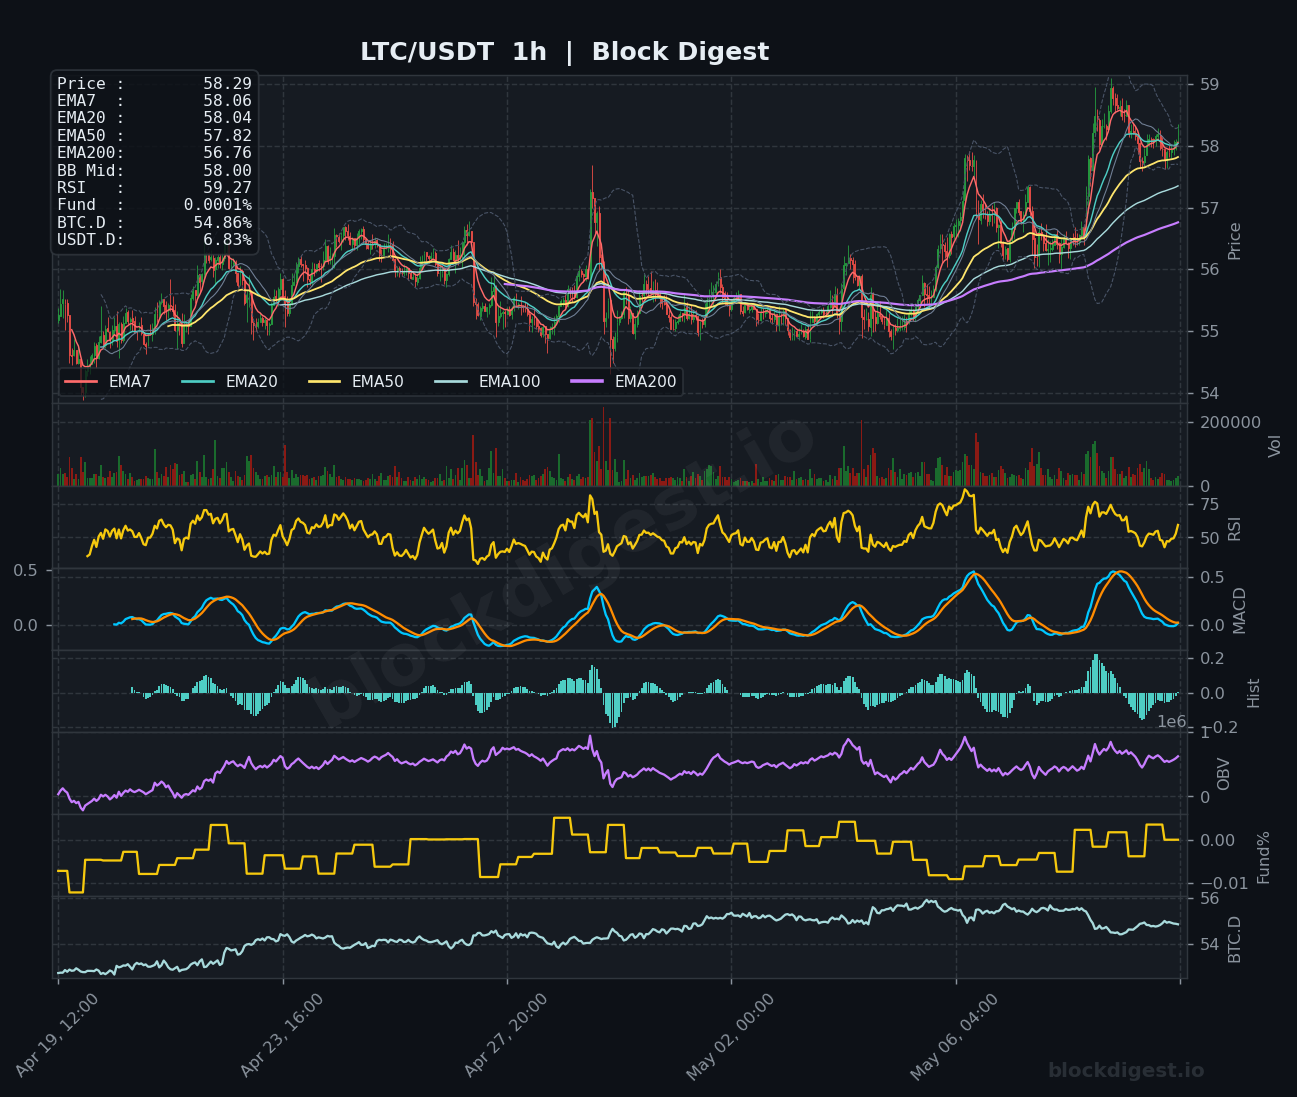
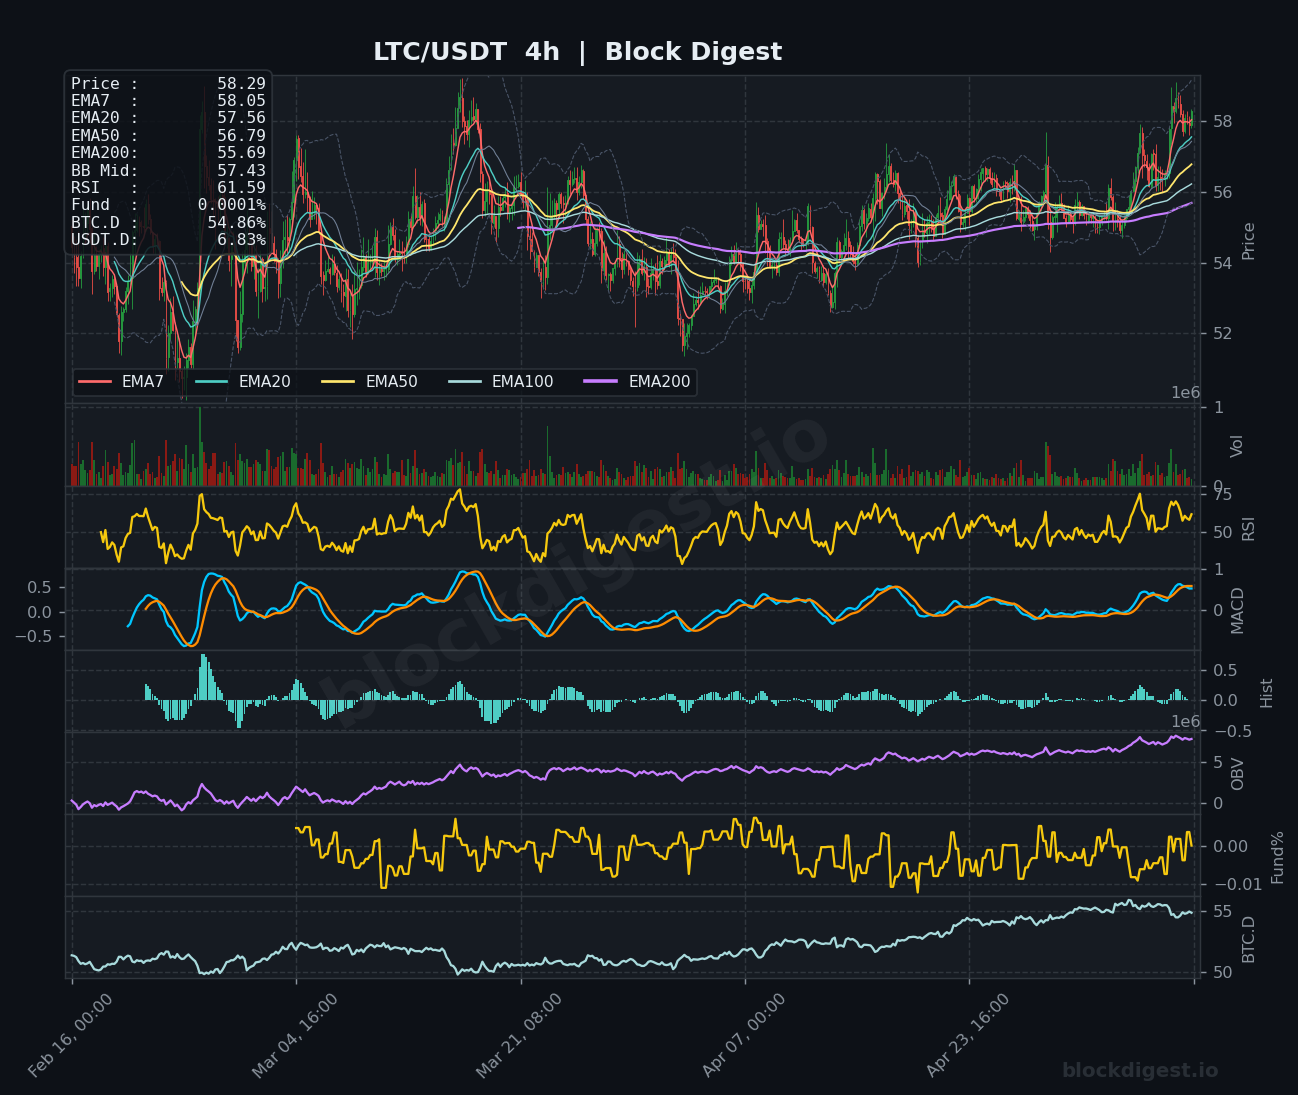
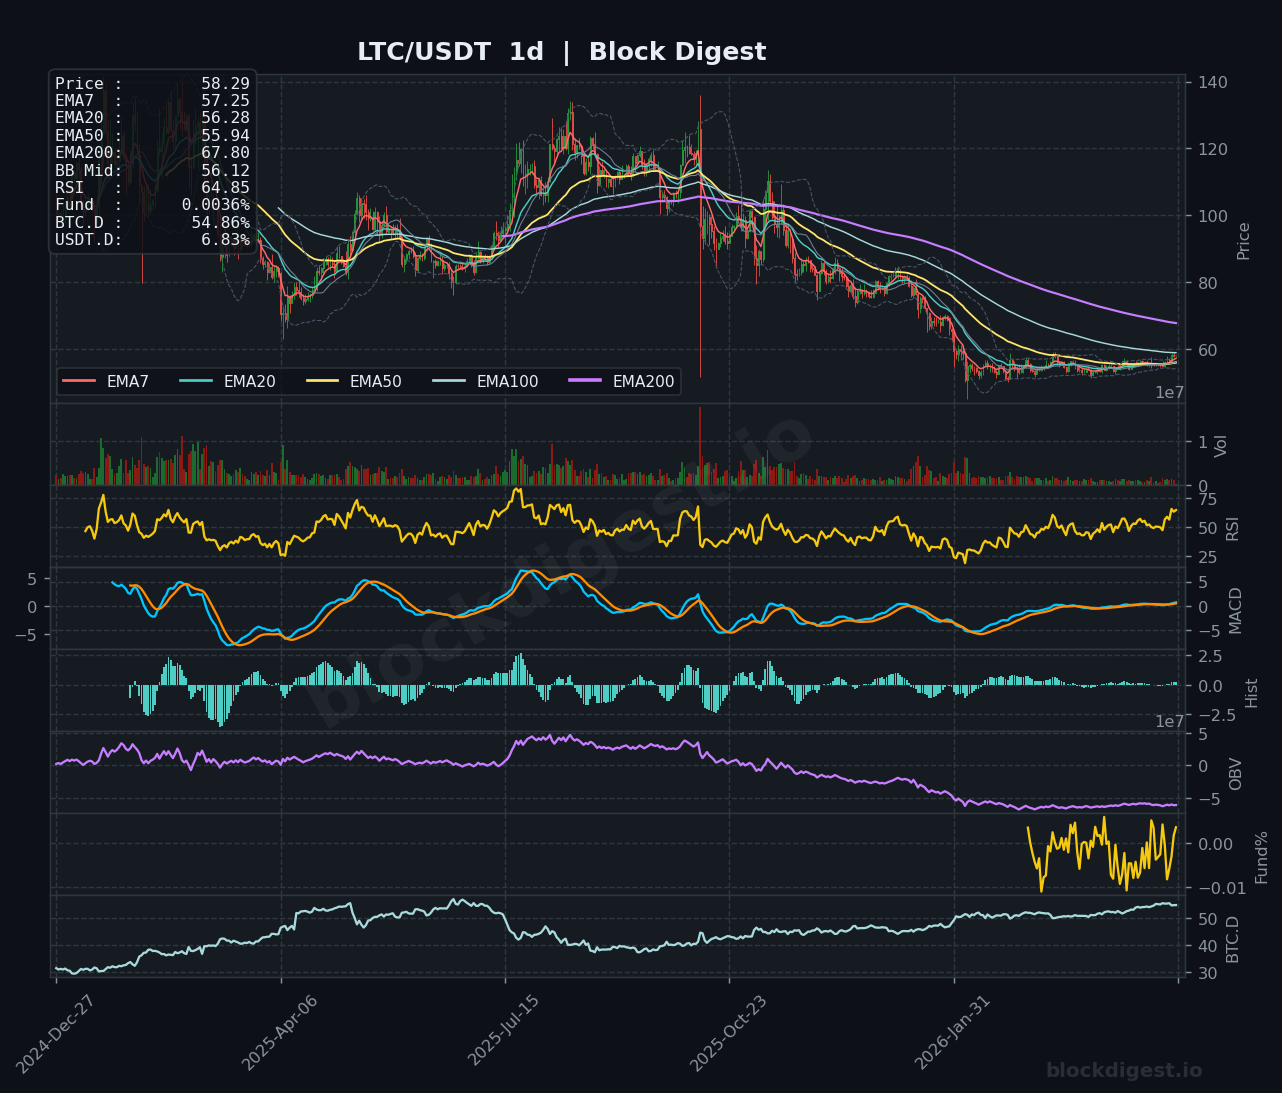
Litecoin (LTC)
Litecoin trades at $58.29, maintaining a resilient position above the critical $57-58 support zone across all timeframes. The coin shows price respecting a rising trendline on the 4-hour chart, with EMAs providing layered support beneath current levels. RSI readings of 59.27 (1h) and 61.59 (4h) indicate healthy bullish momentum without extreme readings, though the daily RSI at 64.85 suggests limited room for immediate upside. The MACD remains constructive on the 4-hour timeframe with positive histogram expansion, while the daily MACD shows sustained momentum above the signal line. Litecoin’s technical setup appears favorable with immediate resistance at $59, followed by $60-61, while support strengthens at $57.50, backed by the rising 50-day EMA.
TRON (TRX)
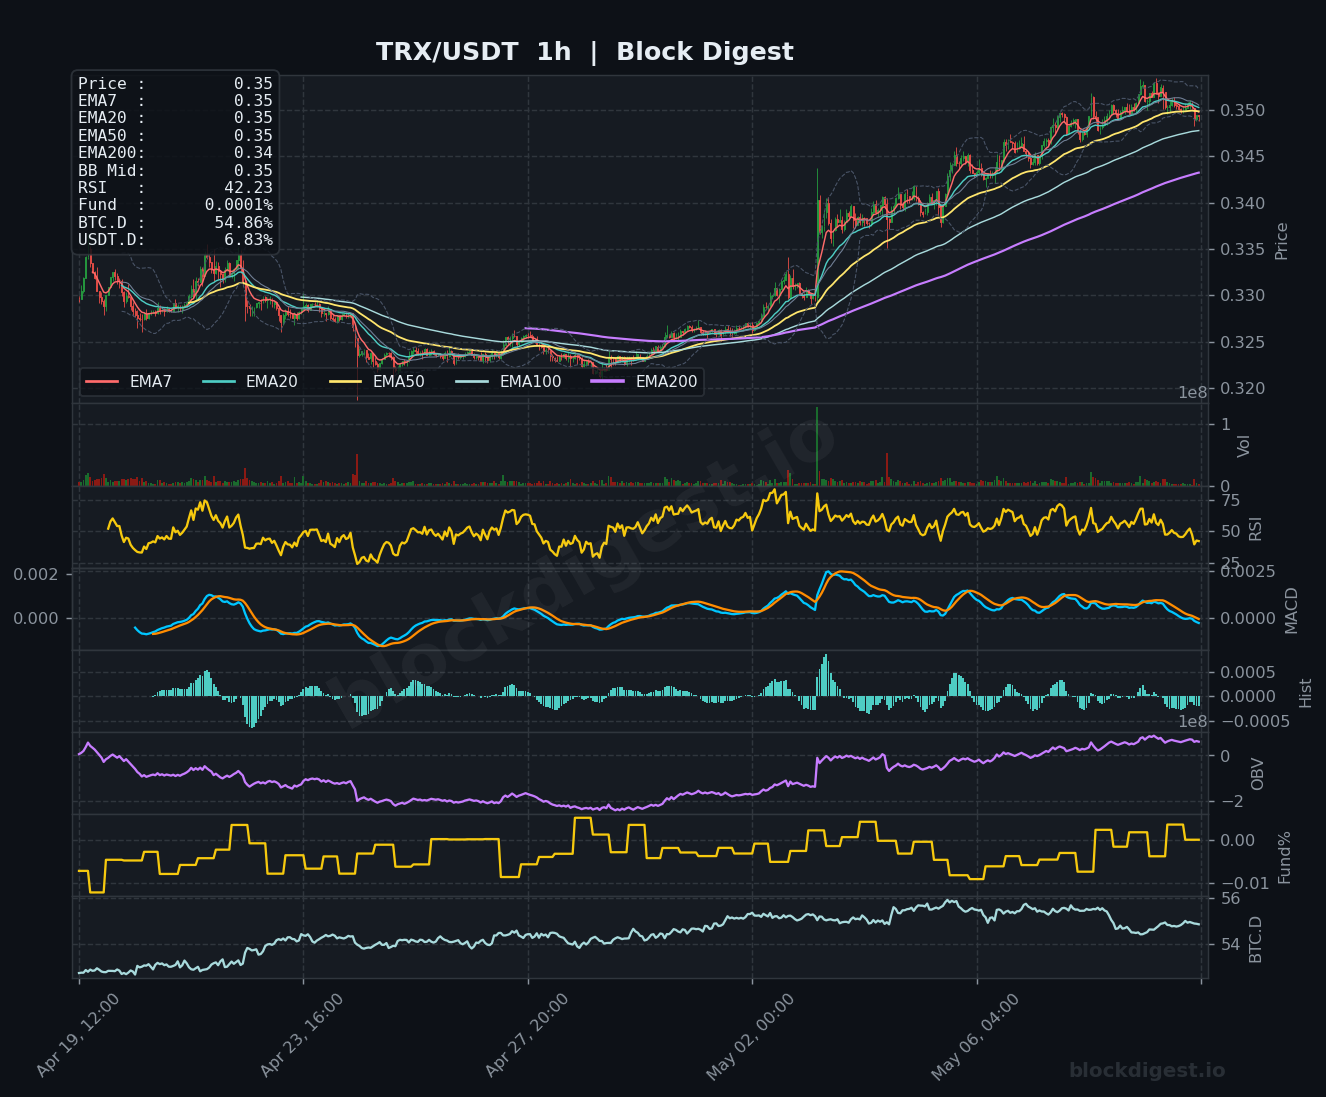
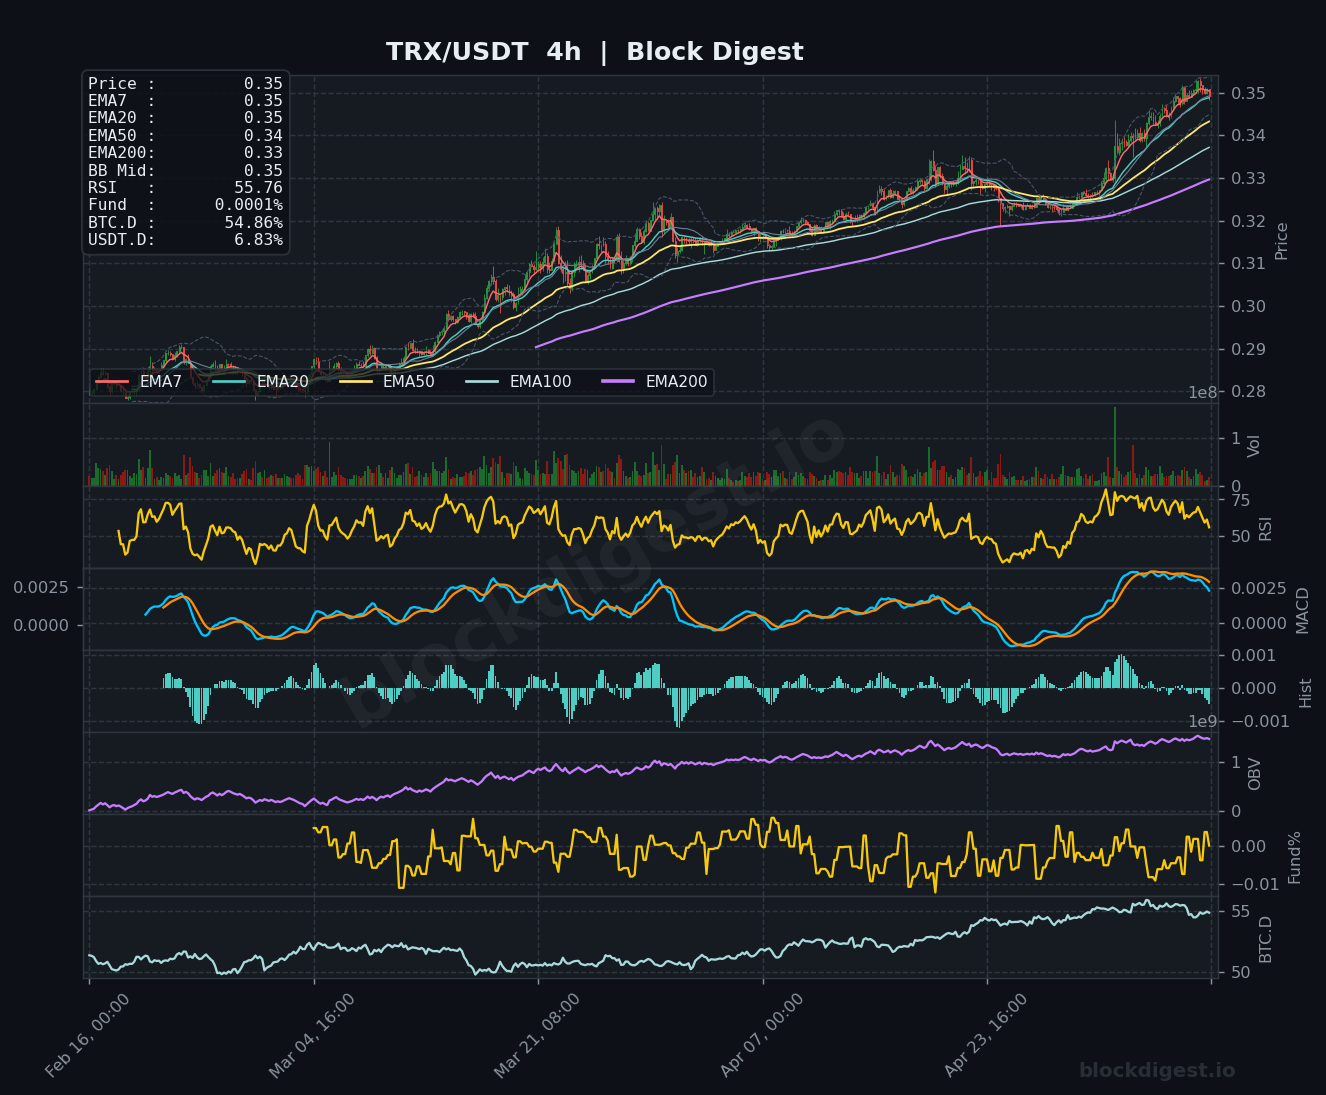
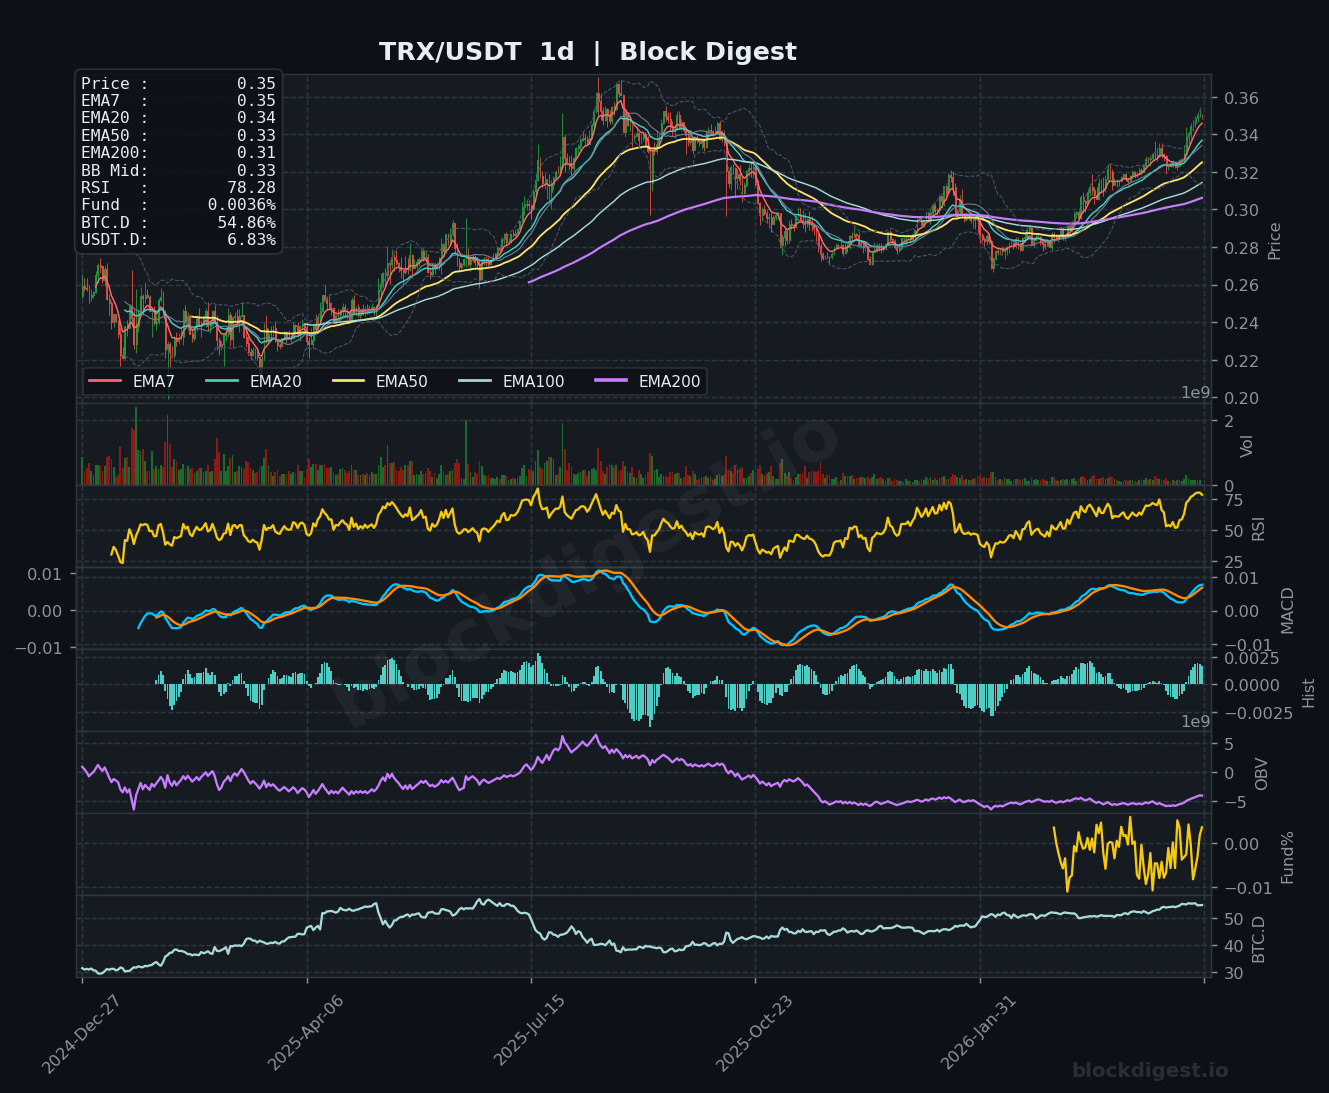
TRON trades at $0.35, exhibiting one of the strongest technical setups among major altcoins with price comfortably above all moving averages on daily timeframes. The 4-hour chart displays a clean uptrend with higher lows and higher highs, supported by a well-structured EMA stack (7>20>50>100>200). RSI at 42.23 (1h) has pulled back from overbought conditions, potentially offering a healthier entry for continuation, while the 4h RSI at 55.76 and daily RSI at 78.28 suggest strong underlying momentum despite extended conditions. The MACD shows a bullish crossover on the 4-hour chart with positive momentum building, and the daily MACD remains in firmly positive territory. Support is established at $0.34-$0.345, with resistance at $0.355-$0.36, and the broader structure suggests TRX is in a sustainable uptrend.
Altcoin Outlook
The altcoin landscape presents a divergent picture, with clear winners and laggerers emerging from recent price action. TRX and LTC demonstrate the strongest technical setups with clean trend structures and favorable momentum indicators, while BNB and SOL show recovery potential if they can maintain recent gains above key support levels. XRP and DOGE appear the most vulnerable, with compressed price action and deteriorating momentum suggesting potential for further downside if critical support zones fail. Market participants should watch BTC dominance closely, as any significant move above 55.5% could pressure altcoin performance, while a decline below 54% might catalyze broader sector strength.
Disclaimer: This analysis is for informational purposes only and does not constitute financial advice. Cryptocurrency markets are highly volatile and unpredictable. All trading decisions should be made based on your own research and risk tolerance. Block Digest is not responsible for any financial losses incurred as a result of acting on this content.