Altcoin Daily Analysis — May 08, 2026
Altcoin Daily Roundup – May 08, 2026
Market Context
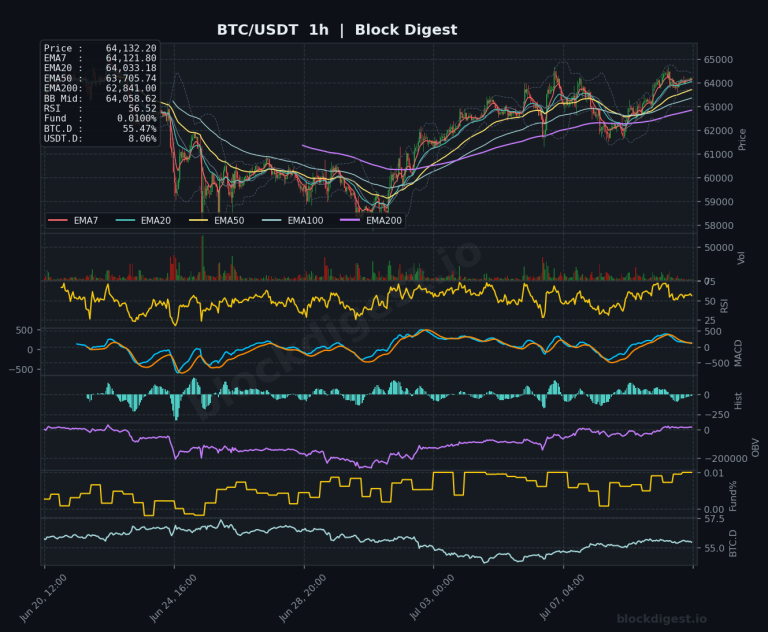
The altcoin market displays mixed technical conditions as Bitcoin dominance holds at 55.48% while USDT.D sits at 6.94%, suggesting moderate stablecoin flows but limited aggressive risk-on appetite. Most major altcoins are trading near critical moving average clusters, with momentum indicators revealing divergent strength across the sector as traders navigate uncertain macro conditions.
Solana (SOL)
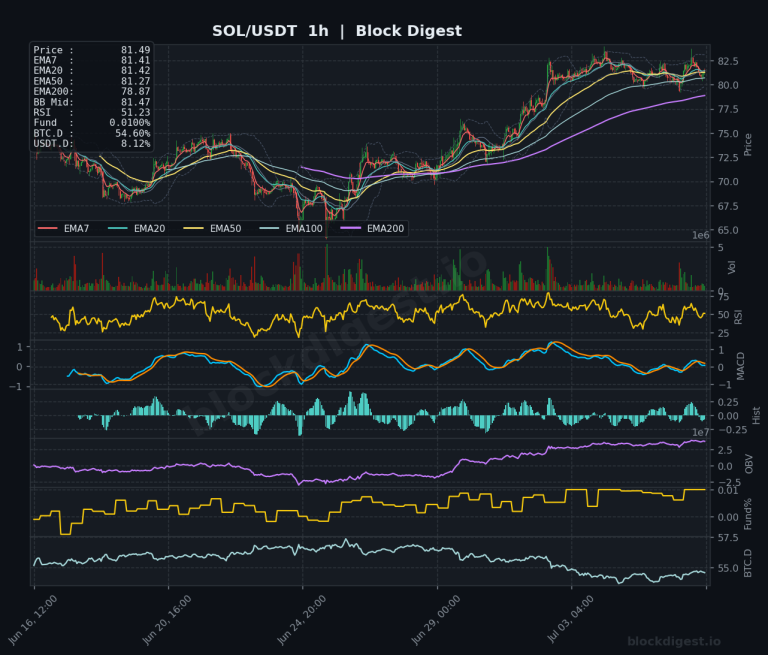
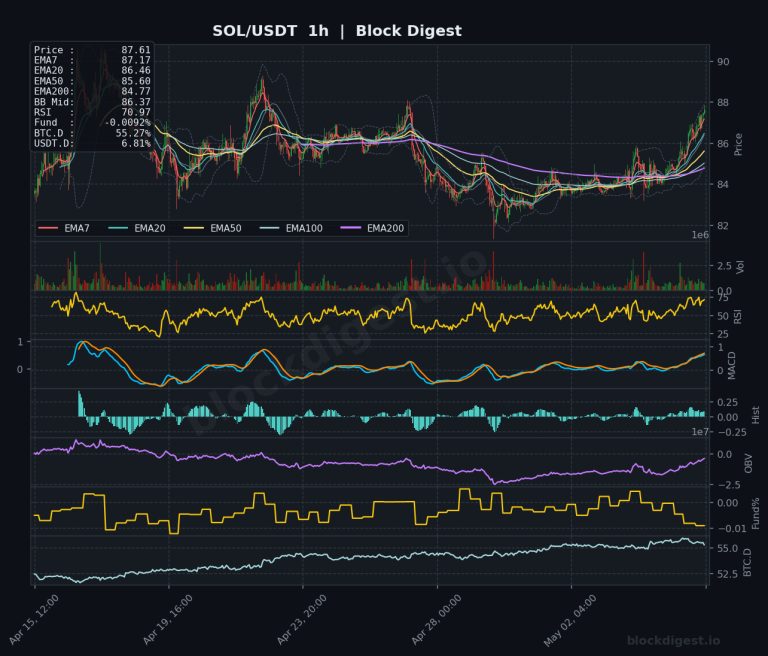
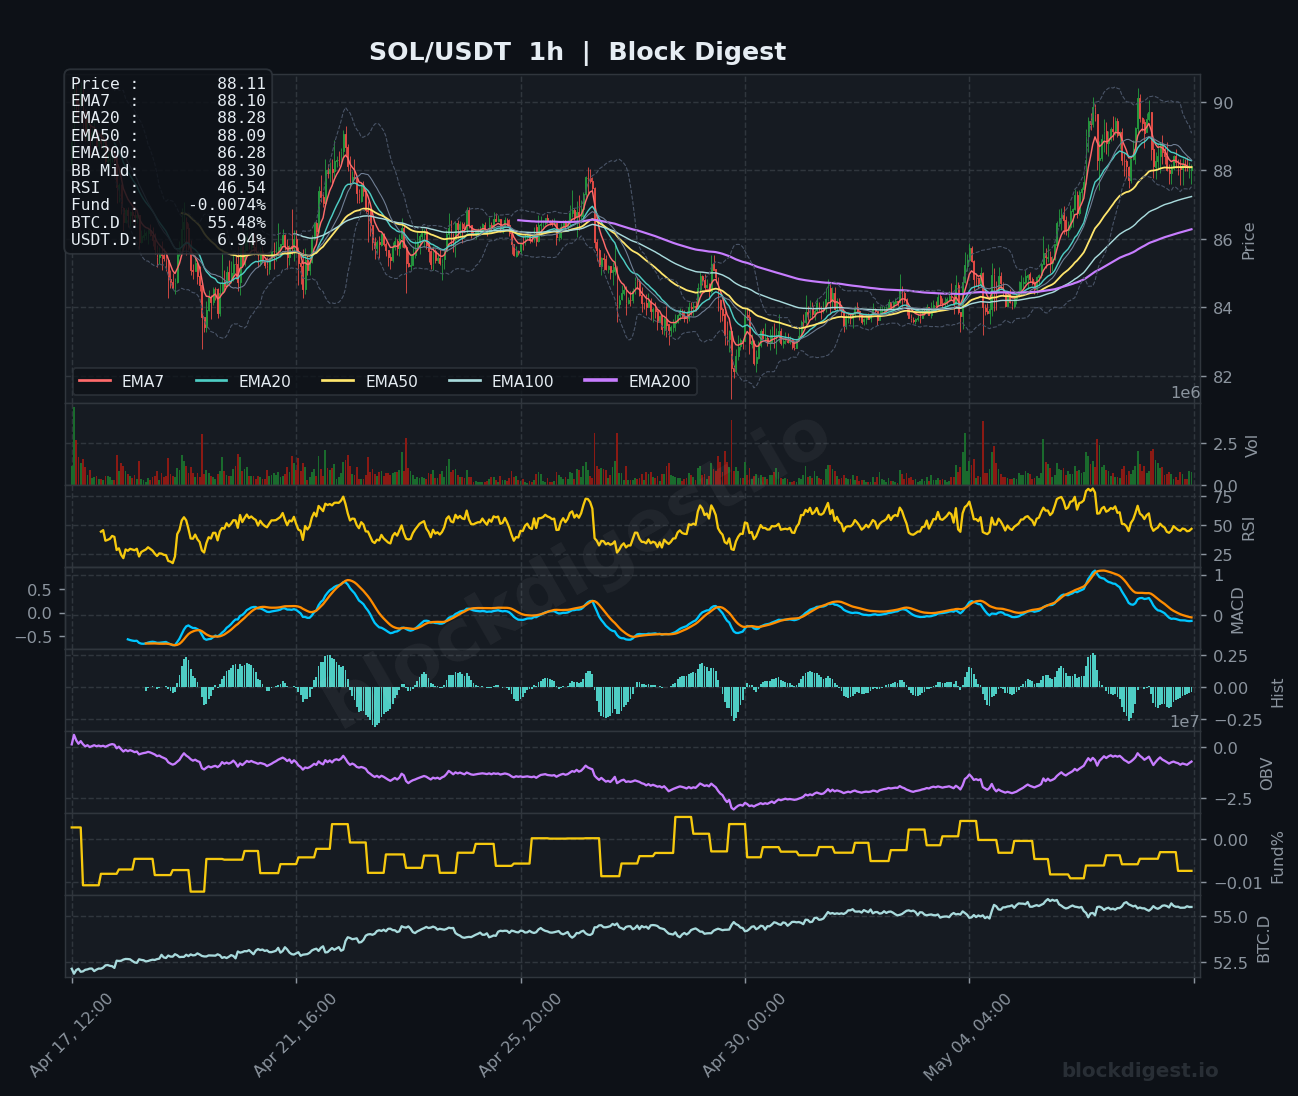
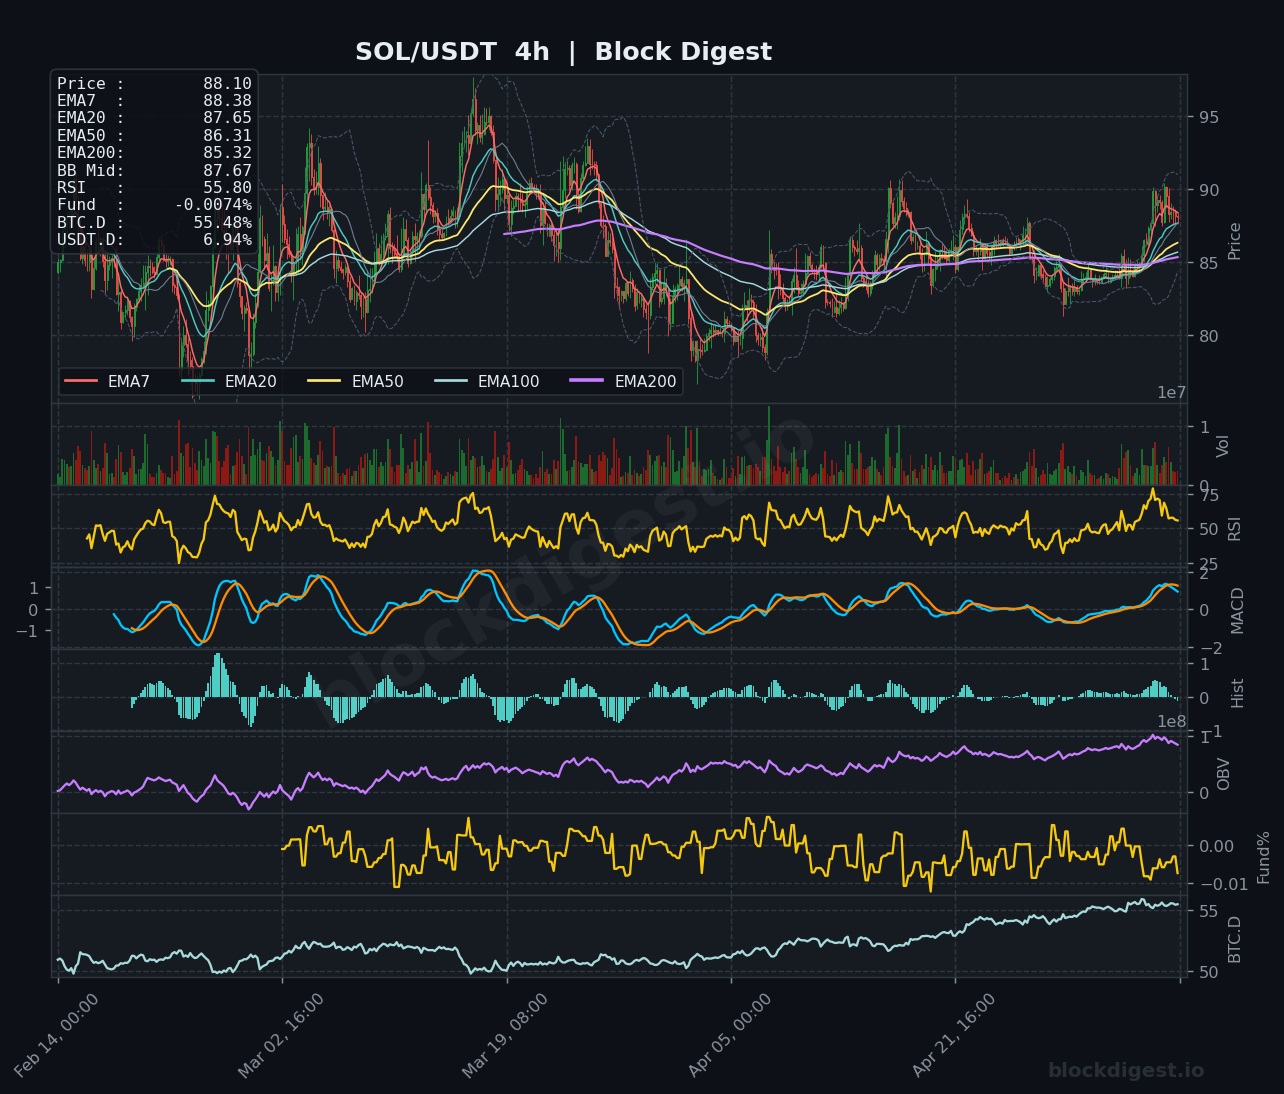
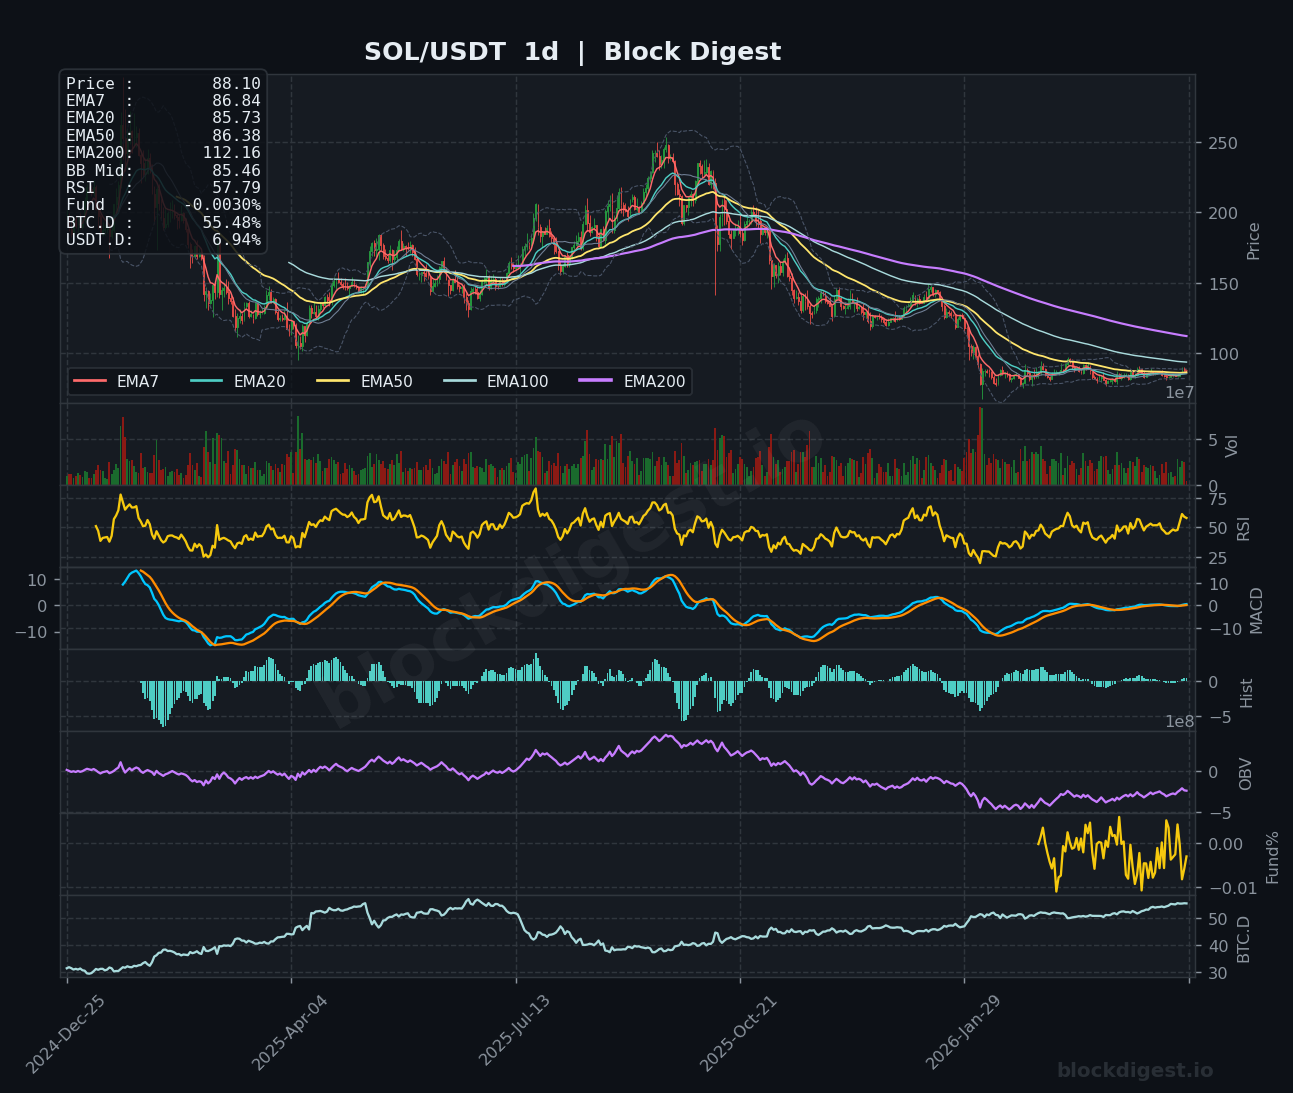
Solana trades at $88.10, consolidating just below its recent spike to $90+ levels with price compressed between the $86-$88 range. The 1-hour chart shows RSI at 46.54 with price hovering right at the convergence of EMA7-50, while the MACD has rolled negative, indicating short-term momentum loss. On the daily timeframe, SOL remains well below the declining EMA200 at $112.16, with MACD deeply negative in bearish territory. The immediate bias is neutral-to-bearish unless SOL reclaims $90 with conviction; a break below $86 could trigger further downside toward the $82-84 support zone.
XRP (XRP)
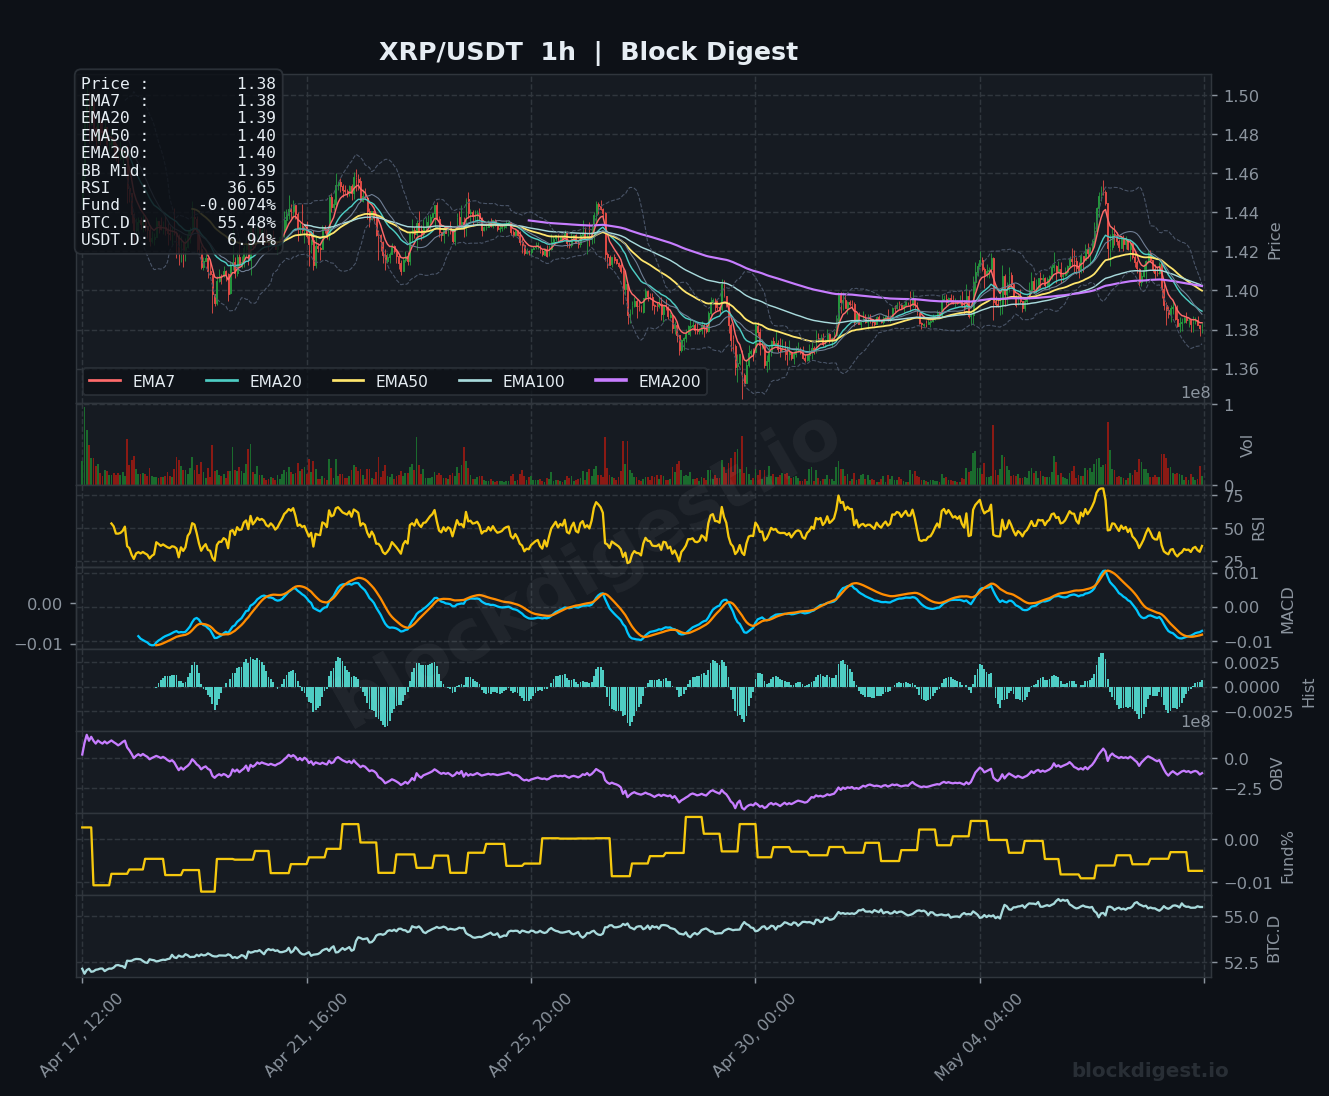
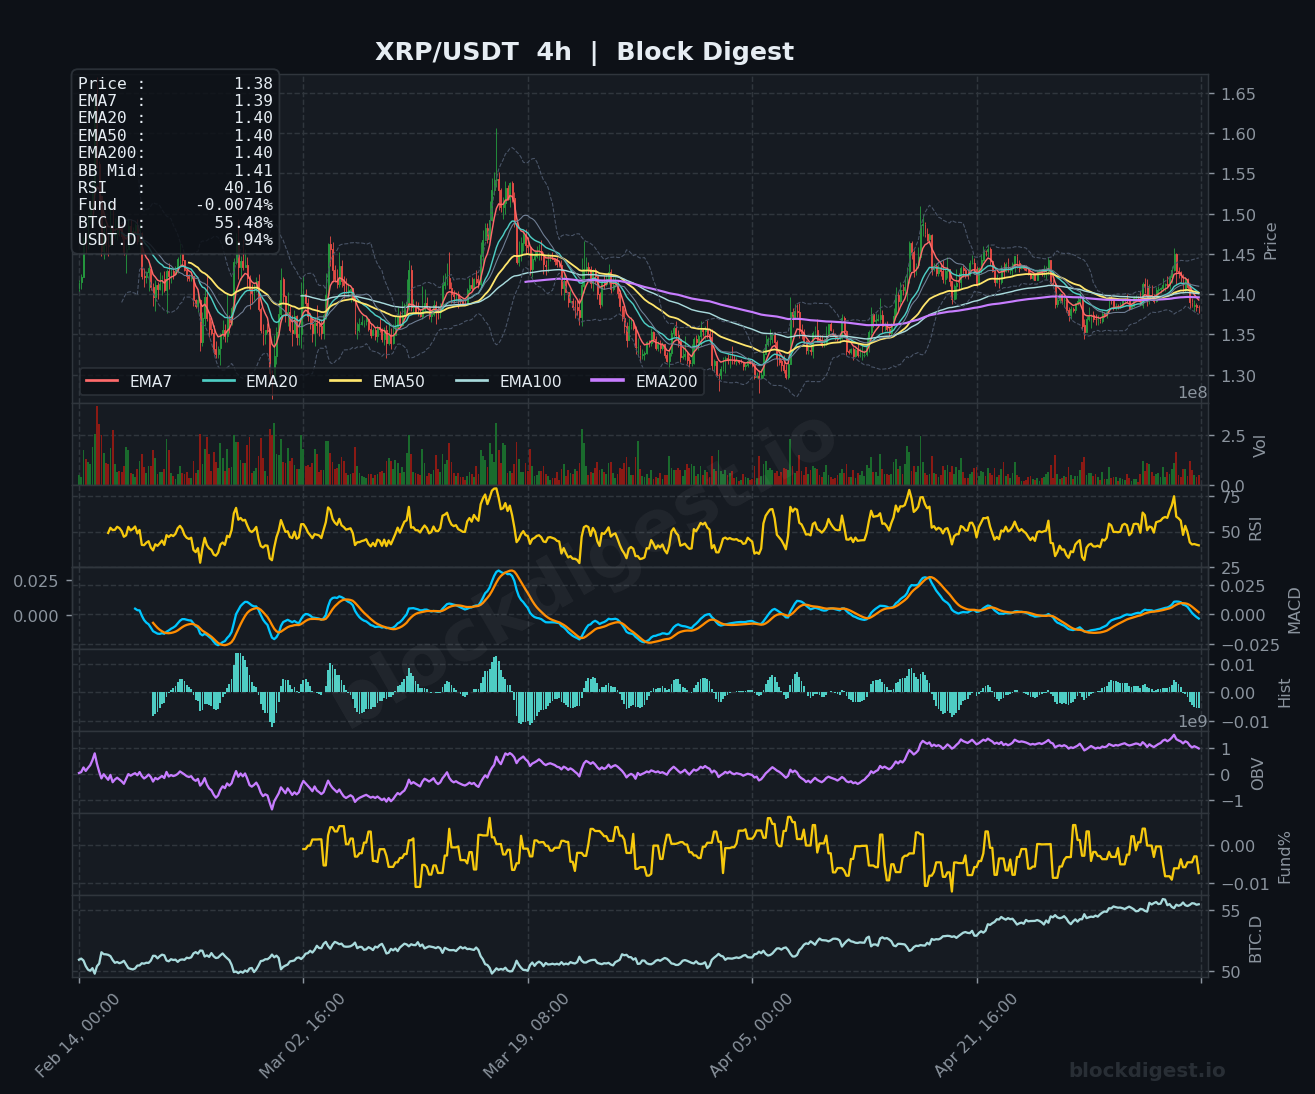
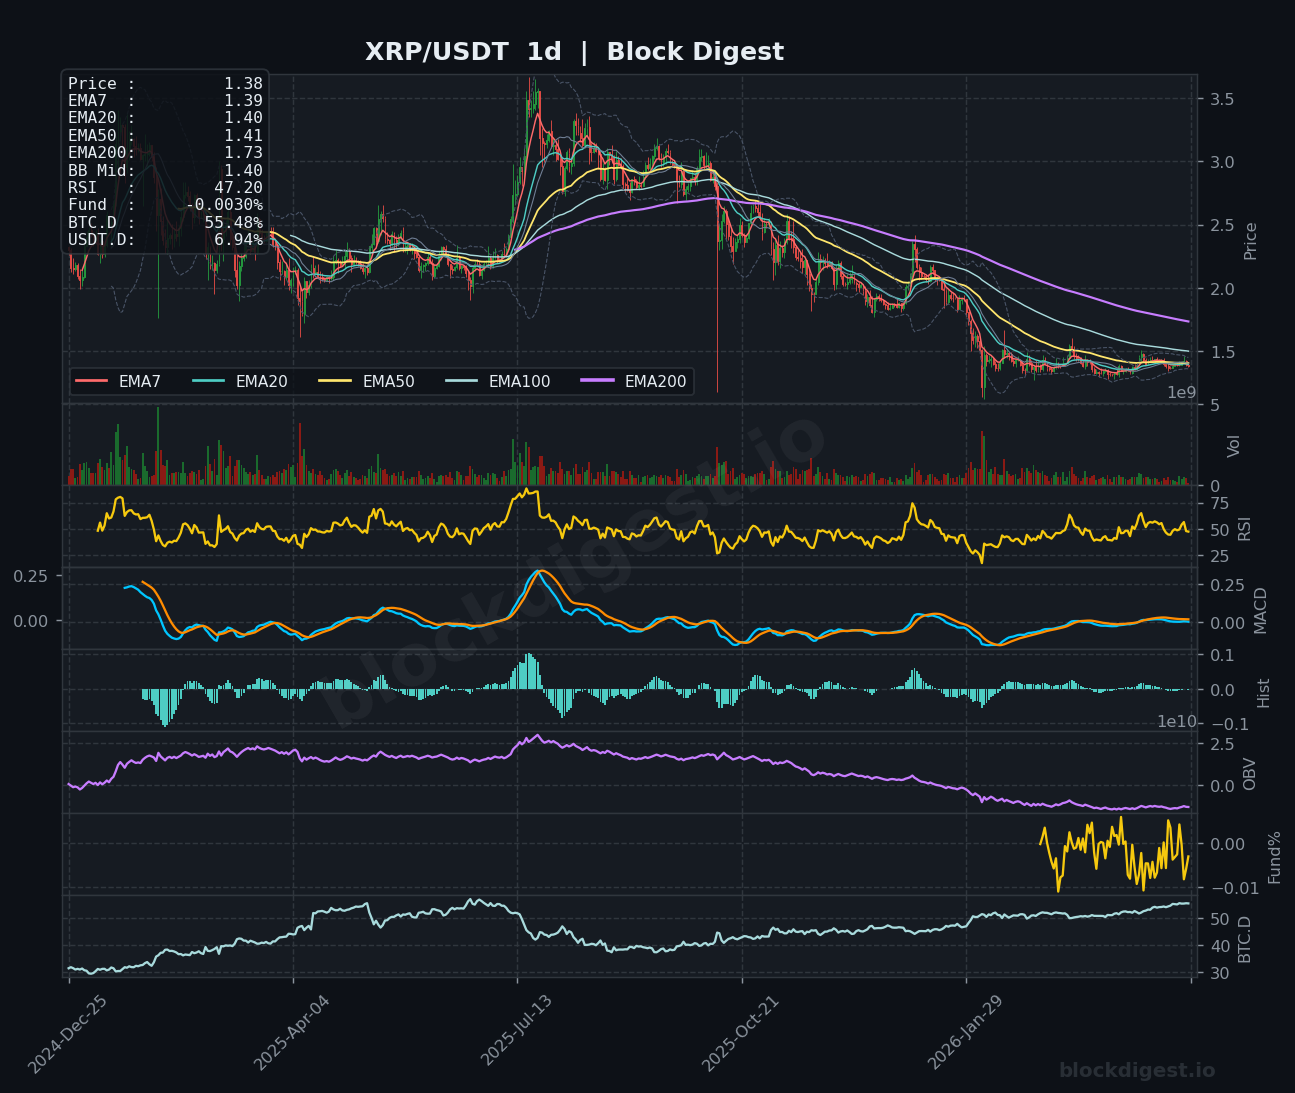
XRP is trading at $1.38, showing weakness after failing to hold above $1.40 resistance across multiple timeframes. The 1-hour RSI has dropped to 36.65, approaching oversold territory, while the MACD remains negative with price sliding below key short-term moving averages. On the 4-hour chart, XRP is testing support at the EMA20/50 cluster around $1.39-$1.40, with RSI at 40.16 suggesting limited momentum. The daily chart reveals deeper concerns, with price trapped below the declining EMA200 at $1.73 and MACD flatlined near zero. Near-term bias tilts bearish unless XRP reclaims $1.42; failure to hold $1.37 could lead to a test of the $1.30-$1.32 support zone.
BNB (BNB)
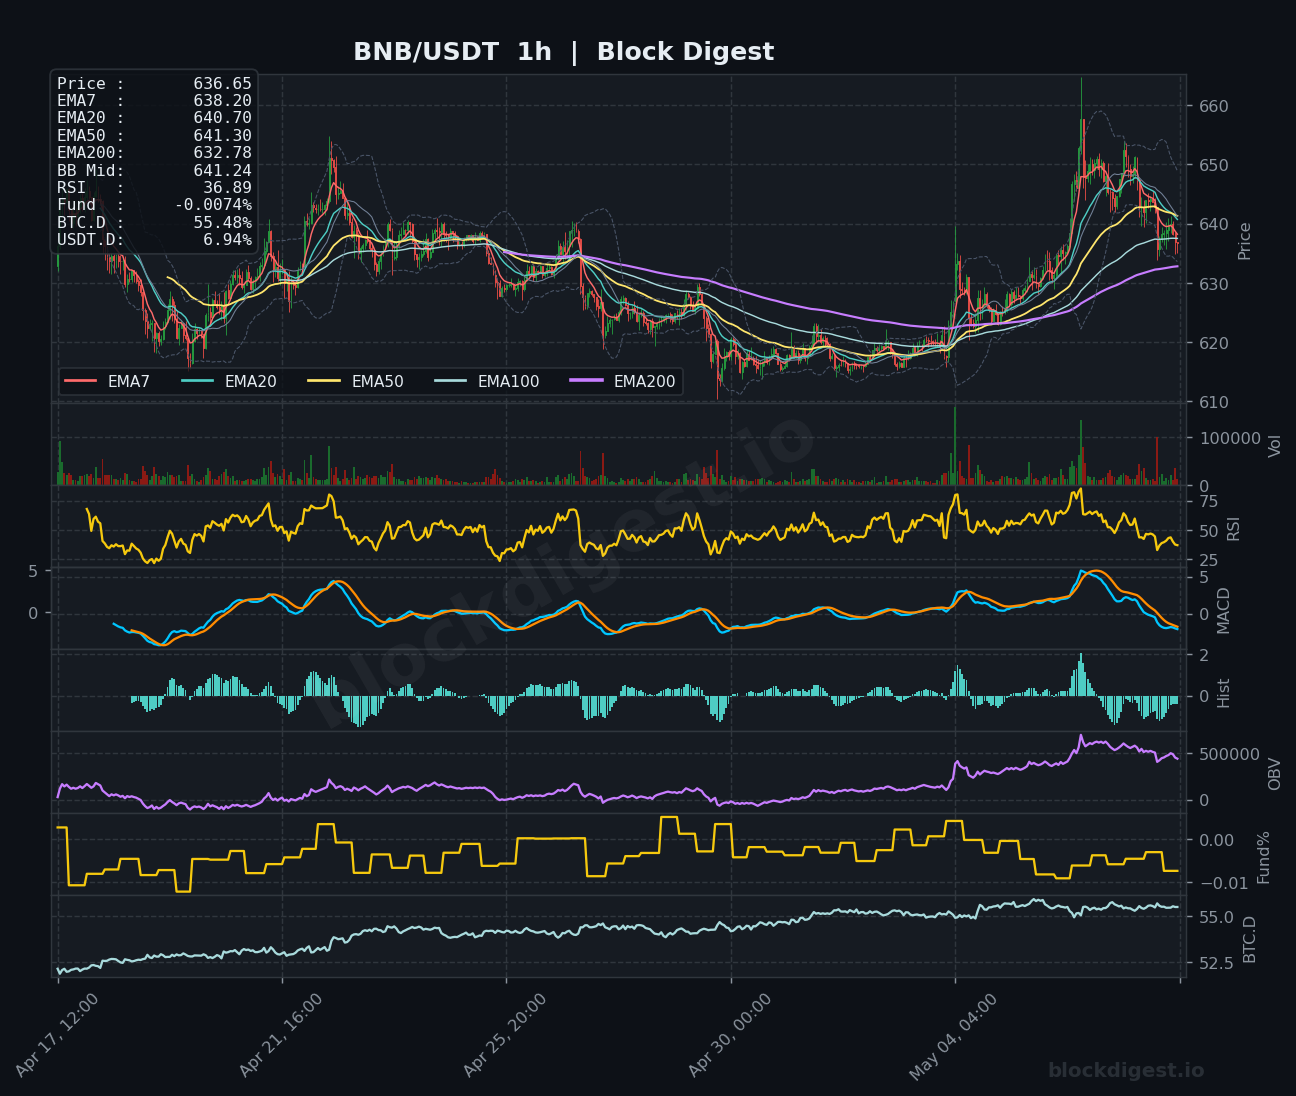
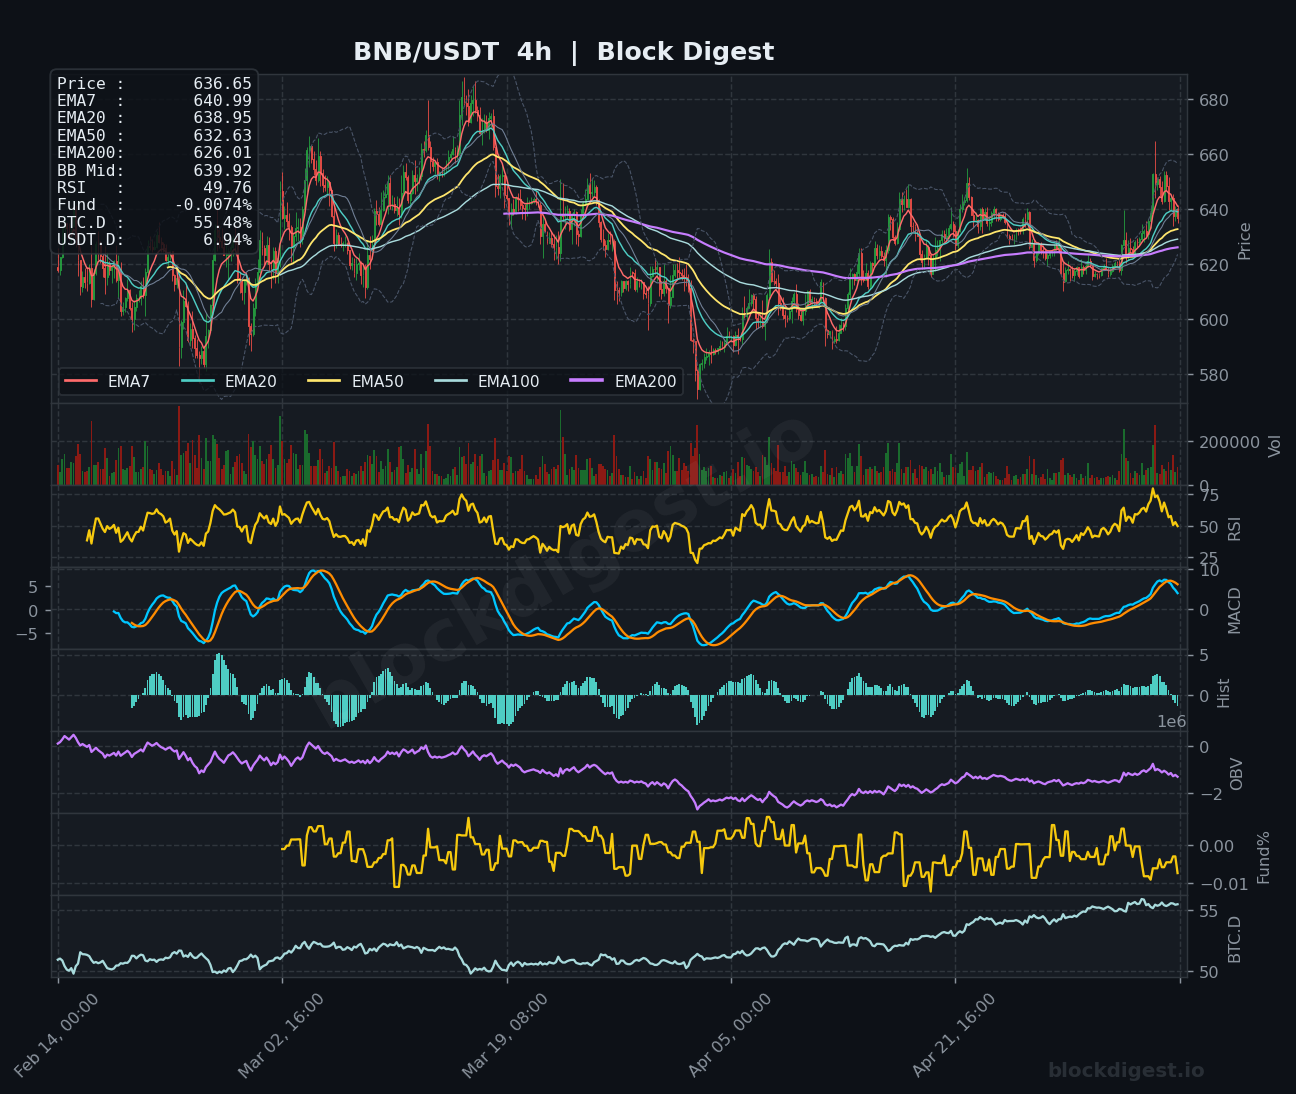
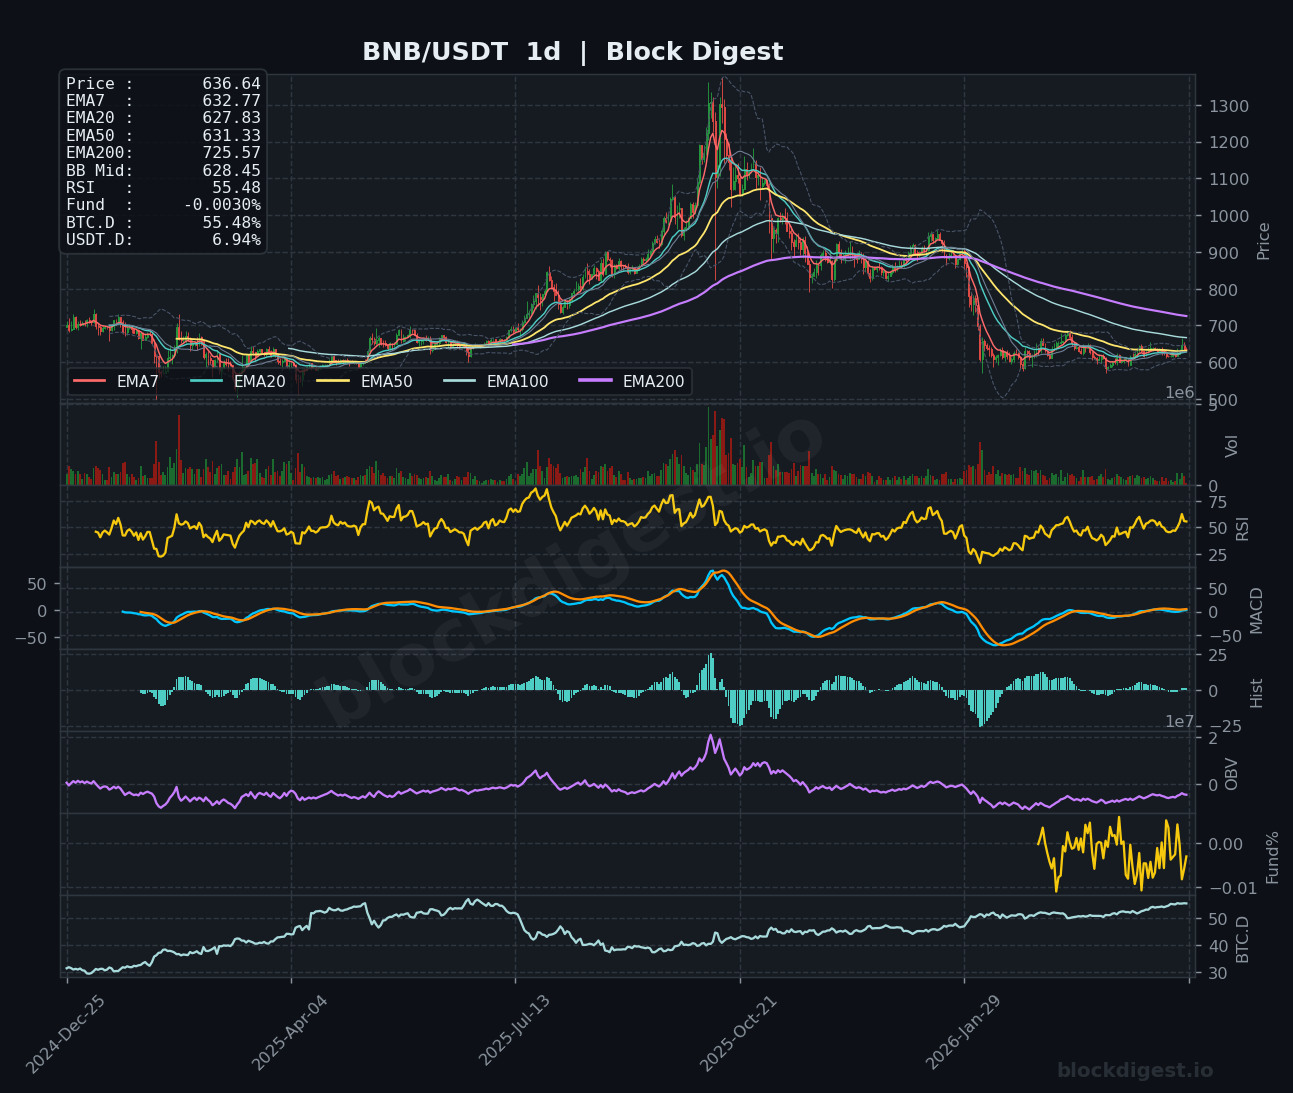
BNB trades at $636.65 after pulling back from recent highs near $670, now consolidating around the $636-$641 range. The 1-hour chart shows RSI at 36.89 (oversold territory) with price testing support at the EMA50 ($641), while MACD has crossed bearish. The 4-hour timeframe reveals BNB trading below its EMA7 ($640.99) but holding above the EMA50 at $632.63, with RSI at 49.76 suggesting neutral momentum. On the daily chart, BNB remains below the EMA200 at $725.57, though MACD shows signs of flattening after extended negativity. The short-term outlook is neutral, with $620-$625 as critical support; a bounce above $650 would signal renewed bullish momentum.
Dogecoin (DOGE)
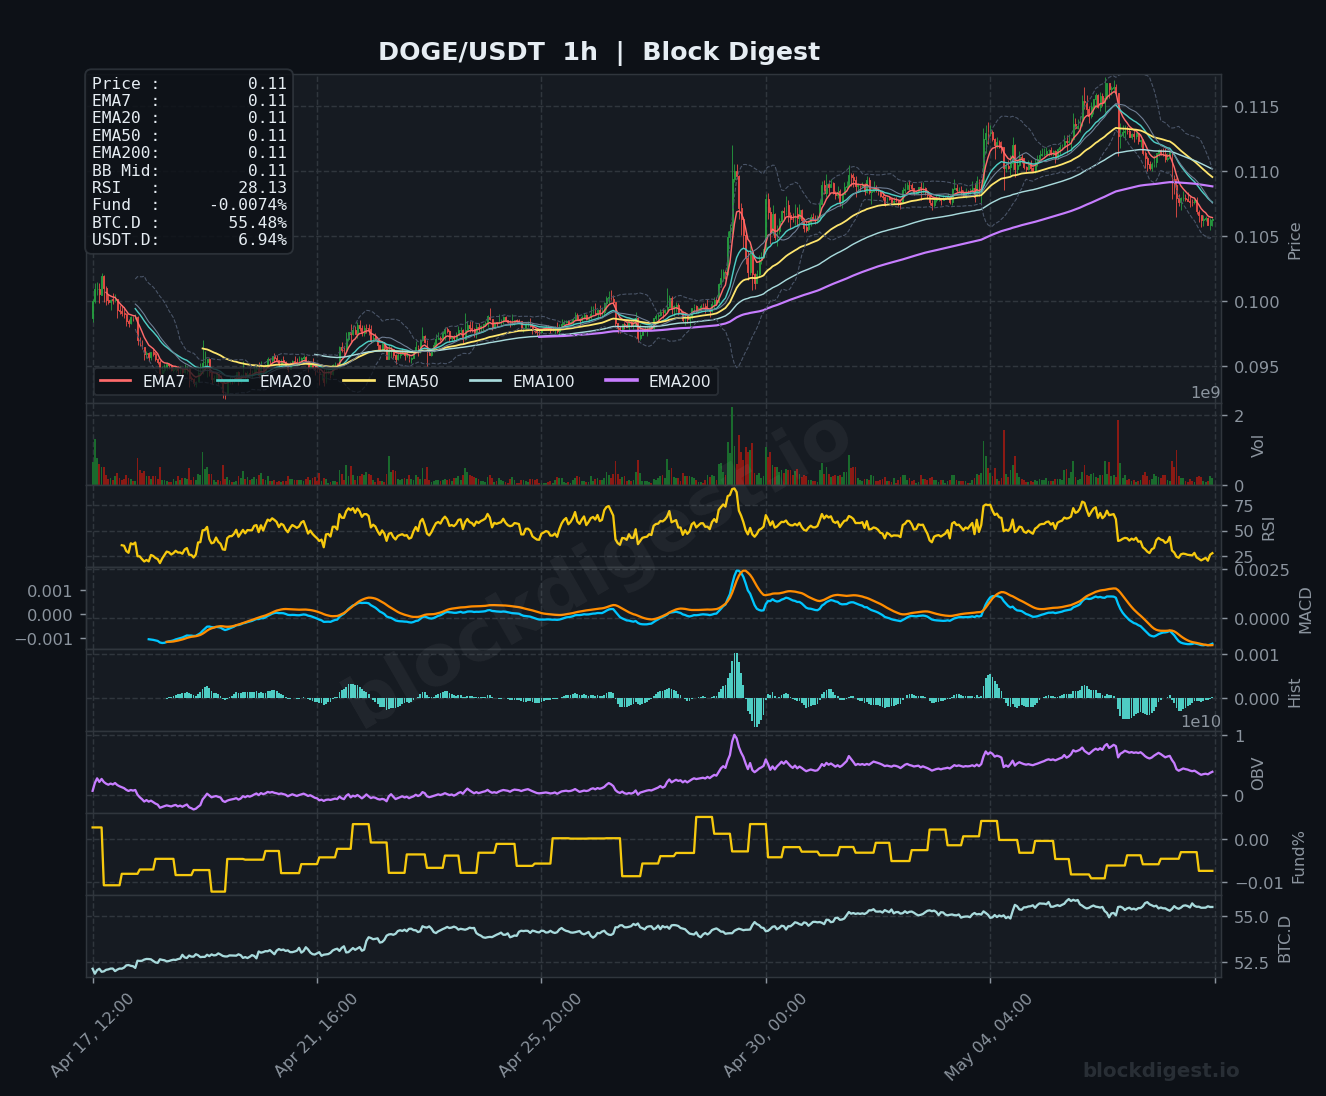
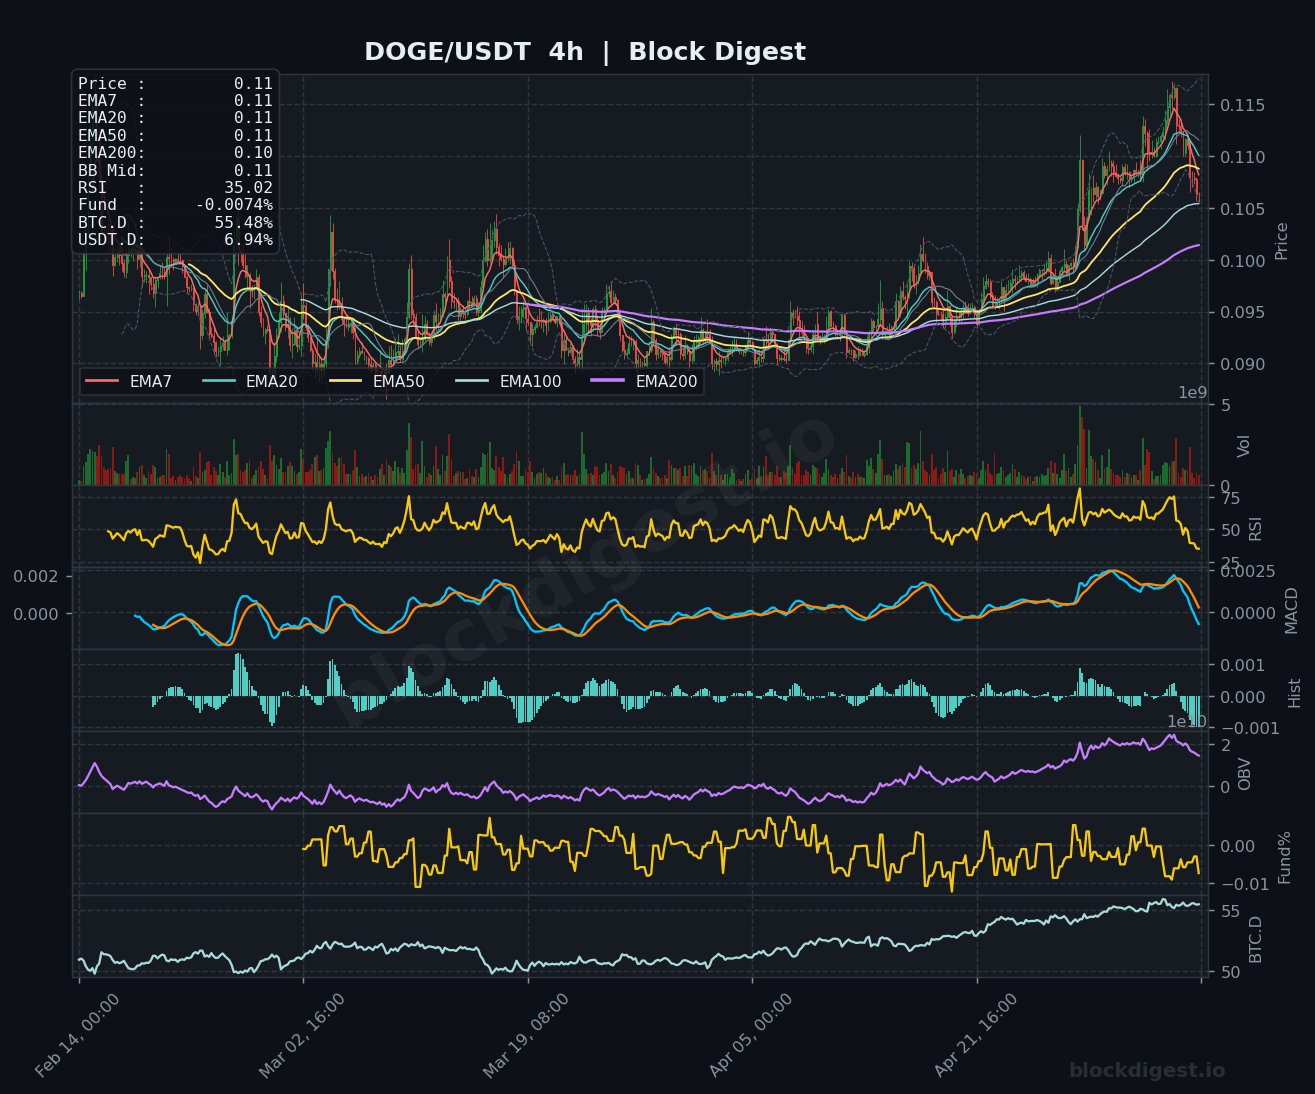
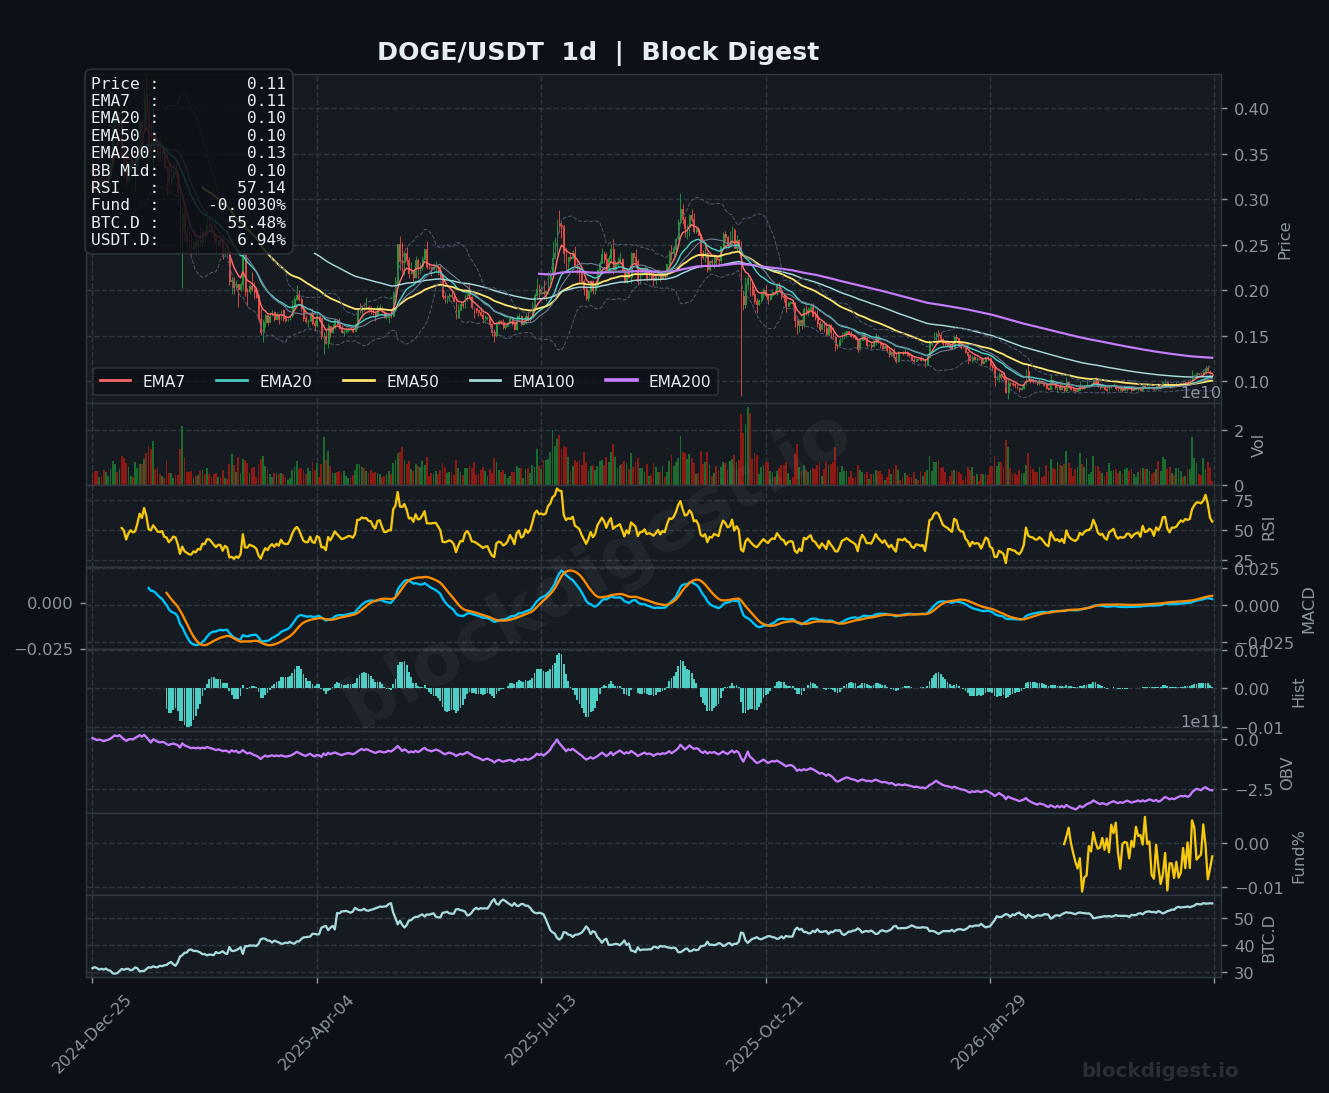
Dogecoin is trading at $0.1100, showing significant weakness after recent rejection at $0.1160 levels. The 1-hour RSI has collapsed to 28.13 (deeply oversold), while price has broken below all major moving averages with the MACD turning sharply negative. The 4-hour chart confirms the bearish structure, with RSI at 35.02 and price trading below the EMA200 at $0.10, though attempting to stabilize. On the daily timeframe, DOGE shows a concerning setup with price barely above critical long-term support and MACD negative. The immediate bias is bearish unless DOGE reclaims $0.1120; a breakdown below $0.1050 could accelerate selling toward the $0.0950-$0.1000 zone.
Litecoin (LTC)
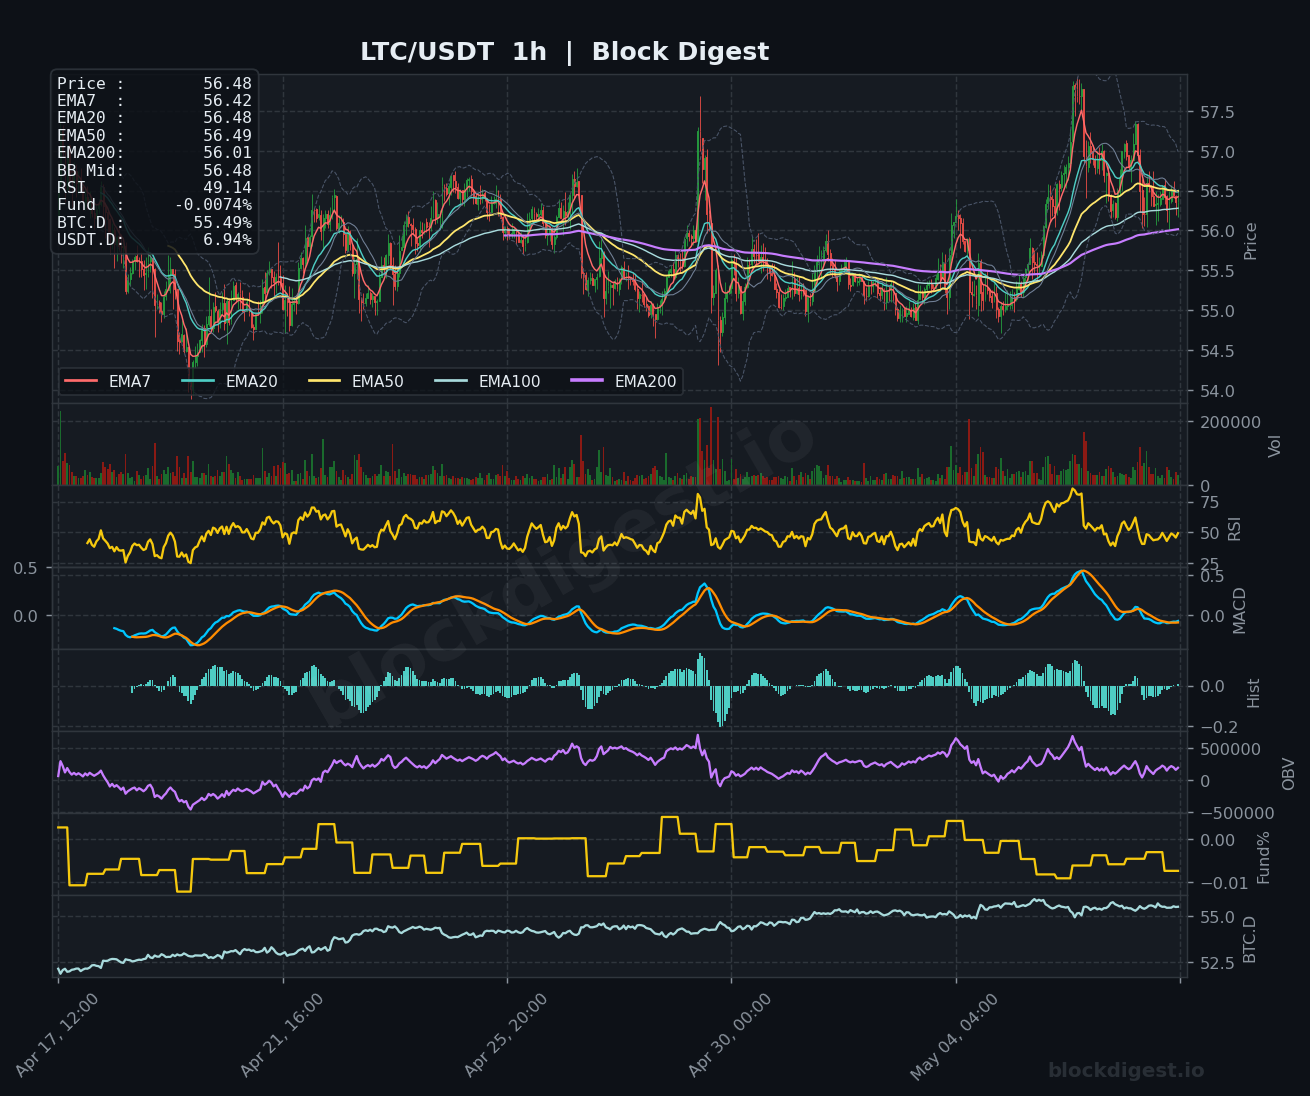
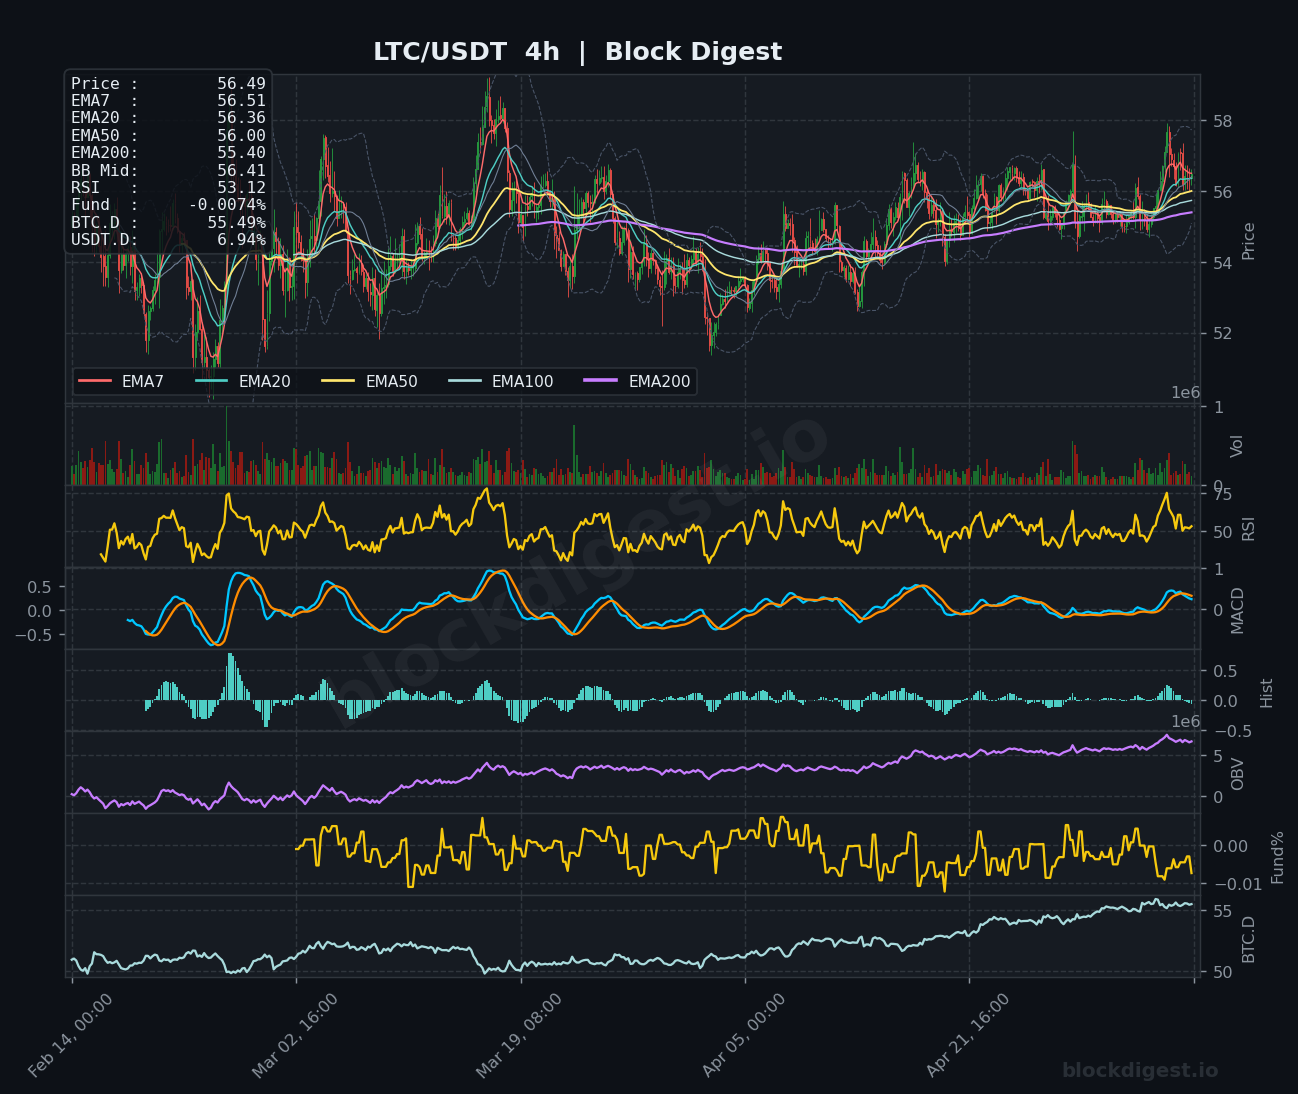
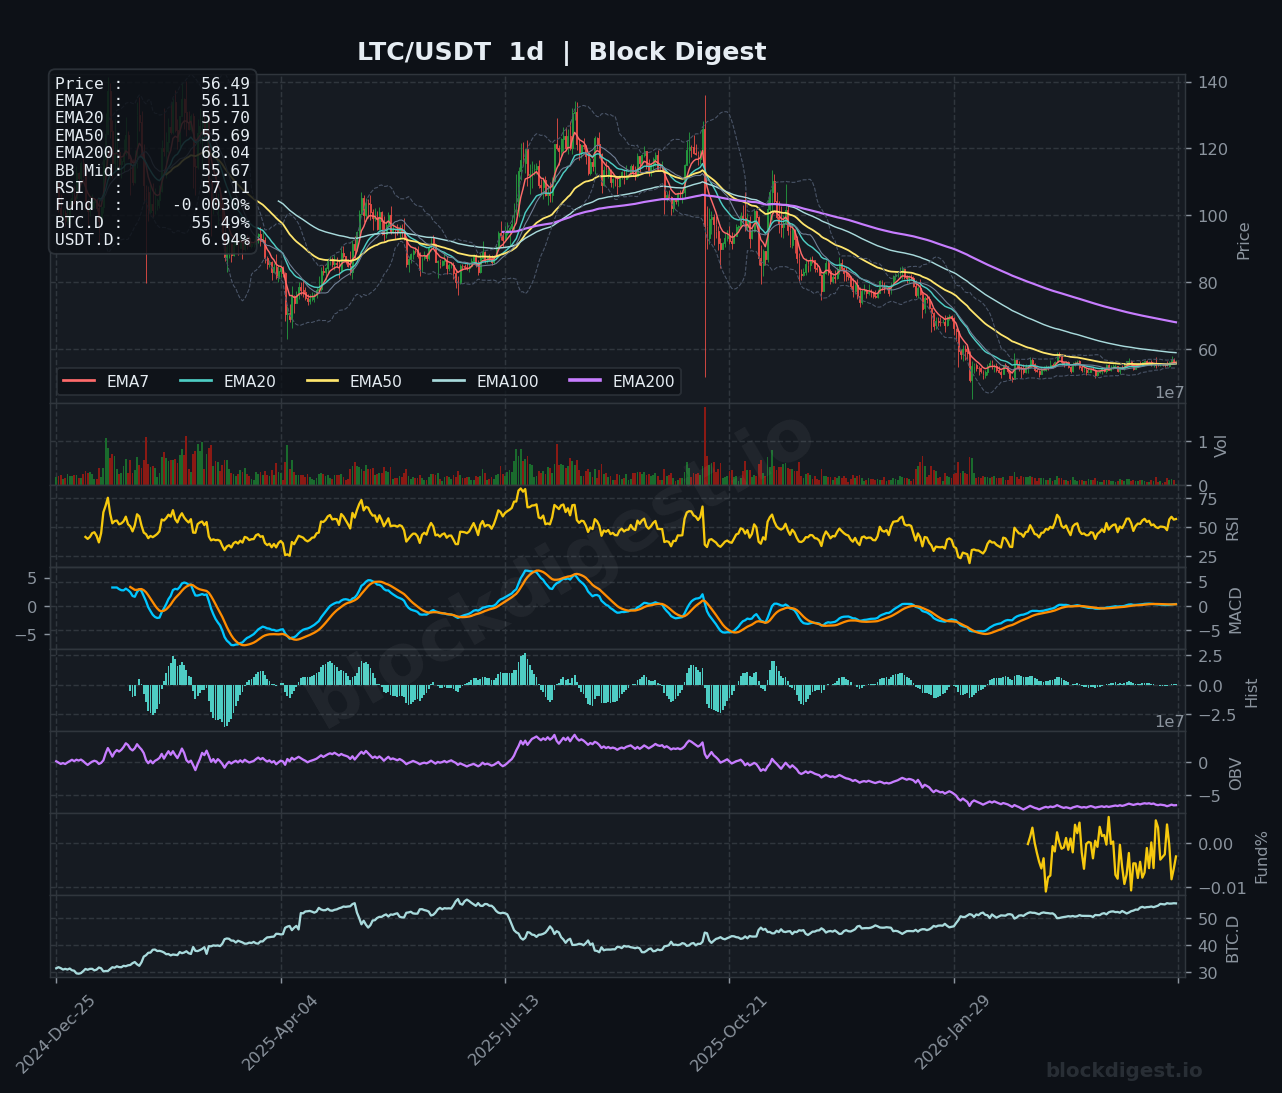
Litecoin trades at $56.48, consolidating in a tight range after recent volatility between $54.50 and $58.00. The 1-hour chart shows RSI at 49.14 (neutral) with price oscillating around the EMA cluster near $56.40-$56.50, while MACD hovers near the zero line. The 4-hour timeframe reveals a similar pattern, with LTC trading just below its EMA7 at $56.51 and RSI at 53.12, suggesting balanced momentum. The daily chart shows LTC struggling below the declining EMA200 at $68.04, with MACD remaining negative but potentially forming a base. Near-term bias is neutral-to-slightly-bullish; a break above $57.50 could target $59-$60, while failure at $55.50 would signal renewed weakness.
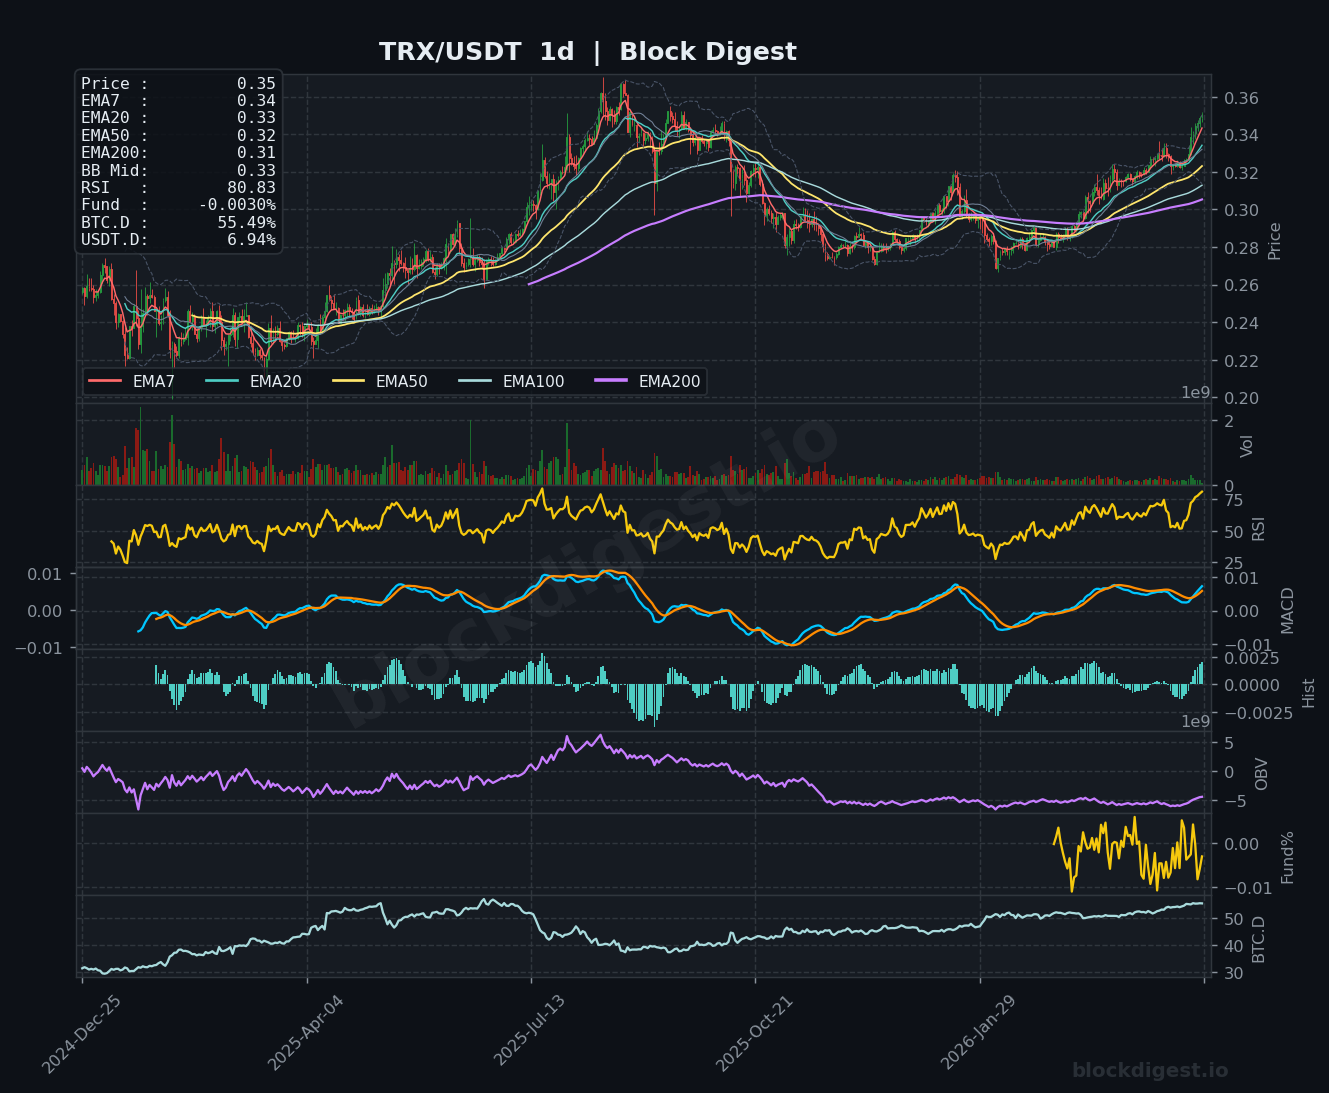
TRON (TRX)
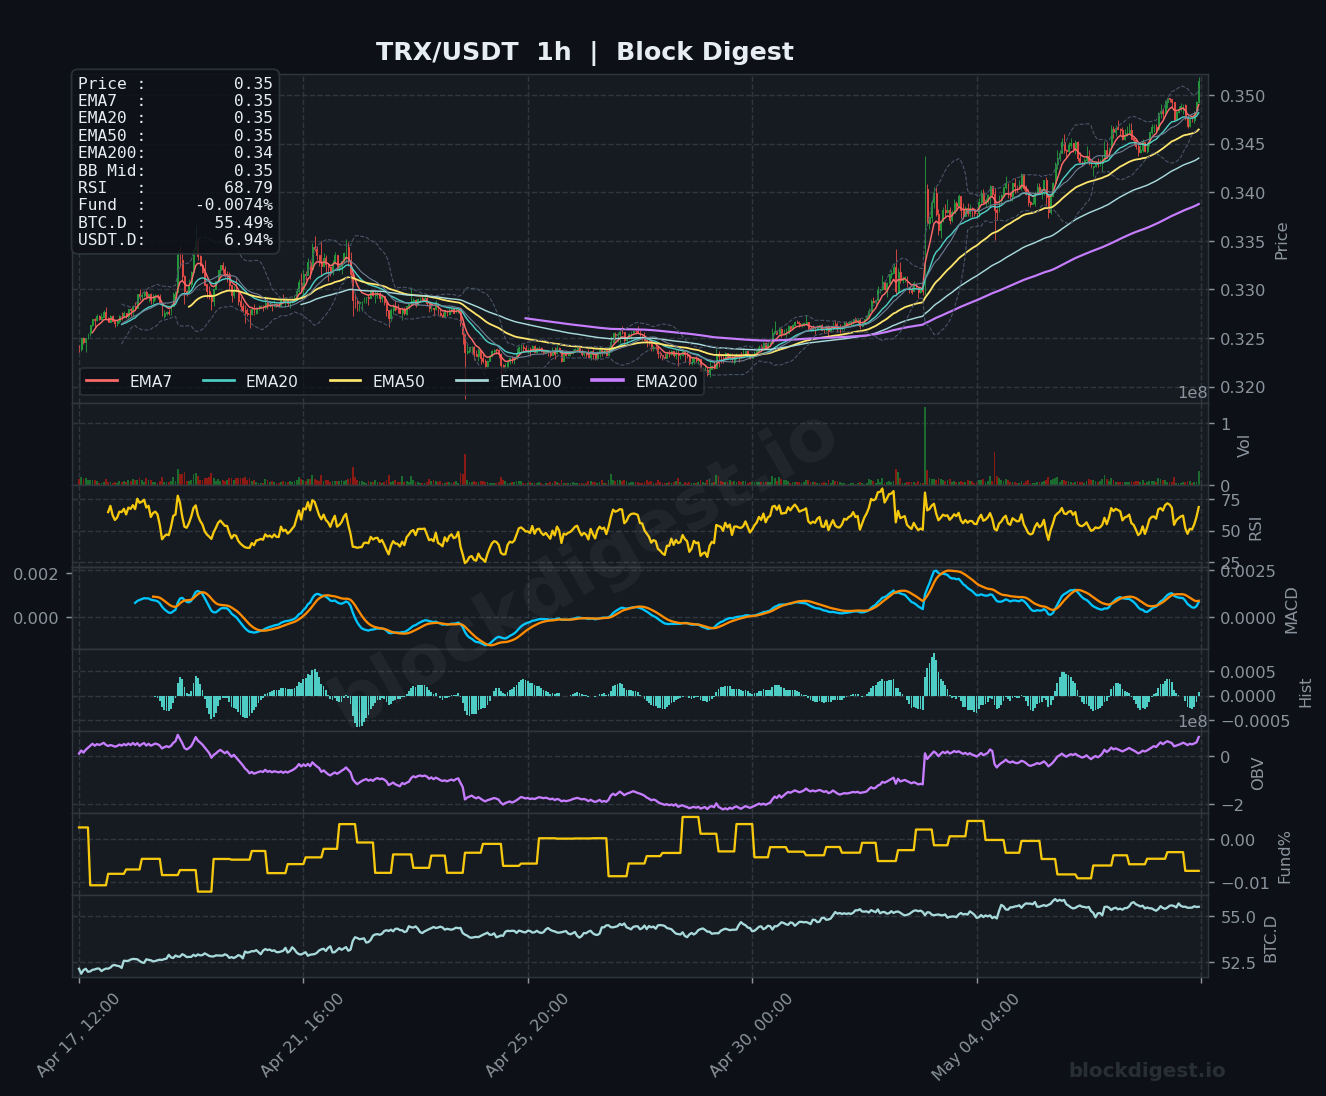
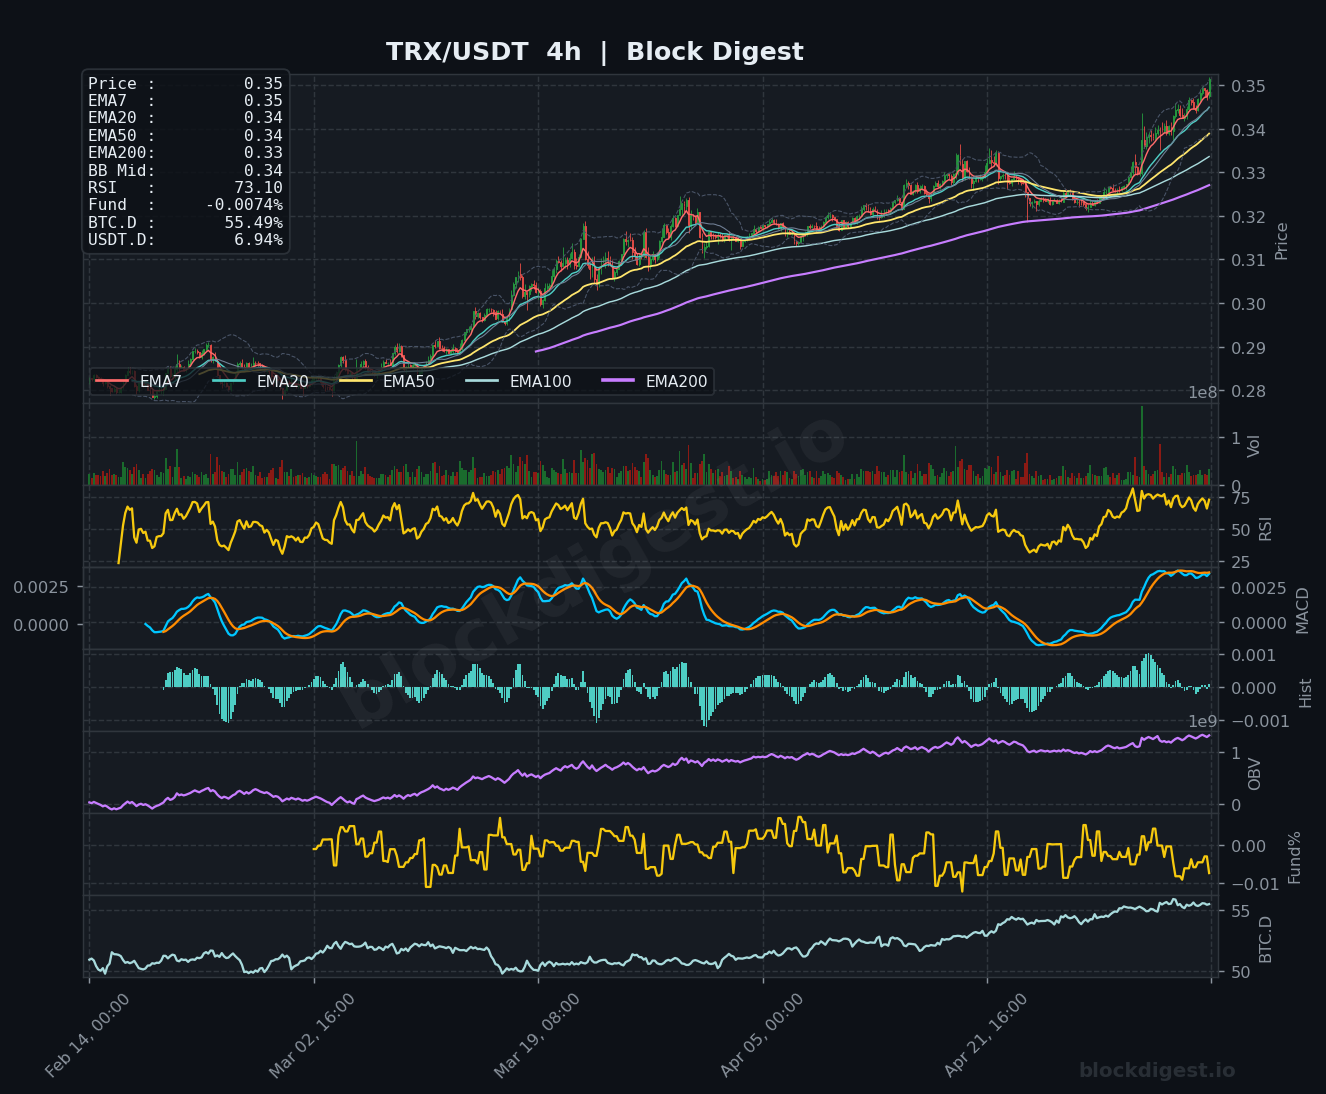
TRON stands out as the strongest performer, trading at $0.3500 with clear bullish momentum across all timeframes. The 1-hour RSI reads 68.79 (approaching overbought), with price trending well above all major moving averages in an upward channel. The 4-hour chart confirms strength with RSI at 73.10, price above the rising EMA50 at $0.34, and MACD turning positive with expanding histogram bars. Most impressively, the daily chart shows TRX with RSI at 80.83 (overbought but strong), trading above all EMAs including the EMA200 at $0.31, with MACD decisively positive. TRX exhibits the clearest bullish structure in the altcoin space; momentum supports continuation toward $0.36-$0.37, though overbought conditions warrant caution.
Altcoin Outlook
The altcoin landscape remains fragmented, with TRX demonstrating exceptional relative strength while legacy assets like XRP, DOGE, and LTC struggle with deteriorating momentum. SOL and BNB occupy middle ground with neutral short-term setups that could break either direction based on Bitcoin’s next move. The moderate USDT.D reading at 6.94% suggests limited panic but also insufficient capital rotation into alts for sustained rallies. Traders should watch for Bitcoin dominance shifts and whether TRX’s leadership can broaden to other large caps; until then, selective positioning favors defensive strategies with tight risk management across most altcoin exposure.
Disclaimer: This analysis is for informational purposes only and does not constitute financial advice. Cryptocurrency markets are highly volatile and unpredictable. All trading decisions should be made based on your own research and risk tolerance. Block Digest is not responsible for any financial losses incurred as a result of acting on this content.