Altcoin Daily Analysis — May 06, 2026
Altcoin Daily Roundup – May 06, 2026
Market Context
The altcoin market displays mixed technical conditions with Bitcoin dominance holding near 55.27% and USDT dominance at 6.81%, suggesting modest risk appetite across the crypto ecosystem. While most major altcoins show constructive short-term price action with prices trading above key moving averages, momentum indicators reveal varying degrees of strength across different tokens. The overall environment favors selective opportunities rather than broad-based altcoin strength.
Solana (SOL)
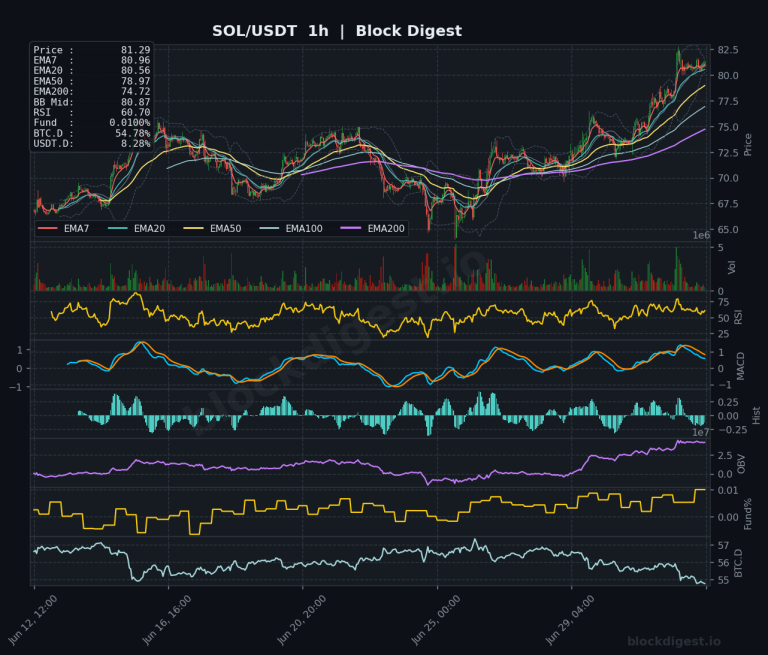
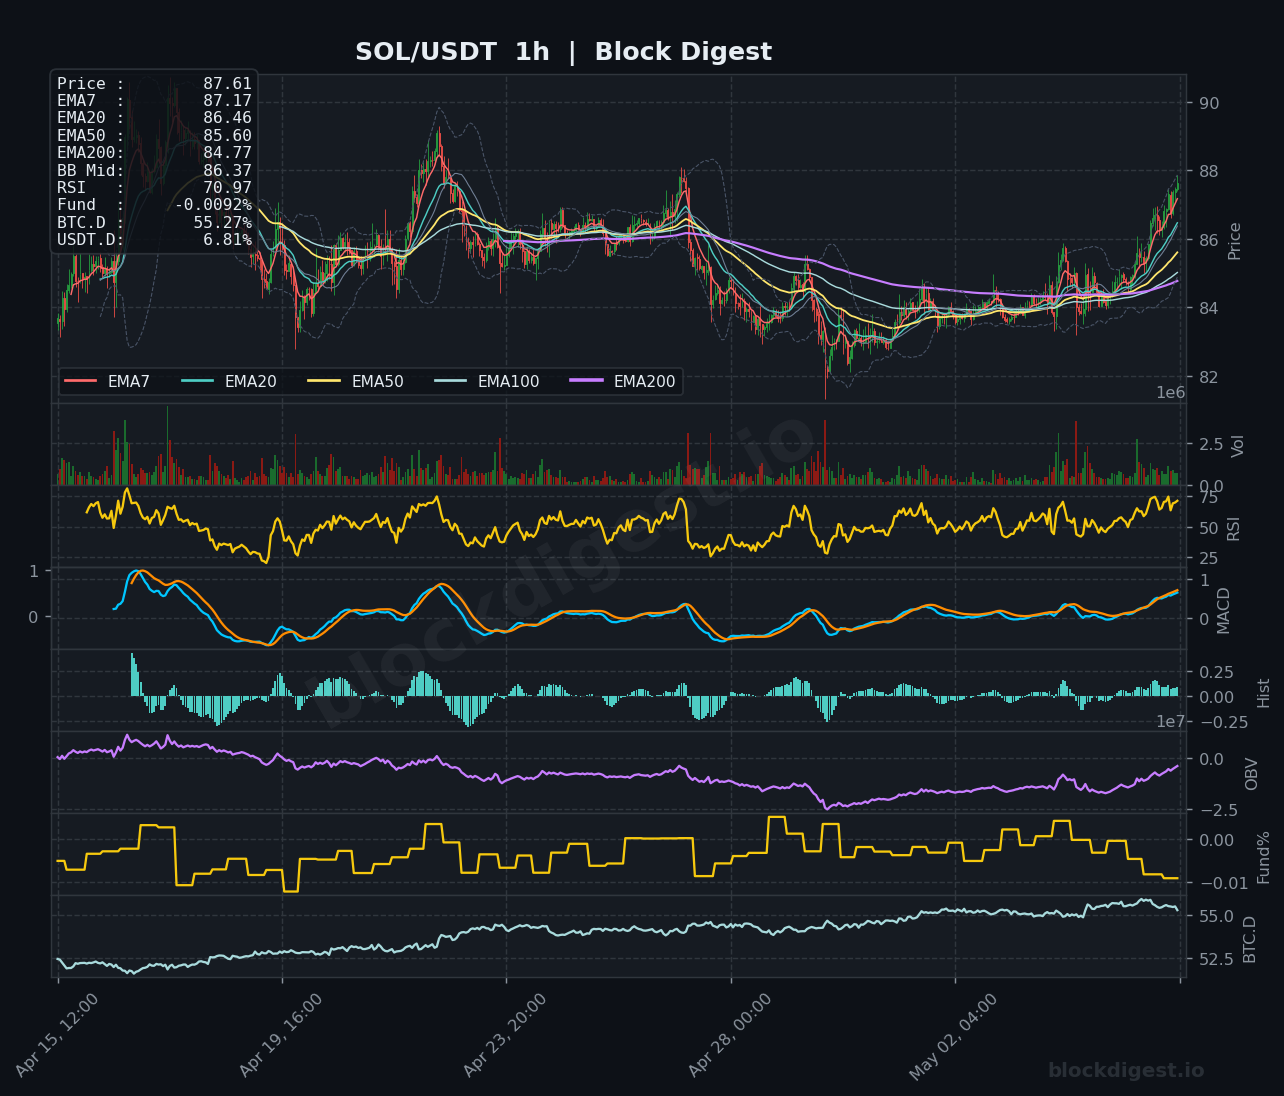
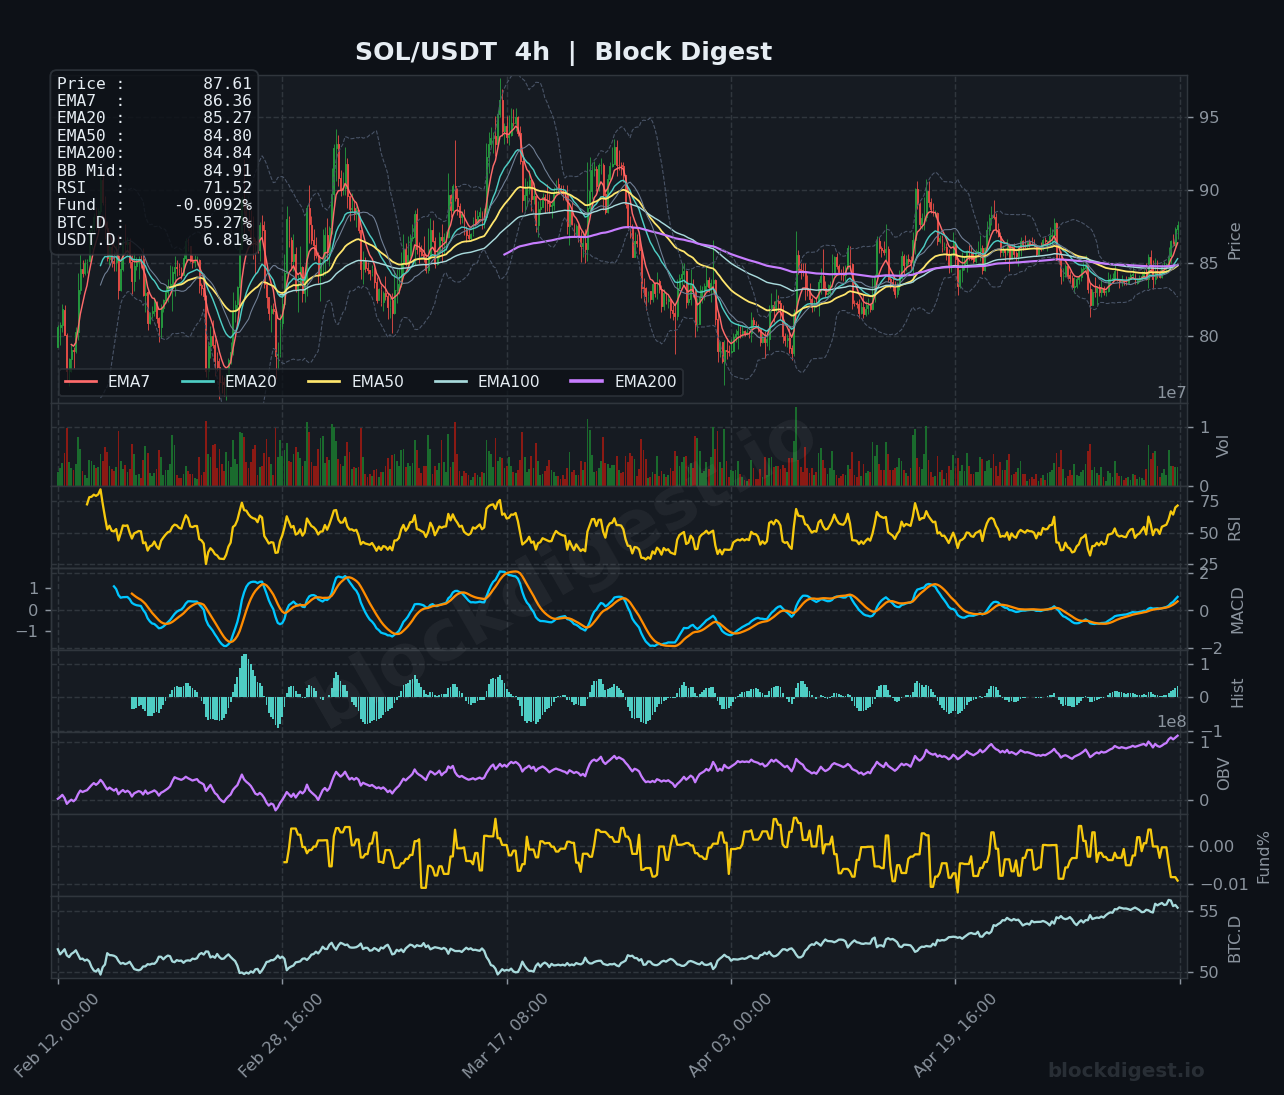
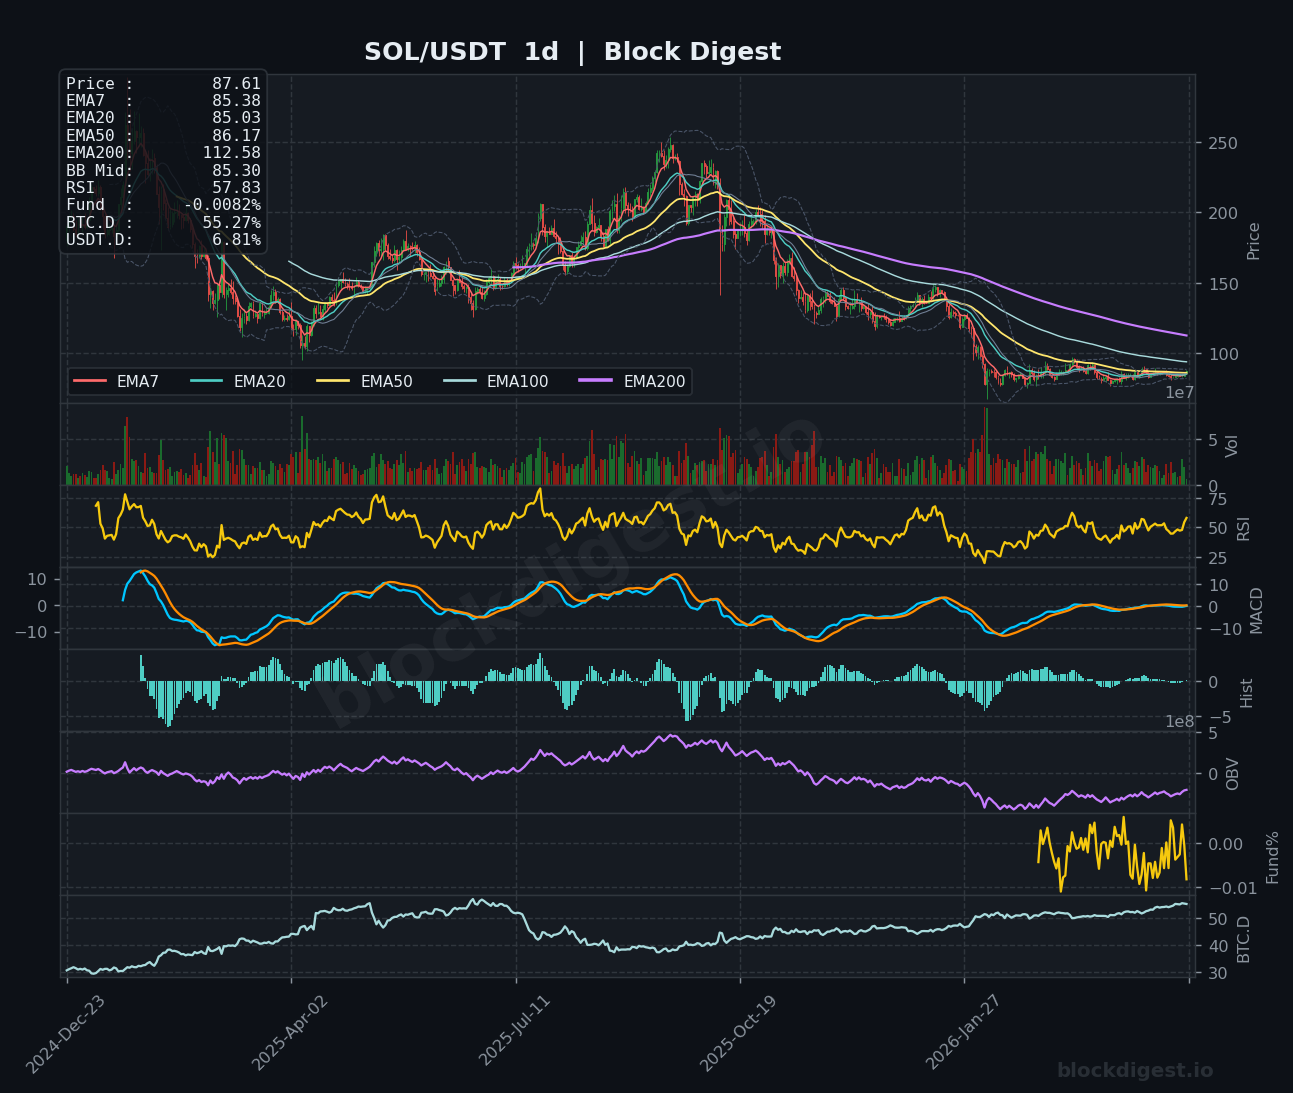
SOL trades at $87.61, positioned above its rising short-term moving averages in a constructive technical posture. The 1-hour chart shows price riding above the EMA7 ($87.17) and EMA20 ($86.46) with an RSI of 70.97 indicating overbought conditions following recent strength. On the 4-hour timeframe, SOL has established an uptrend with price above the EMA50 ($84.80), though the RSI at 71.52 suggests limited near-term upside without consolidation. The daily chart reveals SOL attempting to break above persistent resistance around the $86-88 range, with MACD trending flat near zero and an RSI of 57.83 indicating neutral-to-bullish momentum. The short-term bias remains positive, but watch for potential profit-taking near current levels given elevated RSI readings on lower timeframes.
XRP (XRP)
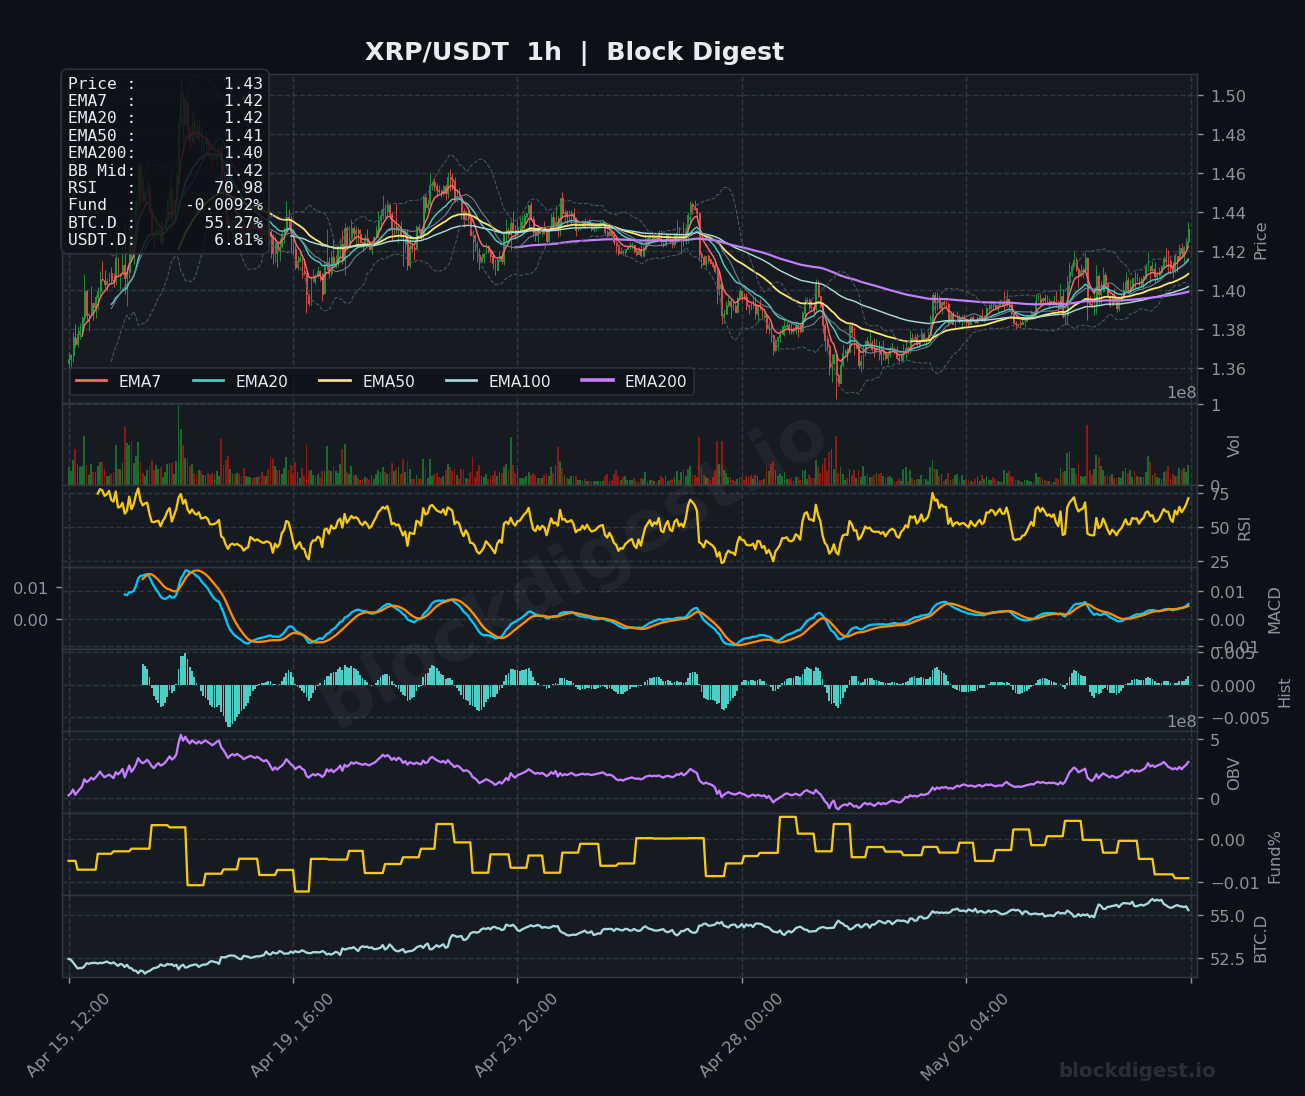
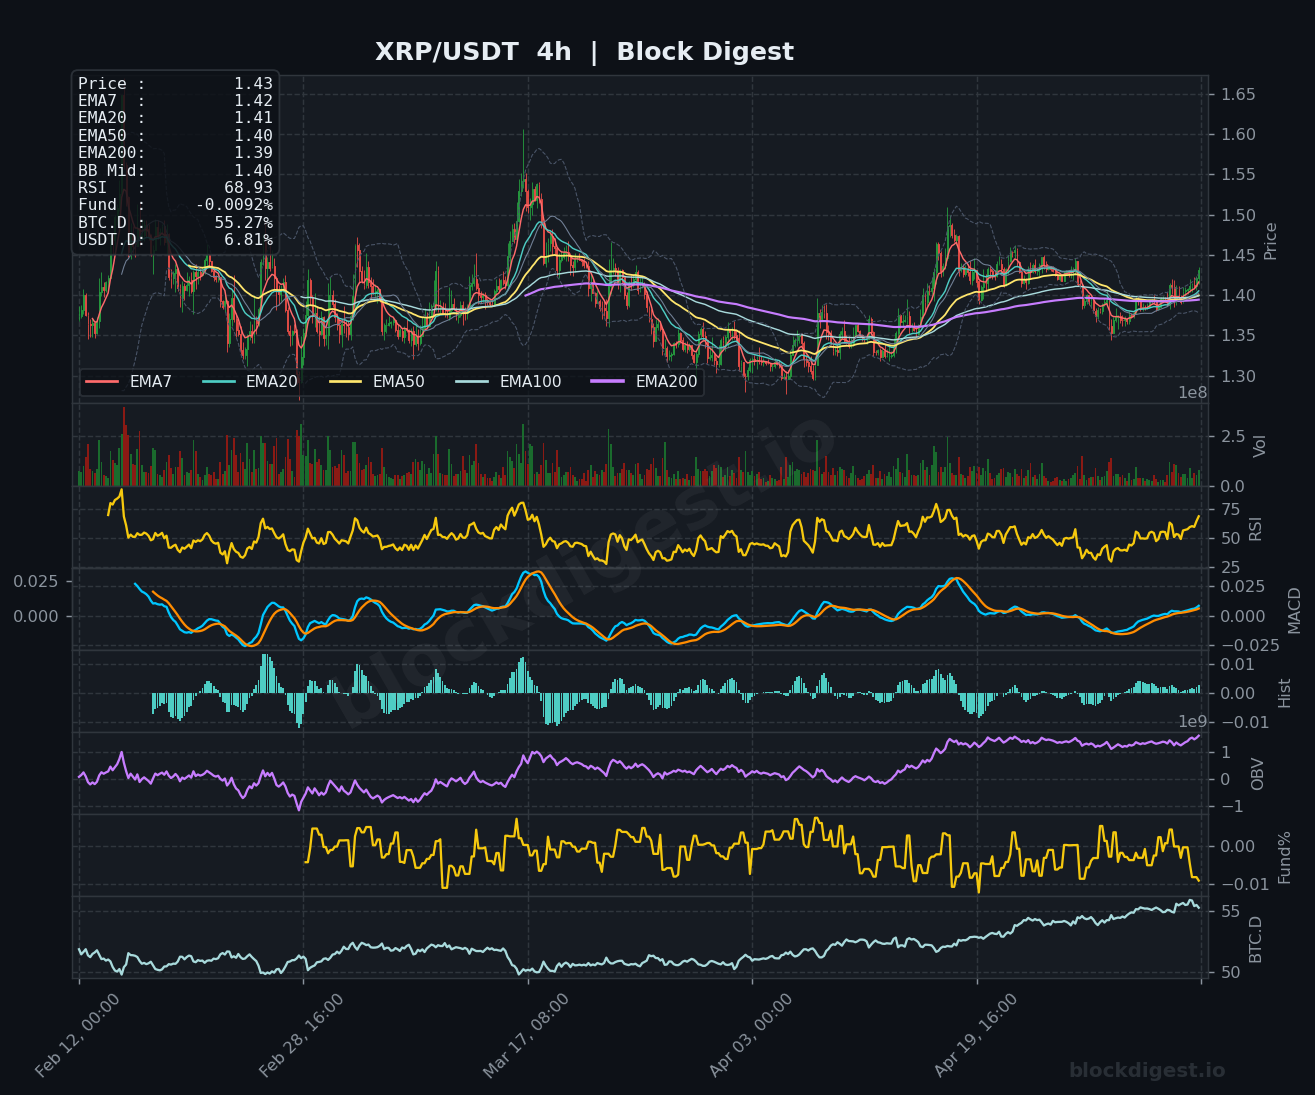
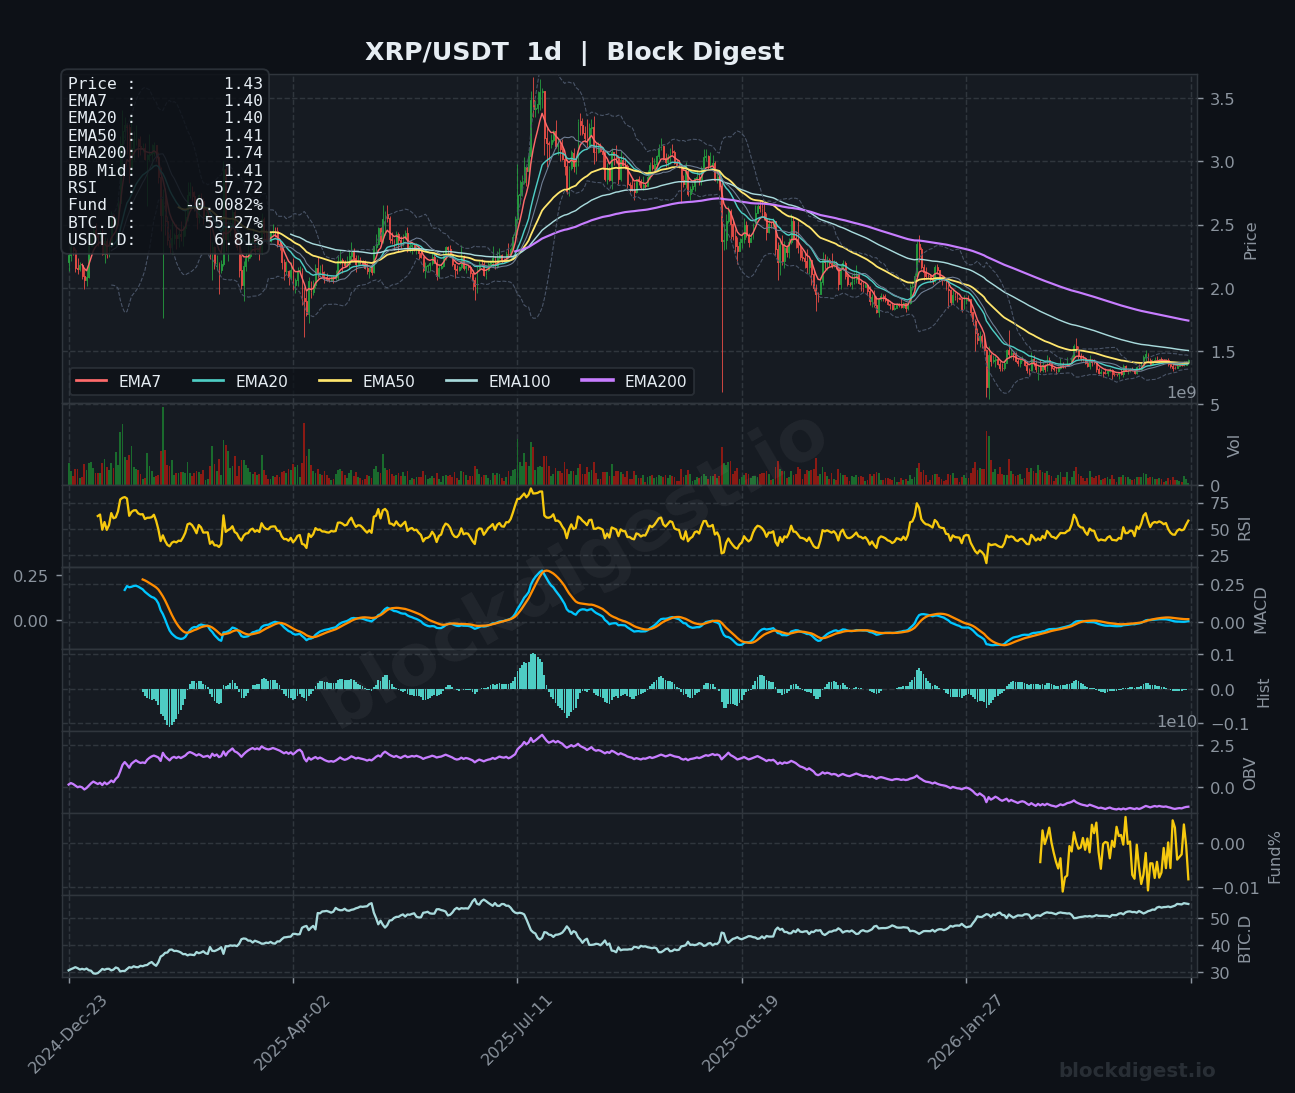
XRP has pushed to $1.43, trading cleanly above its moving average structure with all key EMAs converging near the $1.40-$1.41 zone. The 1-hour chart displays an RSI of 70.98, signaling overbought conditions after a decisive move higher, while the MACD shows bullish momentum beginning to flatten. The 4-hour timeframe confirms the breakout structure with price above the EMA50 ($1.40) and an RSI of 68.93, though the MACD has rolled slightly bearish. On the daily chart, XRP remains in a long-term recovery pattern trading well below the EMA200 ($1.74), but with improving momentum as indicated by the RSI rising to 57.72 and MACD approaching a potential bullish crossover. The immediate bias favors consolidation between $1.38-$1.45 before the next directional move, with $1.47-$1.50 representing key resistance on any continued advance.
BNB (BNB)
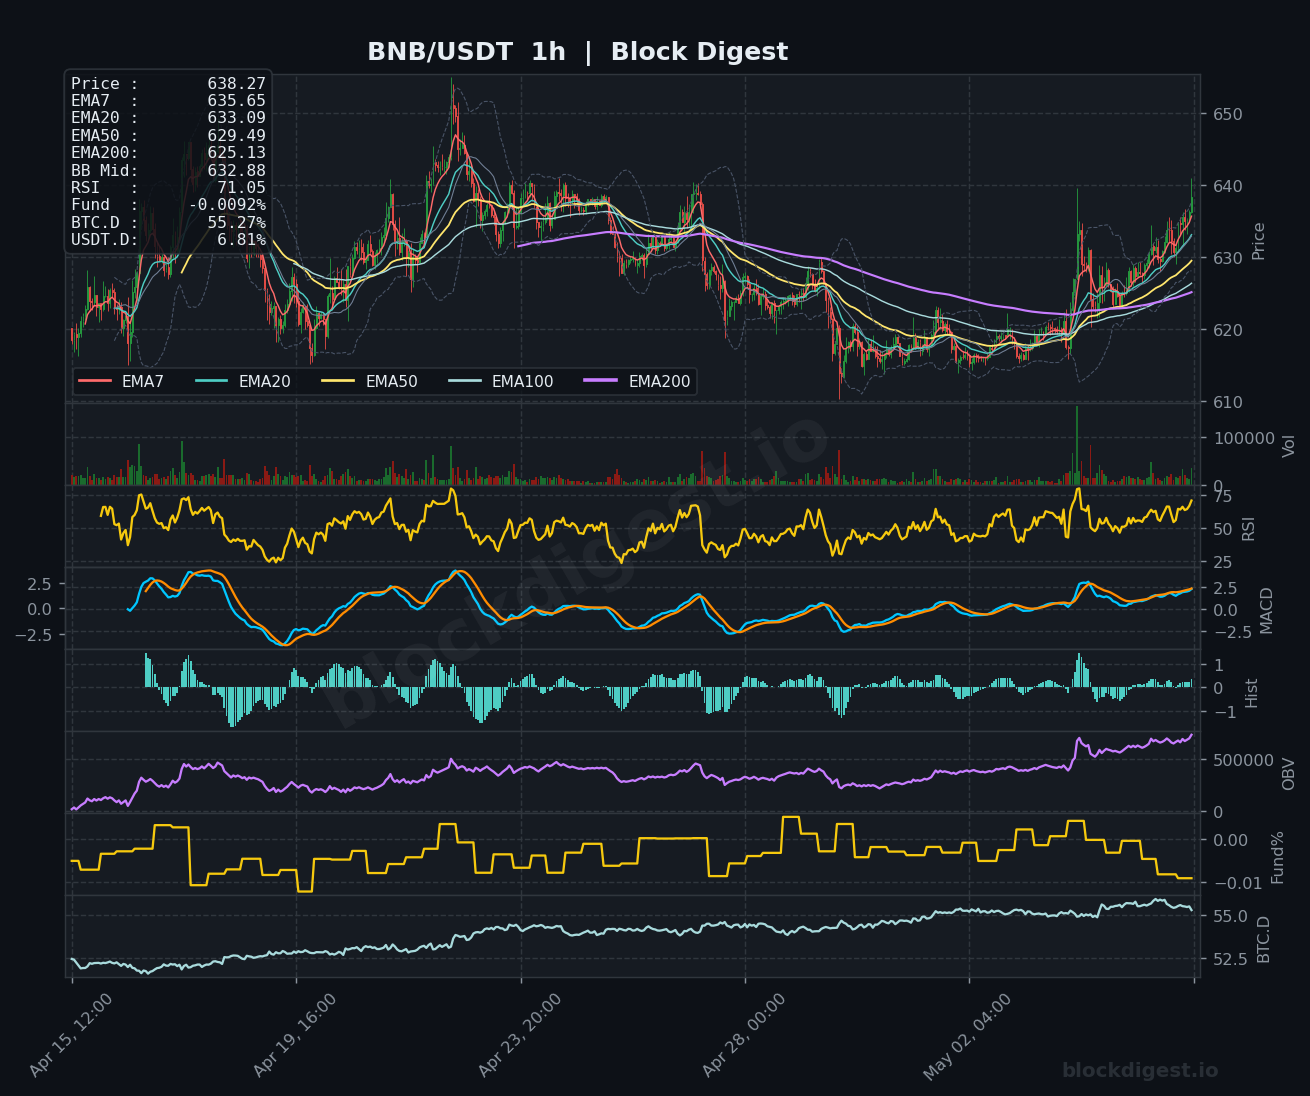
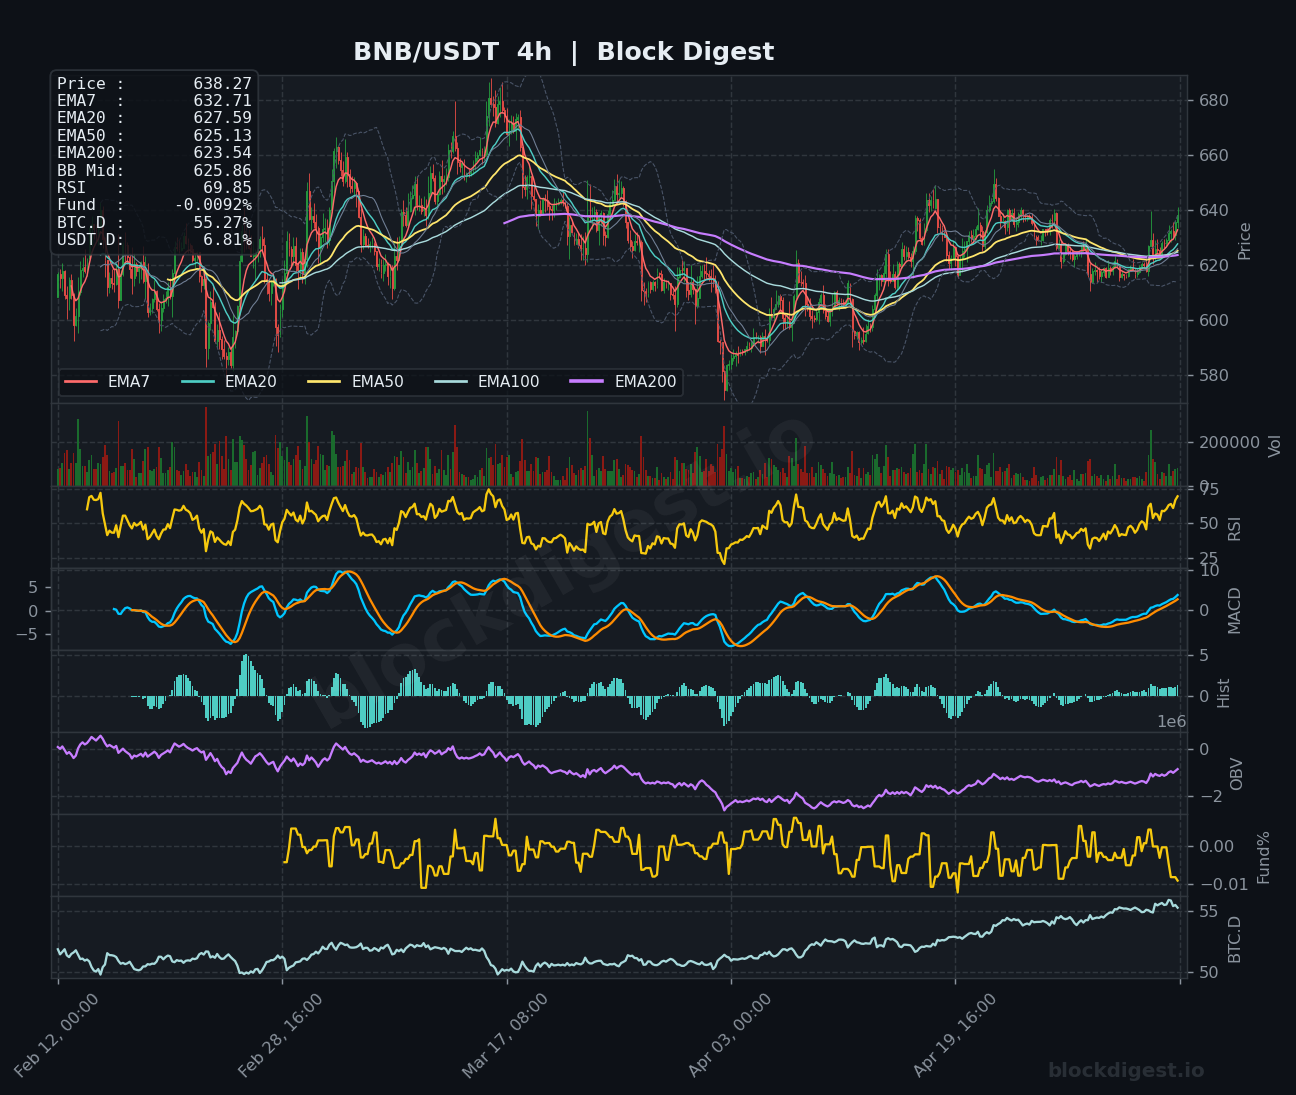
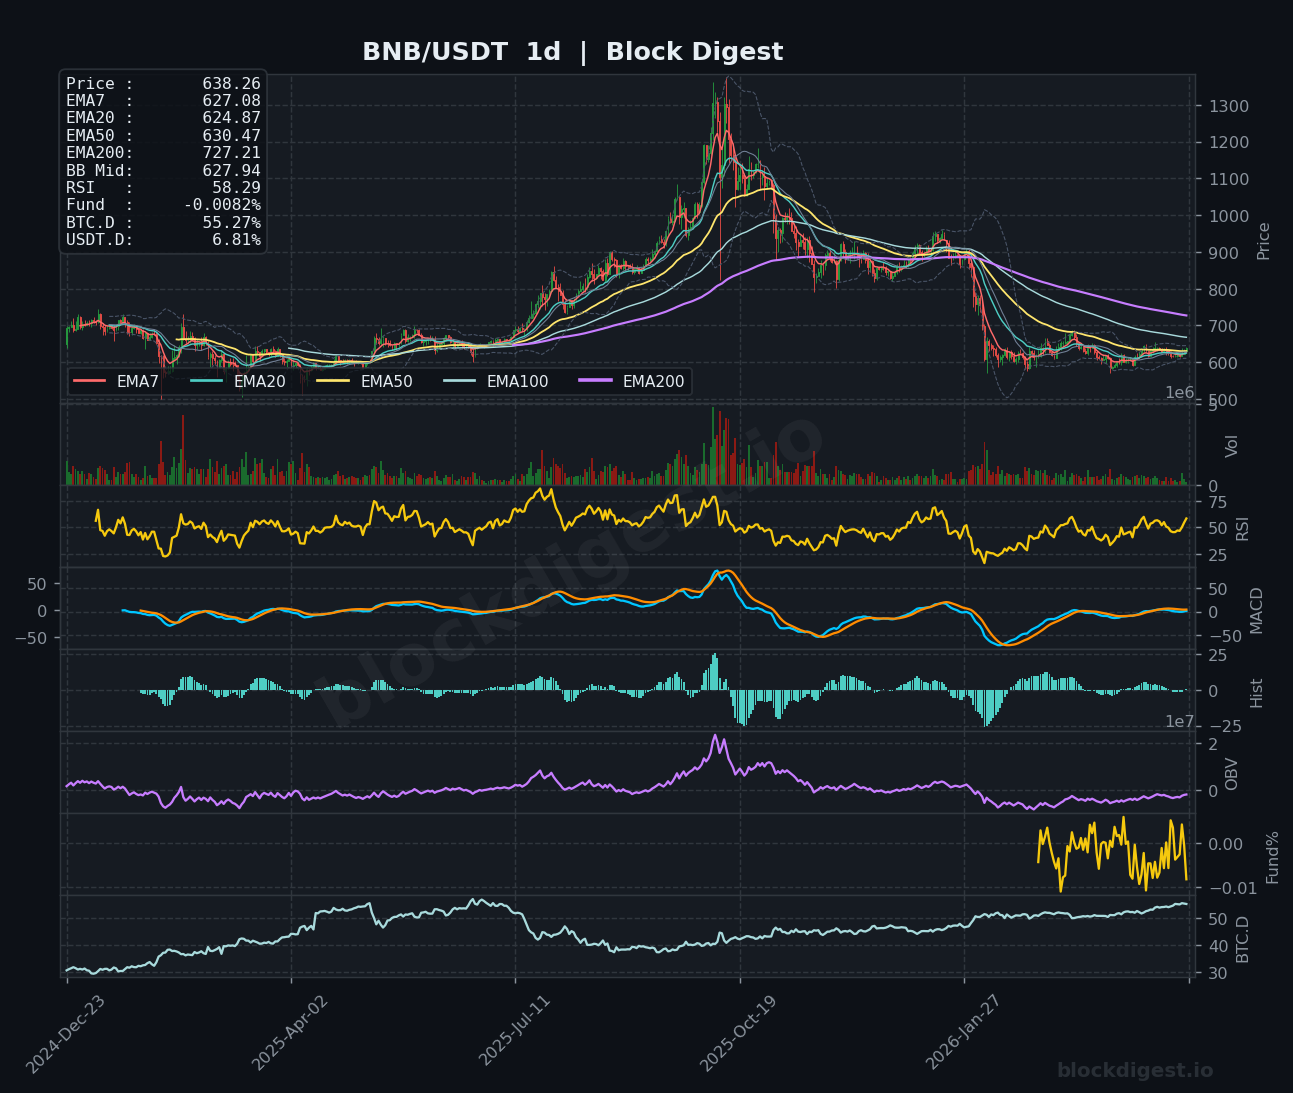
BNB currently trades at $638.27, showing resilience with price action hovering above the $625-$630 support zone. The 1-hour chart displays an RSI of 71.05 alongside price trading above the EMA7 ($635.65) and EMA20 ($633.09), indicating short-term bullish momentum despite recent choppiness. The 4-hour perspective shows BNB recovering from a recent dip, with the RSI at 69.85 and MACD turning positive, while price has reclaimed the EMA50 ($625.13). The daily timeframe reveals a more concerning picture with BNB trading well below the EMA200 ($727.21) and an extremely oversold RSI of 58.29 reflecting the extended decline from higher levels. Near-term bias tilts neutral-to-bullish as long as $620 holds, with initial resistance at $645-$650 capping upside attempts.
Dogecoin (DOGE)
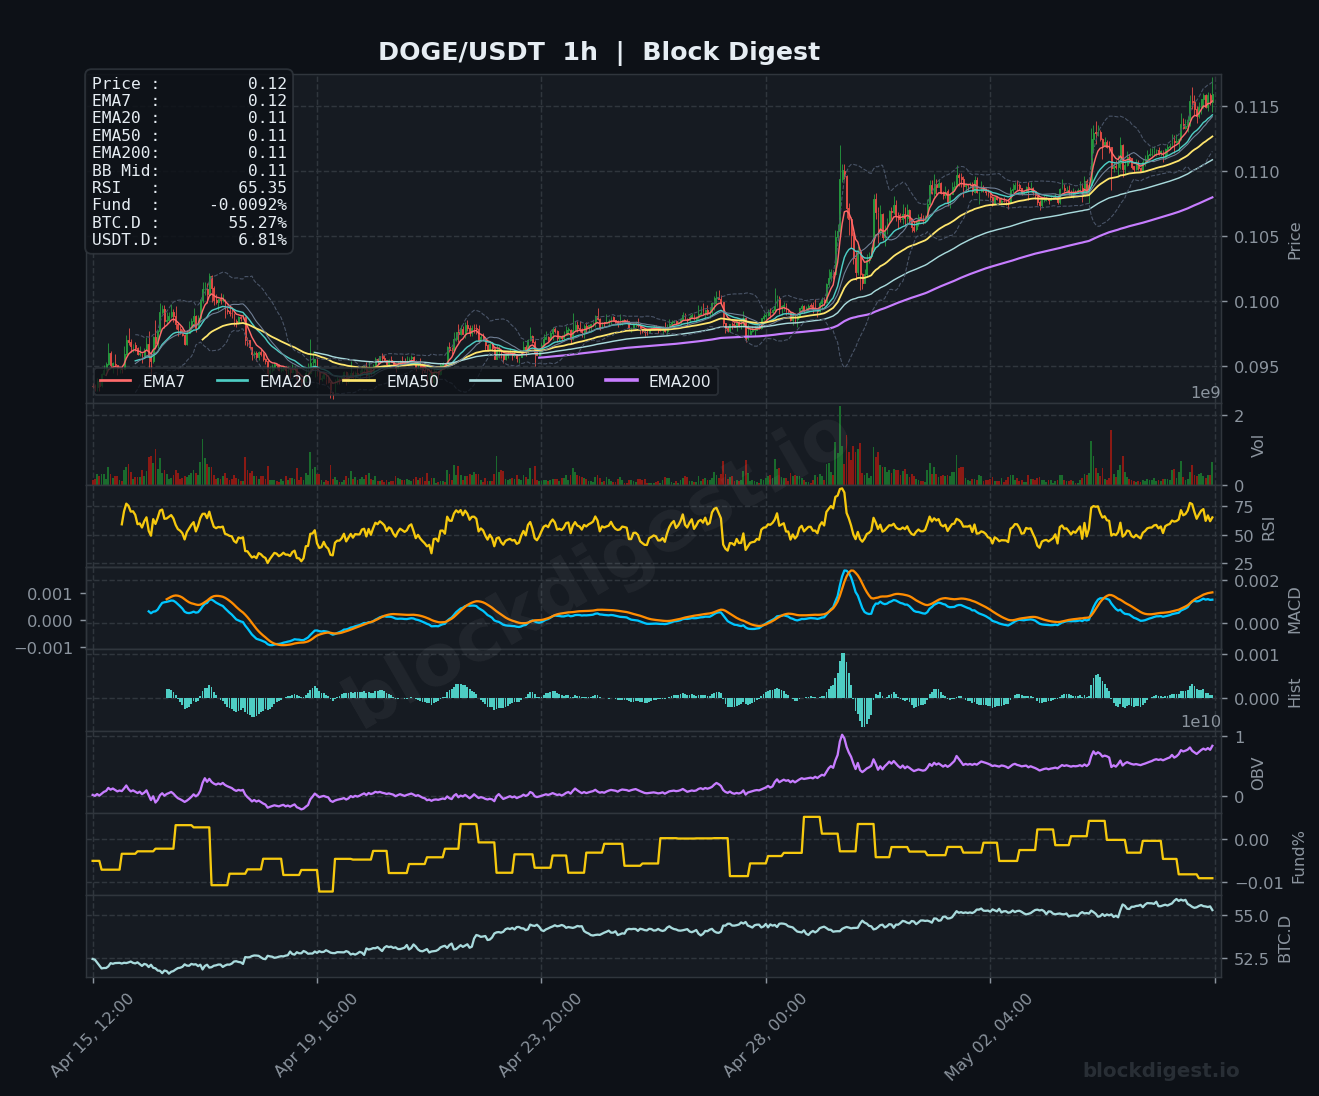
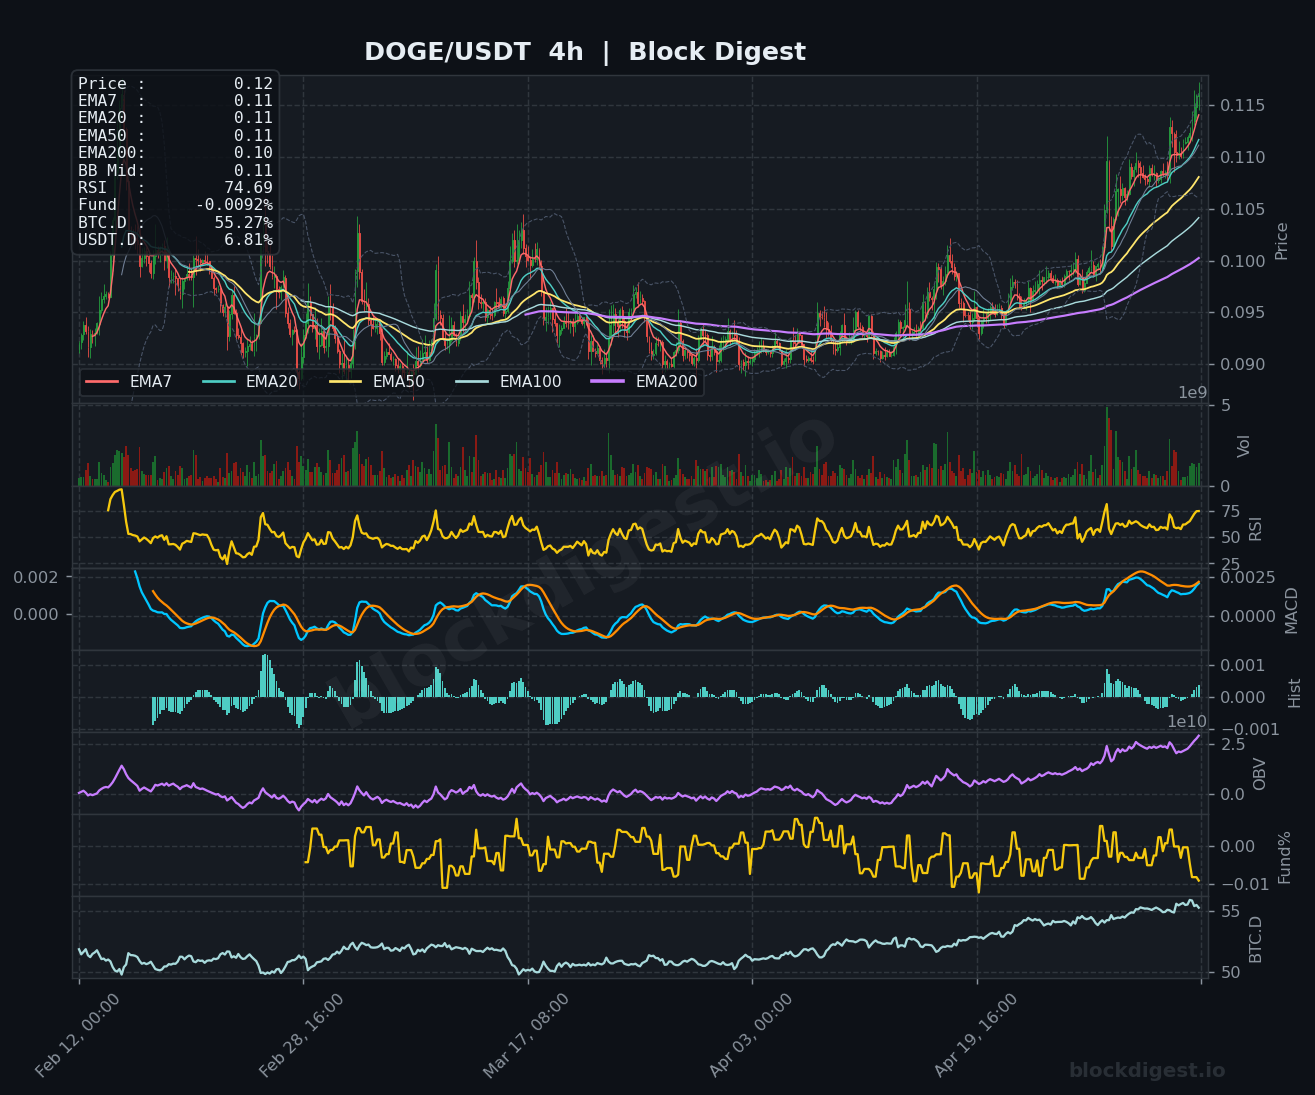
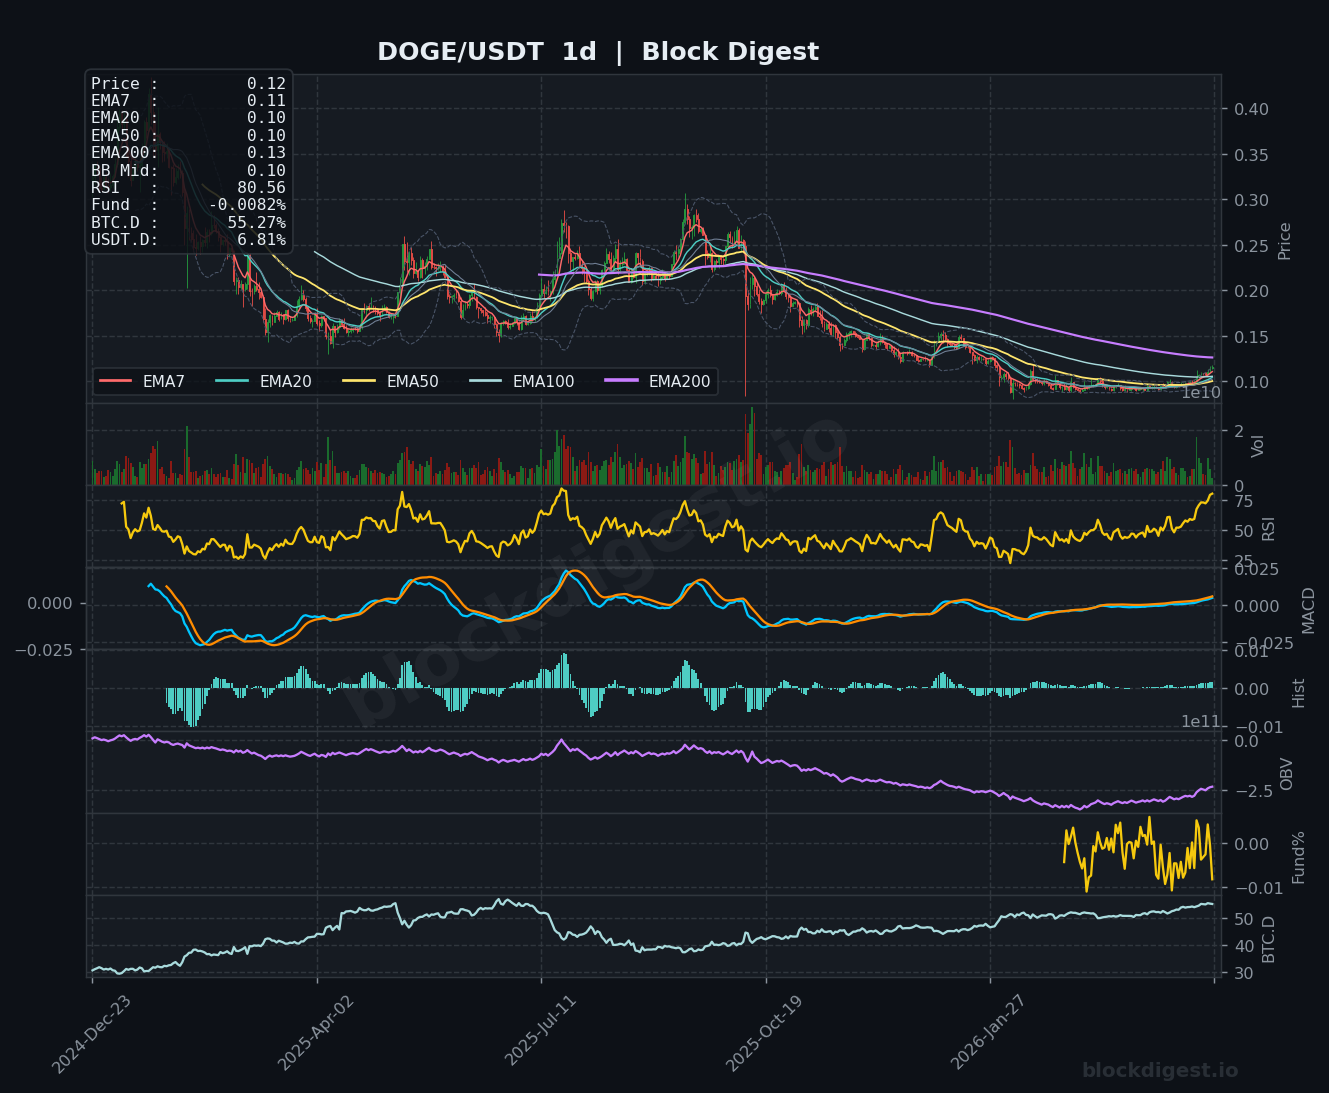
DOGE trades at $0.1200, extending its impressive recovery from long-term lows with a clean breakout structure. The 1-hour chart shows price firmly above all moving averages with an RSI of 65.35, indicating healthy bullish momentum without excessive overextension. On the 4-hour timeframe, DOGE displays textbook uptrend characteristics with rising EMAs and an RSI of 74.69, though this elevated reading suggests caution for new entries. The daily chart reveals the most compelling setup with DOGE breaking above the EMA200 ($0.1300) area and posting an RSI of 80.56, reflecting strong buying interest but also signaling near-term exhaustion risk. The bullish bias remains intact with support at $0.1150-$0.1170, though a consolidation phase would be healthy given the extended rally and overbought daily conditions.
Litecoin (LTC)
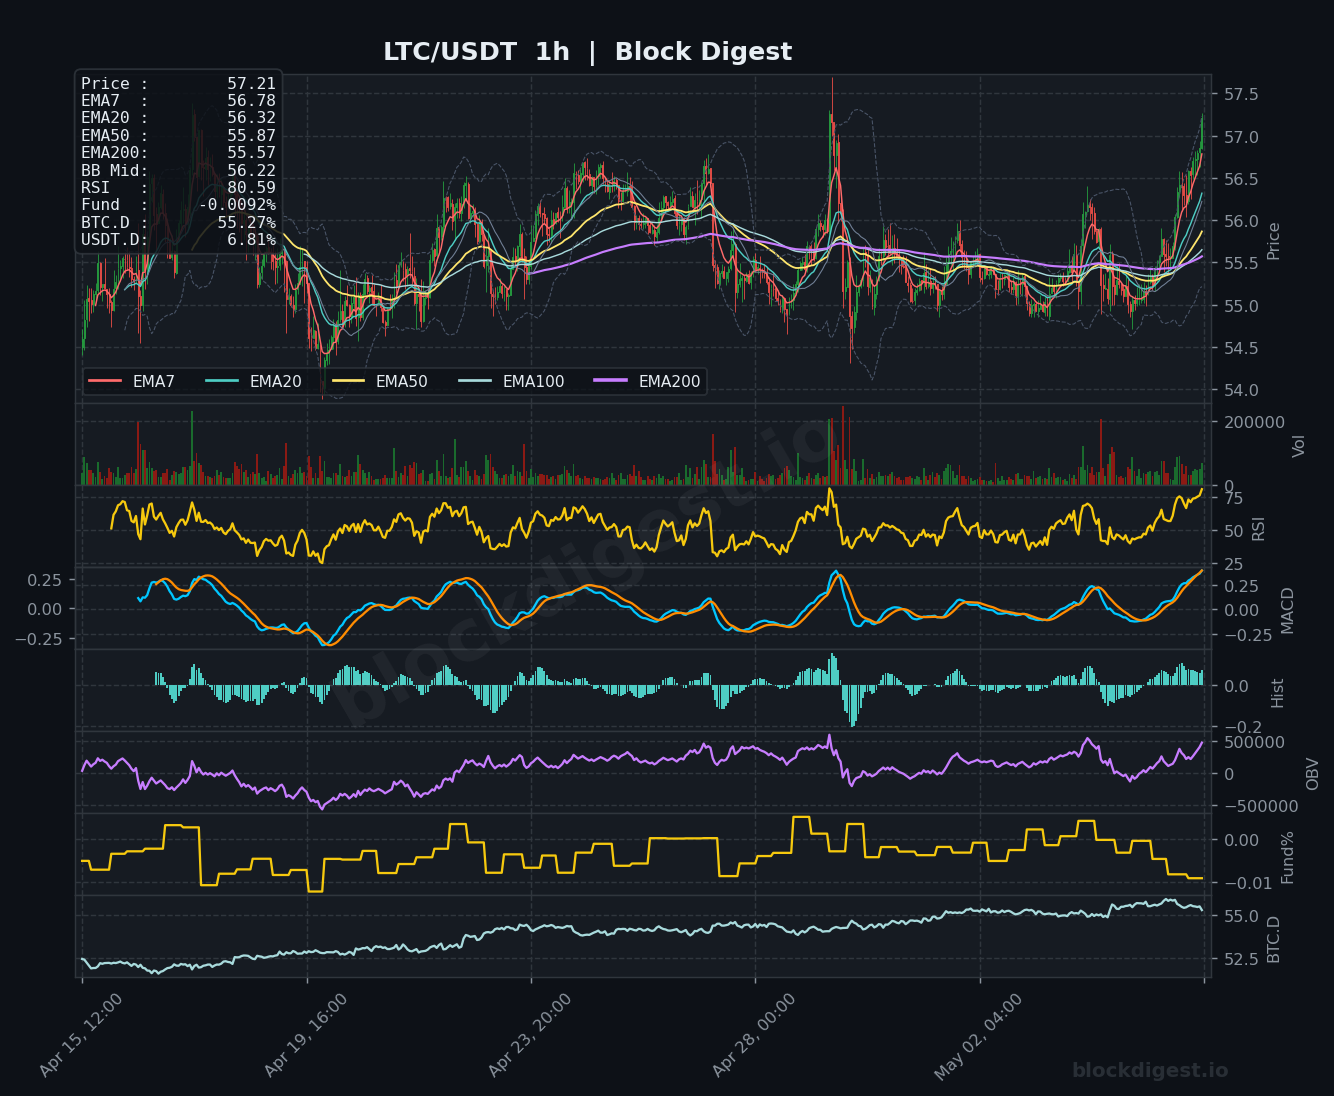
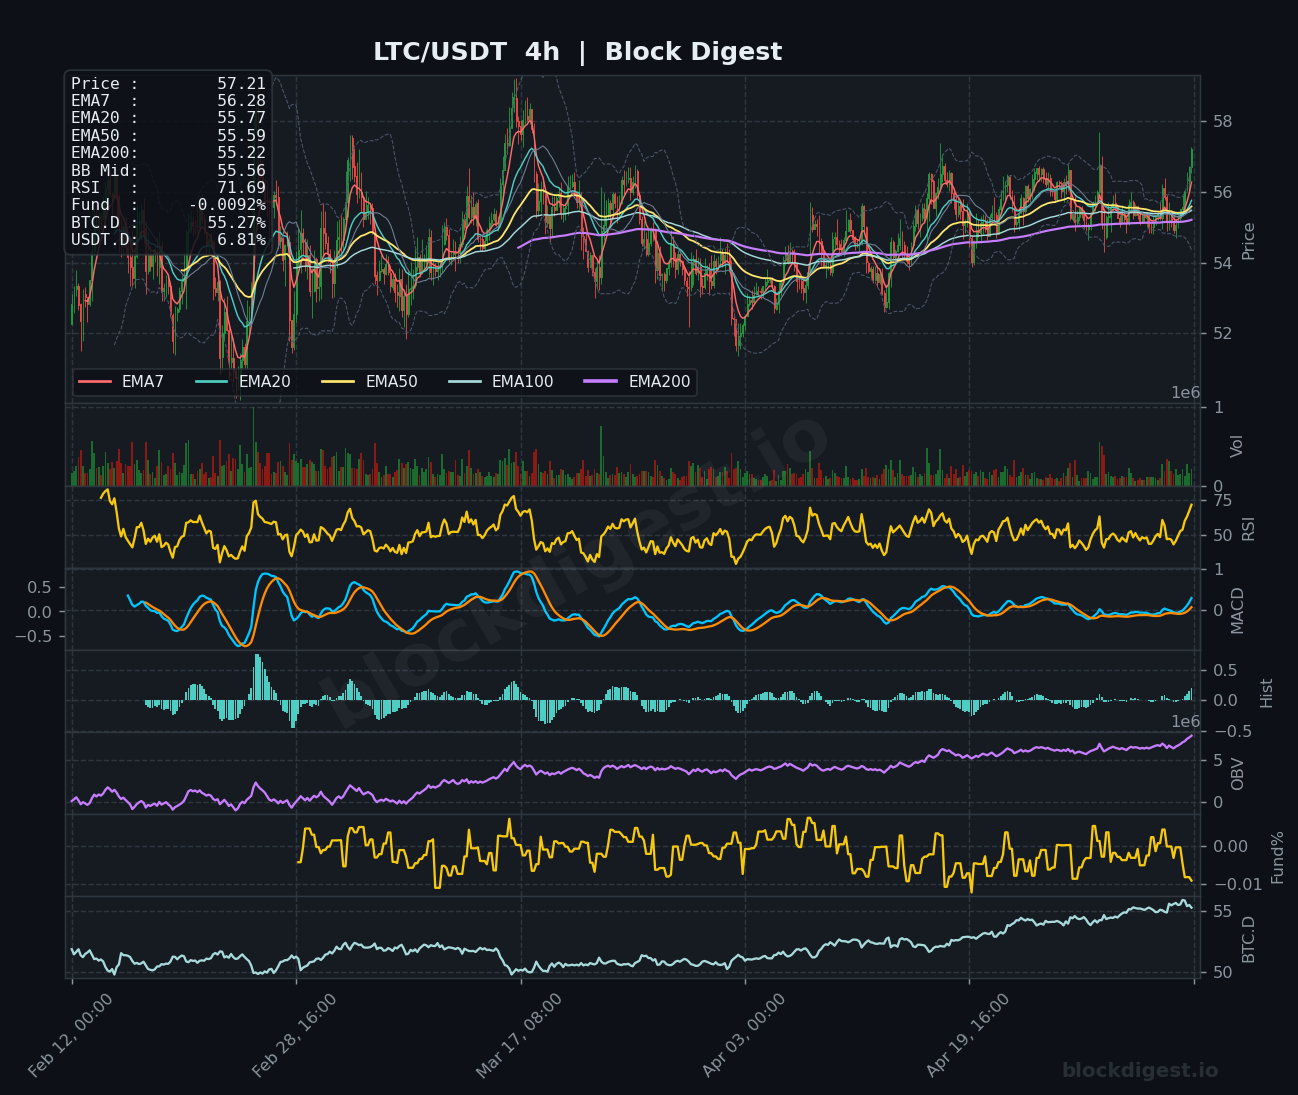
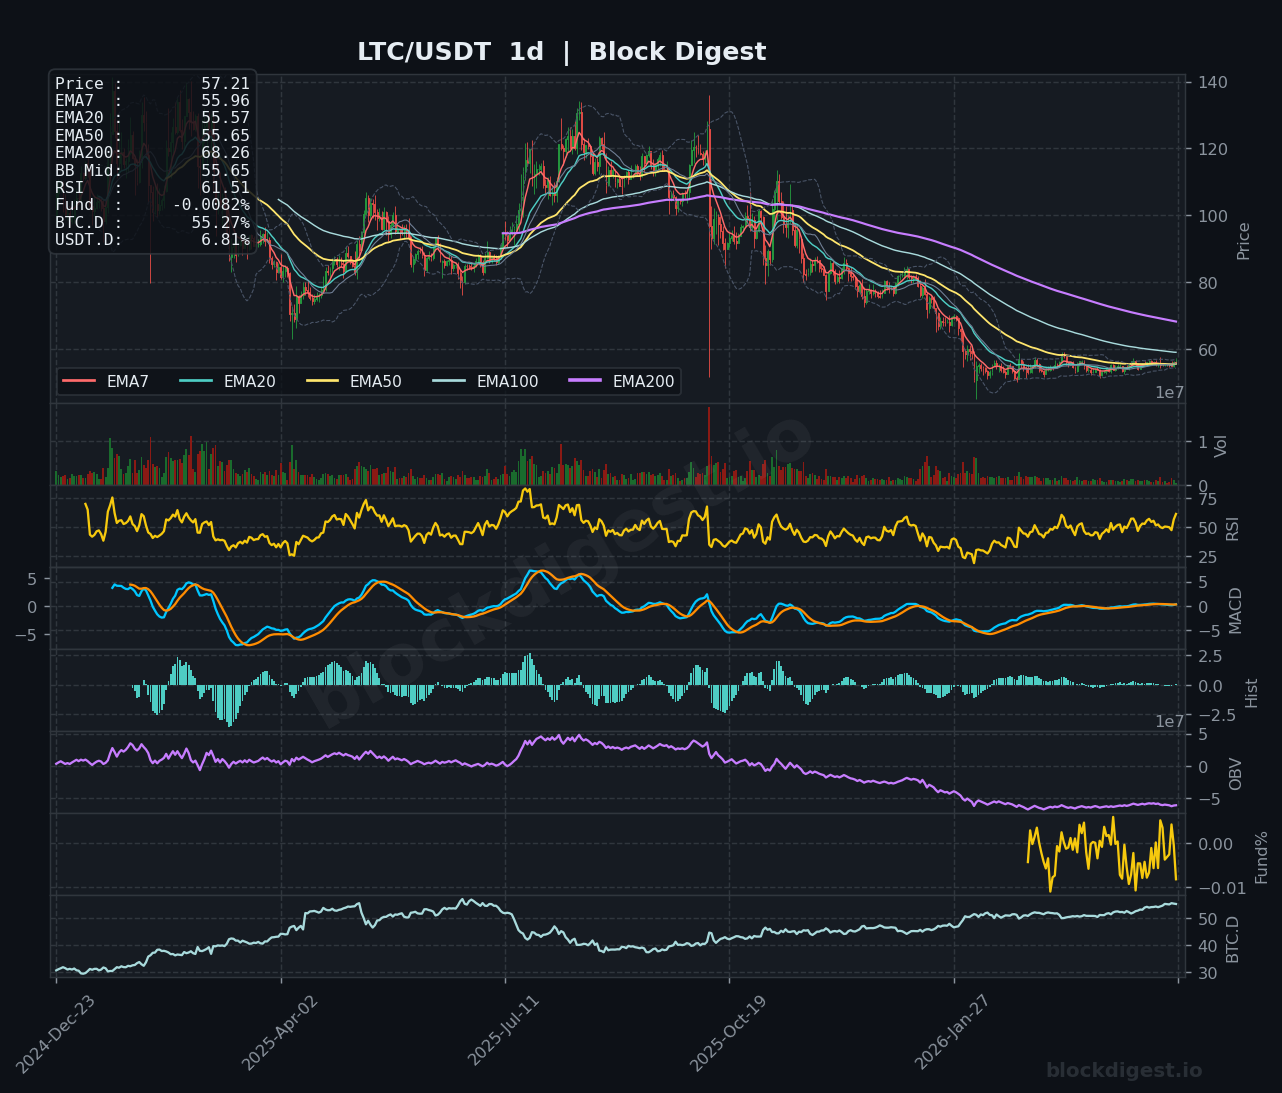
LTC trades at $57.21, maintaining a tight range near its short-term moving average cluster. The 1-hour chart shows price oscillating around the EMA7 ($56.78) and EMA20 ($56.32) with an RSI of 80.59, indicating significantly overbought conditions following recent volatility. The 4-hour perspective displays improving structure with LTC above the EMA50 ($55.59) and an RSI of 71.69, though the MACD shows fading momentum. On the daily timeframe, LTC remains in a prolonged downtrend trading well below the EMA200 ($68.26), with an RSI of 61.51 suggesting modest recovery momentum but still lacking conviction. The immediate outlook is neutral with a slight bearish lean, as LTC faces resistance at $58.00-$58.50 while support rests at $55.50-$56.00.
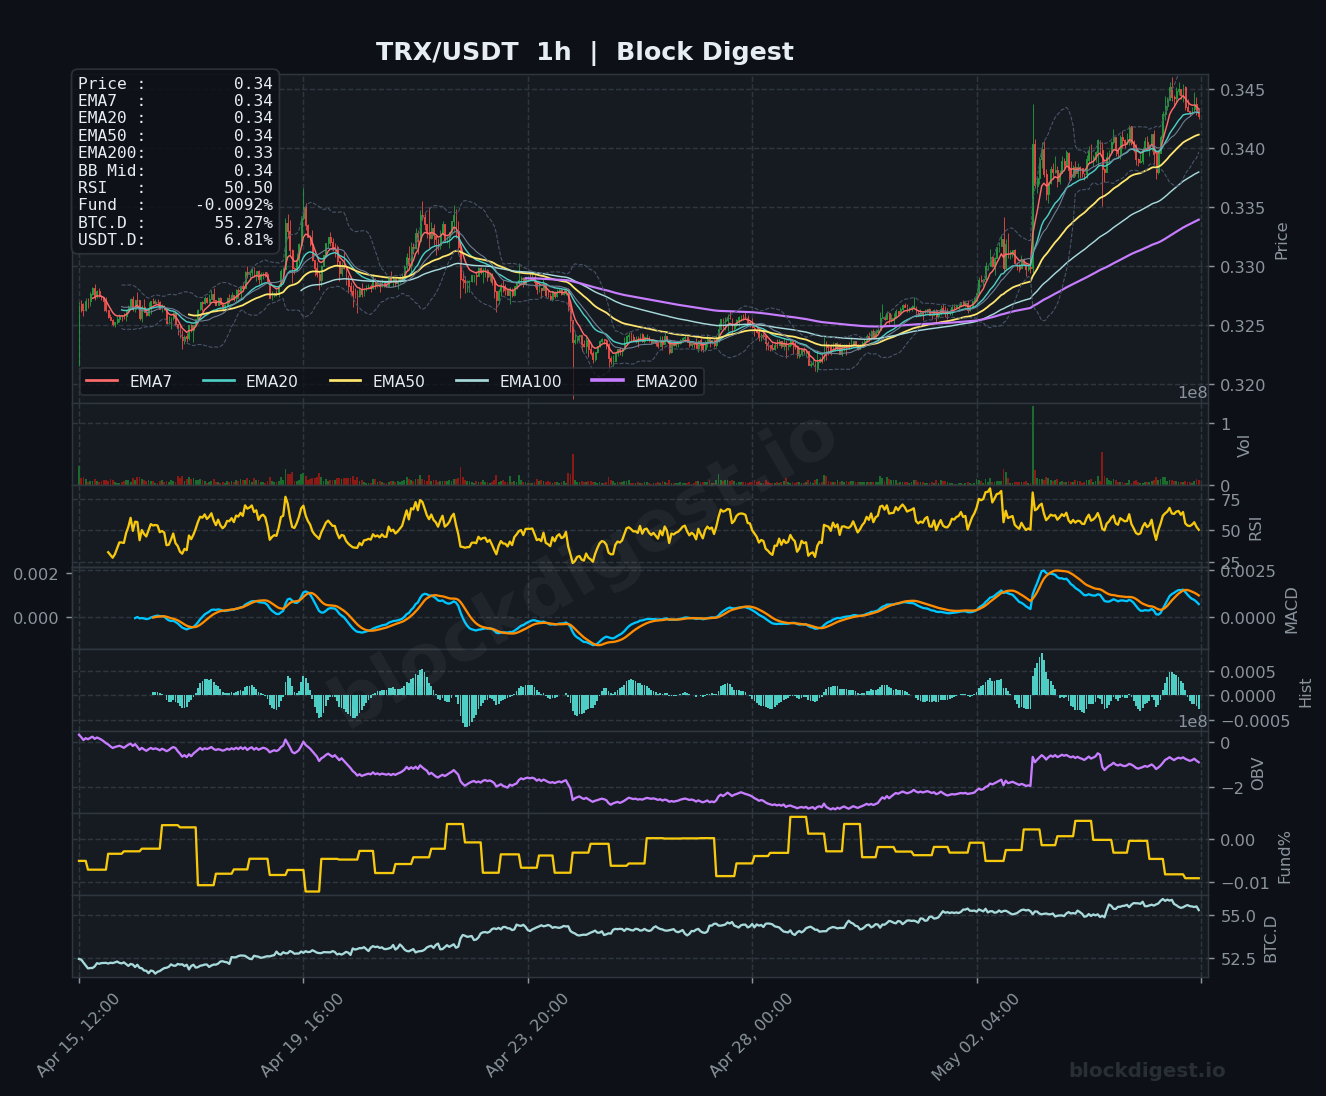
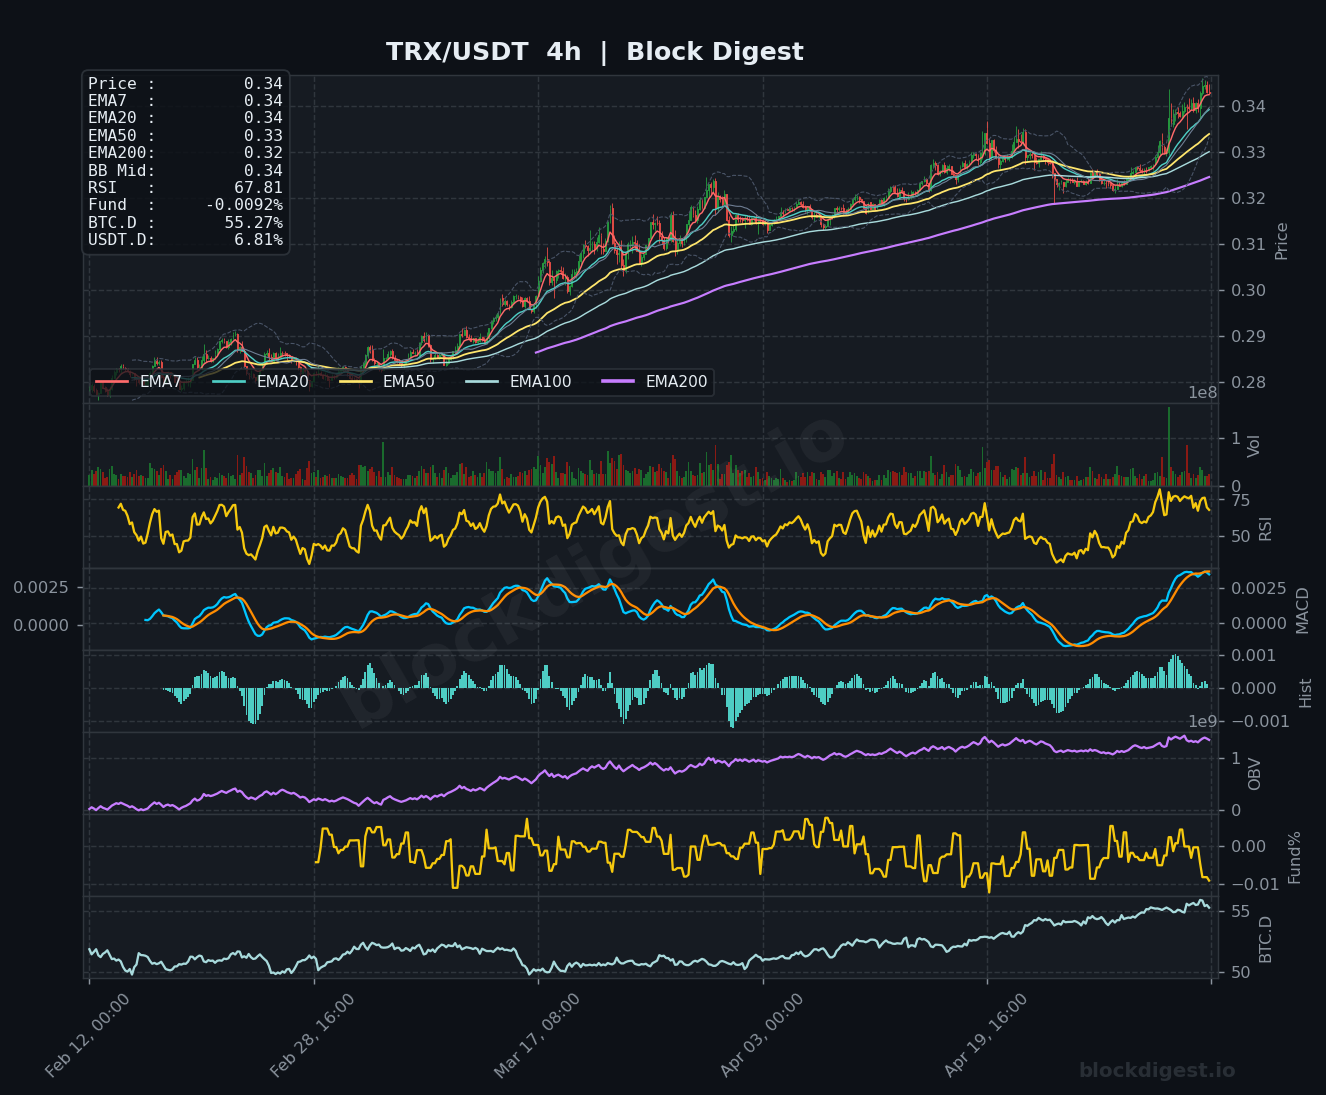
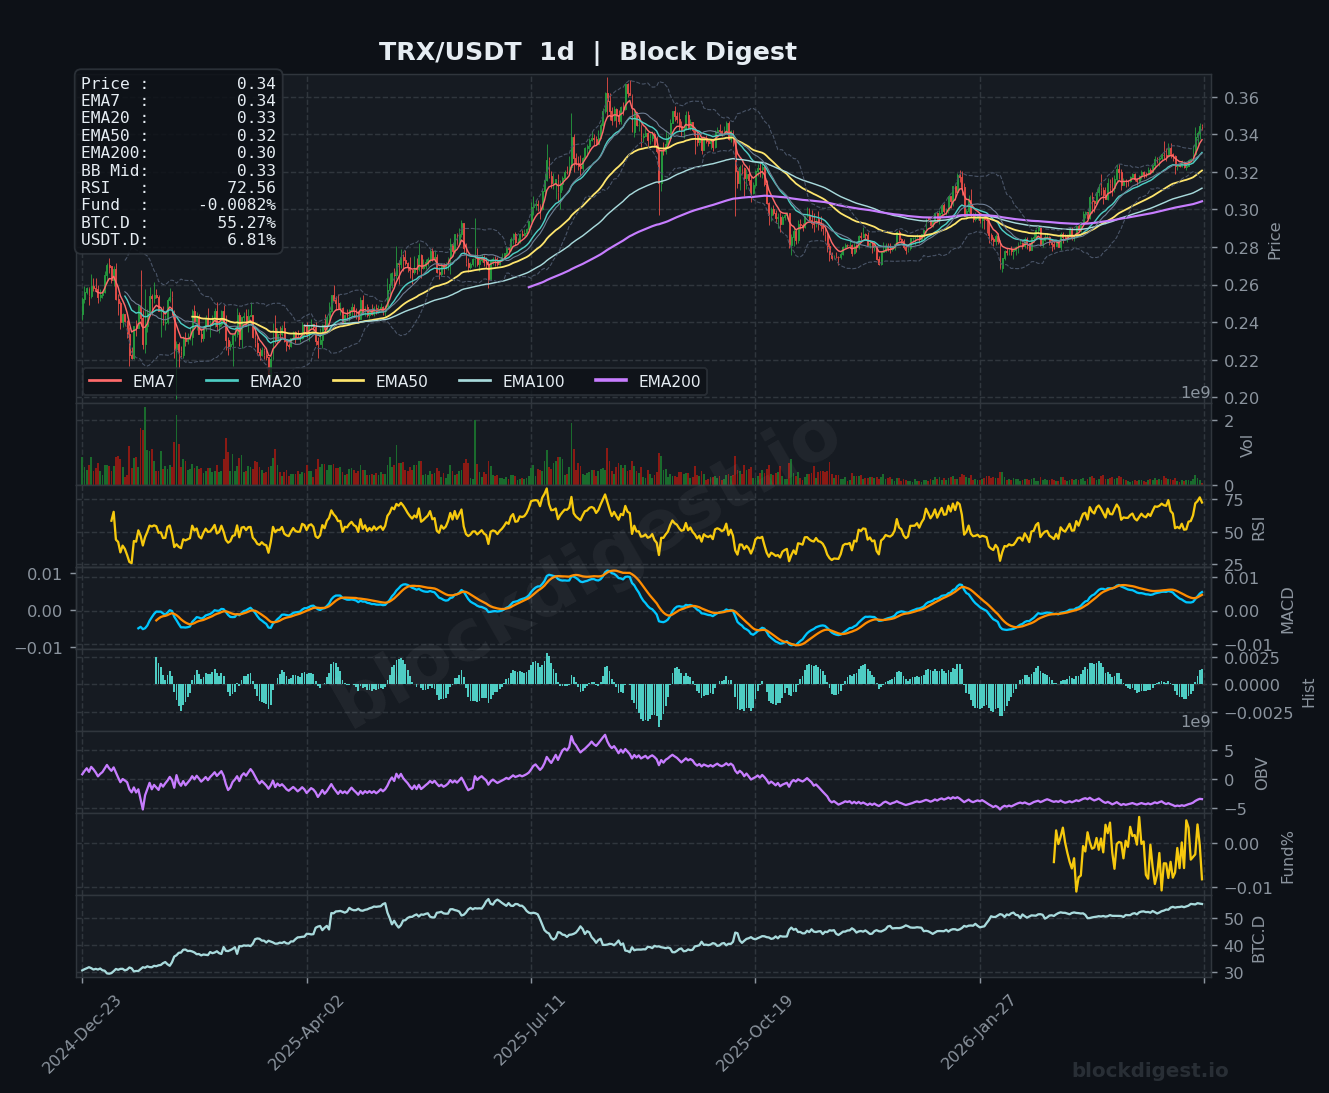
TRON (TRX)
TRX trades at $0.3400, demonstrating notable relative strength with a clean uptrend structure across multiple timeframes. The 1-hour chart shows price experiencing a pullback after touching recent highs, with the RSI at 50.50 indicating neutral momentum and price testing the EMA20 ($0.3400) as support. The 4-hour view confirms the uptrend remains intact with TRX above the rising EMA50 ($0.3300) and an RSI of 67.81, while the MACD recently turned positive following a bullish crossover. The daily chart presents a constructive picture with TRX trading above its EMA50 ($0.3200) and showing an RSI of 72.56, reflecting strong but not yet exhausted momentum. The bias favors continued strength toward $0.3500-$0.3550 resistance, with the $0.3350-$0.3380 zone providing near-term support on any dips.
Altcoin Outlook
The altcoin market presents a selective environment with DOGE and TRX displaying the strongest technical setups characterized by clean uptrends and improving momentum, while SOL and XRP show constructive patterns but face near-term overbought conditions requiring consolidation. BNB and LTC remain the weakest relative performers, still trapped in longer-term downtrends despite modest recent recoveries. Traders should monitor Bitcoin dominance near 55% and USDT dominance around 6.8% as key barometers for broader altcoin market participation, with the current readings suggesting controlled risk appetite rather than euphoric alt season conditions.
Disclaimer: This analysis is for informational purposes only and does not constitute financial advice. Cryptocurrency markets are highly volatile and unpredictable. All trading decisions should be made based on your own research and risk tolerance. Block Digest is not responsible for any financial losses incurred as a result of acting on this content.