ETH Daily Analysis — May 08, 2026
ETH Daily Analysis – May 08, 2026
Market Overview
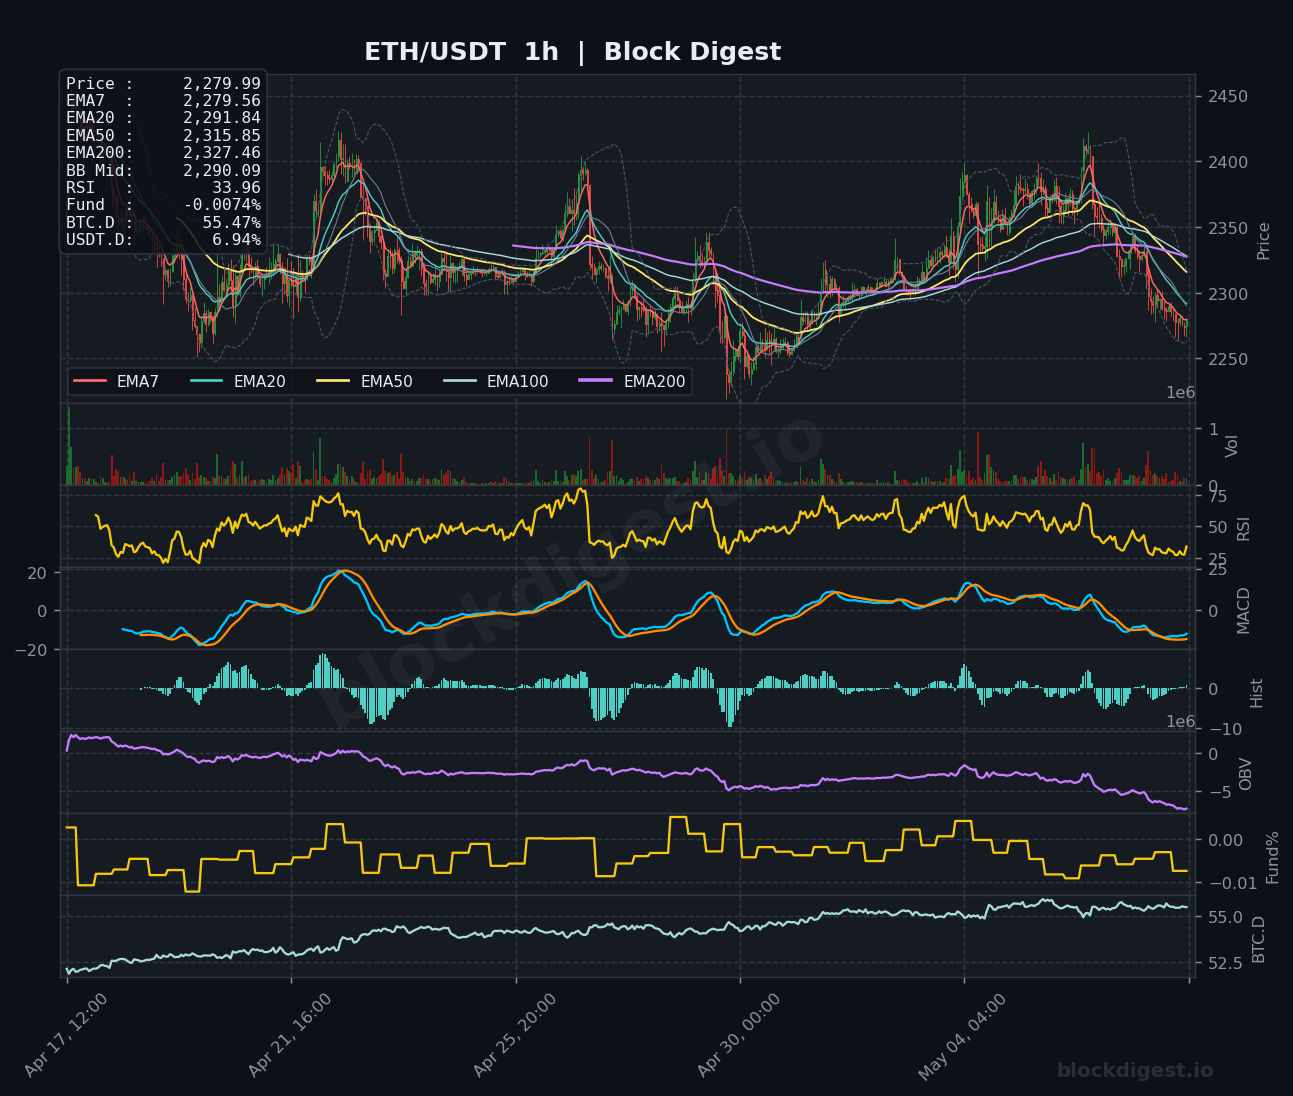
Ethereum is trading at $2,280.01, caught in a precarious technical position as price has broken below all major short-term EMAs and is now testing critical support zones. The daily chart reveals a concerning bearish structure with price trading below the EMA7 ($2,310.81), EMA20 ($2,303.28), and EMA50 ($2,263.76), while the EMA200 at $2,593.84 looms far overhead as a distant resistance. The Bollinger Band middle line at $2,312.95 has been decisively rejected, and price action is compressing toward the lower band, suggesting continued downside pressure. The dominant daily trend remains bearish, with lower highs and lower lows forming since the late April rejection near $2,430.
Multi-Timeframe Confluence
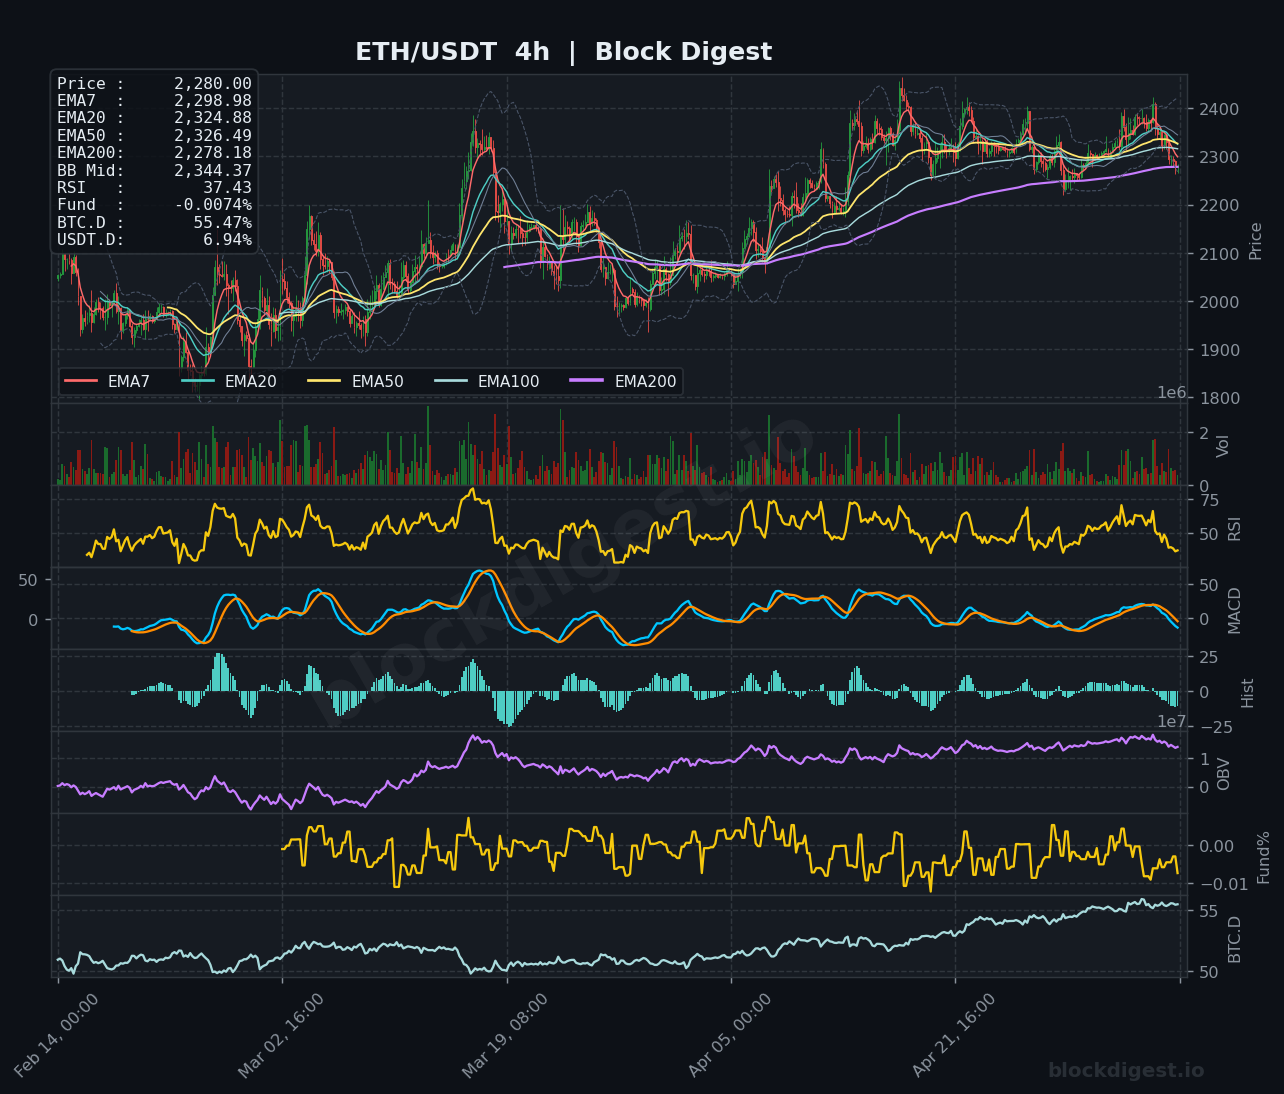
A pronounced bearish alignment exists across all three timeframes, creating significant downside risk. The 1-hour chart shows price trading below all EMAs with the EMA7 at $2,279.56 acting as immediate overhead resistance, while the 4-hour timeframe mirrors this weakness with price at $2,280.00 sitting below the EMA7 ($2,298.98) and failing to reclaim the EMA20 ($2,324.88). The daily structure confirms this bearish momentum, establishing $2,263-$2,278 as a critical support confluence where the daily EMA50 meets recent swing lows. Short-term momentum is clearly contradicting any higher timeframe recovery hopes, with all three timeframes showing EMA compression in a bearish configuration and price unable to establish a foothold above even the fastest-moving averages.
Key Levels to Watch
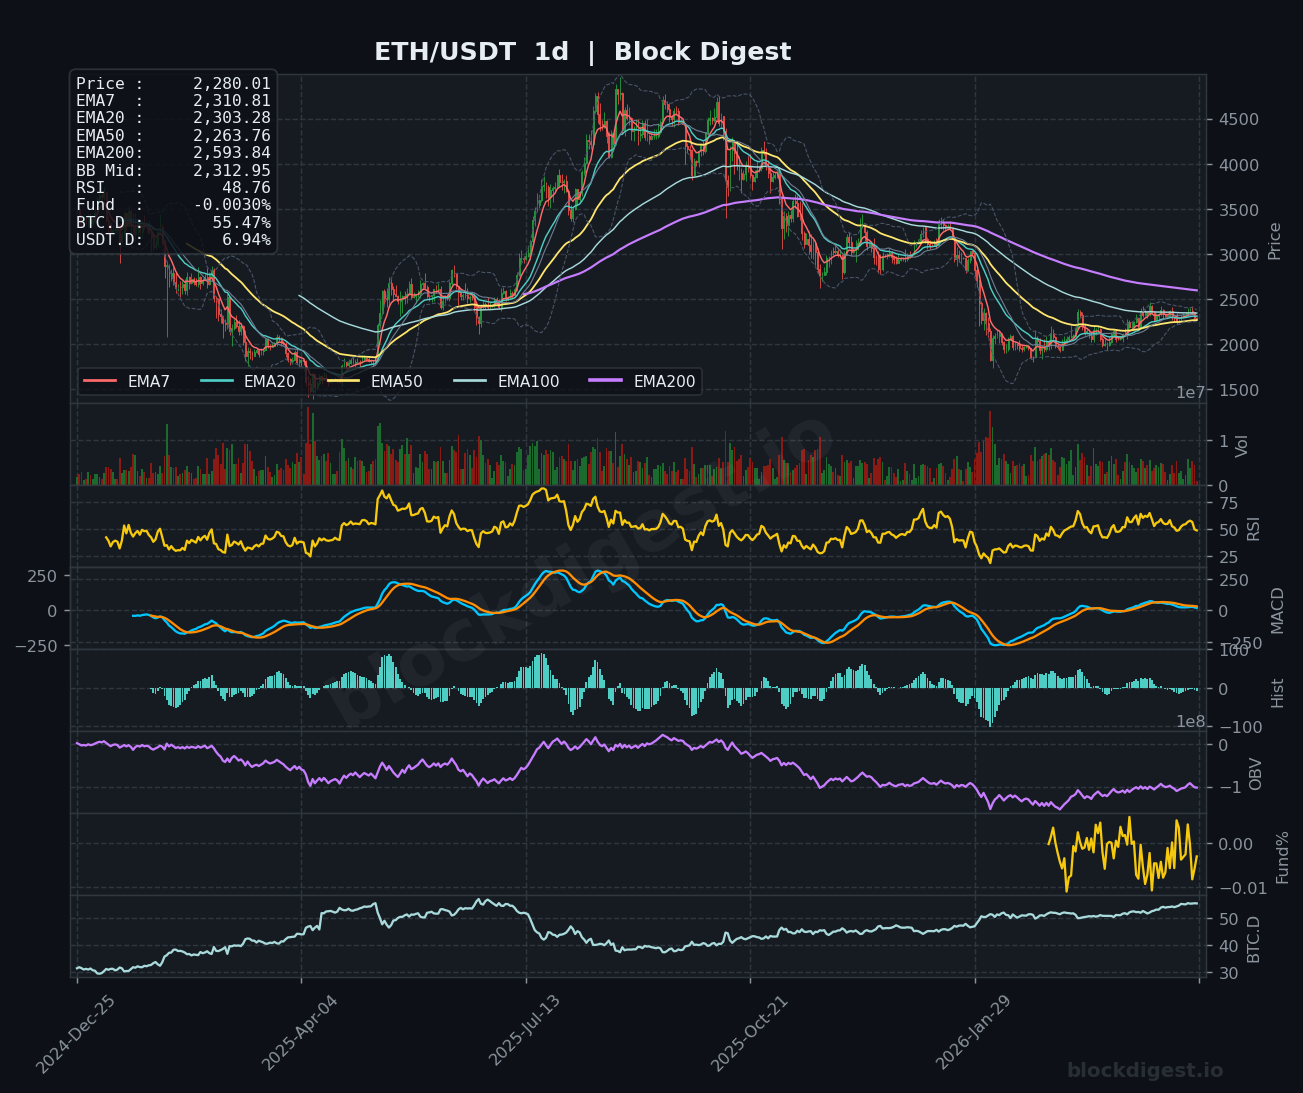
Resistance:
- $2,315-$2,327: Immediate resistance zone encompassing the 1h EMA50 ($2,315.85), 4h EMA50 ($2,326.49), and the Bollinger Band midlines across multiple timeframes
- $2,344-$2,350: Secondary resistance cluster at the 4h BB Mid ($2,344.37) and recent lower high structure
- $2,400-$2,430: Major resistance zone marking the prior range high and psychological level where significant selling pressure emerged
Support:
- $2,263-$2,278: Critical support confluence of the daily EMA50 ($2,263.76), 4h EMA200 ($2,278.18), and recent swing lows
- $2,200-$2,220: Secondary support zone representing the lower Bollinger Band on the 4h timeframe and psychological round number
- $2,150-$2,180: Major support area marking multi-month lows and potential demand zone from earlier 2026 consolidation
Momentum & On-Chain Signals
Momentum indicators are painting a uniformly bearish picture across all timeframes. The 1-hour RSI at 33.96 is approaching oversold territory but has yet to show bullish divergence, while the 4-hour RSI at 37.43 suggests further downside room before reaching extreme oversold conditions. The daily RSI at 48.76 is decisively below the neutral 50 level, confirming bearish momentum control. MACD across all timeframes shows bearish crossovers with histogram bars declining, particularly pronounced on the 4h chart where both MACD lines are trending downward in negative territory. OBV readings show deteriorating volume support, with the indicator making lower lows alongside price, indicating genuine distribution rather than a mere correction. Critically, the Funding Rate at -0.0074% on the 1h and -0.0030% on the daily reflects sustained negative funding, consistent with the broader market context of 67 consecutive days of negative funding rates—signaling persistent bearish positioning and lack of leverage demand for longs.
BTC Dominance & Market Sentiment
Bitcoin Dominance at 55.47% remains elevated and is trending higher on the daily chart, indicating continued capital rotation away from altcoins and into Bitcoin as a relative safe haven within crypto. This elevated BTC.D level is particularly bearish for ETH, as it suggests risk-off behavior where investors prefer the perceived safety of Bitcoin over higher-beta alternatives. USDT Dominance at 6.94% is relatively stable but elevated, reflecting defensive positioning and limited appetite for risk assets. The combination of rising BTC.D and elevated USDT.D creates a challenging macro environment for Ethereum, as it faces pressure from both diminishing altcoin capital flows and overall crypto market caution.
Risk Scenarios
Bullish case: A reclaim above $2,315 with sustained hourly closes above the EMA50 cluster could trigger short-covering and attract renewed buying interest, potentially pushing ETH toward the $2,350-$2,380 resistance zone. A successful break and hold above $2,350 would negate the immediate bearish structure and open the door for a retest of $2,400, especially if accompanied by positive RSI divergence and strengthening OBV.
Bearish case: Failure to hold the $2,263-$2,278 support confluence would confirm daily EMA50 breakdown and likely accelerate selling toward $2,200, with potential for a capitulation move to $2,150-$2,180. A sustained break below the daily EMA50 with increasing volume would signal deeper technical damage and align with the broader narrative of waning demand reflected in negative funding rates and declining spot ETF inflows.
Outlook
The technical setup favors continued downside or consolidation in the near term, with the path of least resistance pointing lower unless bulls can swiftly reclaim $2,315-$2,327. The critical trigger to watch over the next 24-48 hours is whether ETH can defend the $2,263-$2,278 support zone—a failure here would likely trigger stop-loss cascades and fresh selling. The daily EMA50 at $2,263.76 represents the line in the sand; losing this level would confirm trend deterioration and open the door to $2,200. Conversely, only a decisive reclaim of $2,350 with improving momentum indicators would shift the bias from bearish to neutral. Given the alignment of negative funding rates, elevated BTC dominance, weakening spot ETF flows, and bearish technical structure across all timeframes, traders should exercise caution and wait for clear reversal signals before establishing long positions.
Disclaimer: This analysis is for informational purposes only and does not constitute financial advice. Cryptocurrency markets are highly volatile and unpredictable. All trading decisions should be made based on your own research and risk tolerance. Block Digest is not responsible for any financial losses incurred as a result of acting on this content.