BTC Daily Analysis — May 08, 2026
BTC Daily Analysis – May 08, 2026
Market Overview
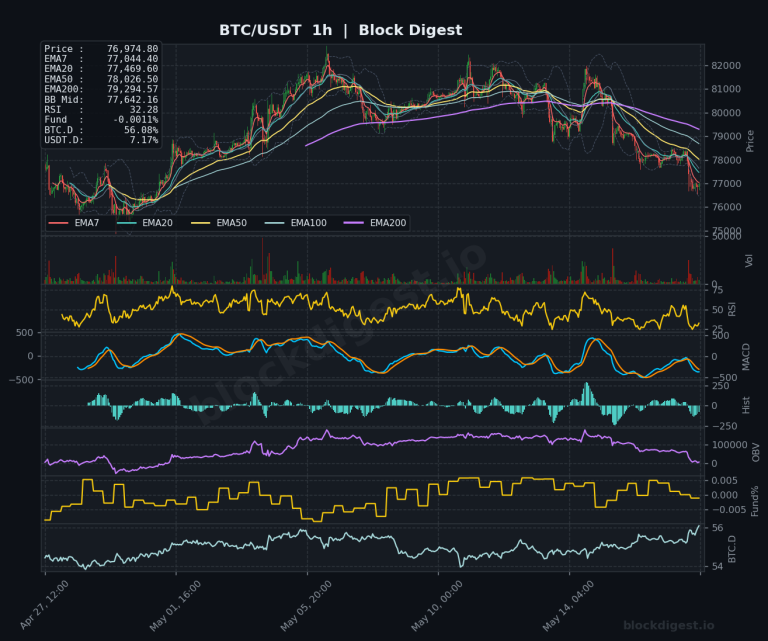
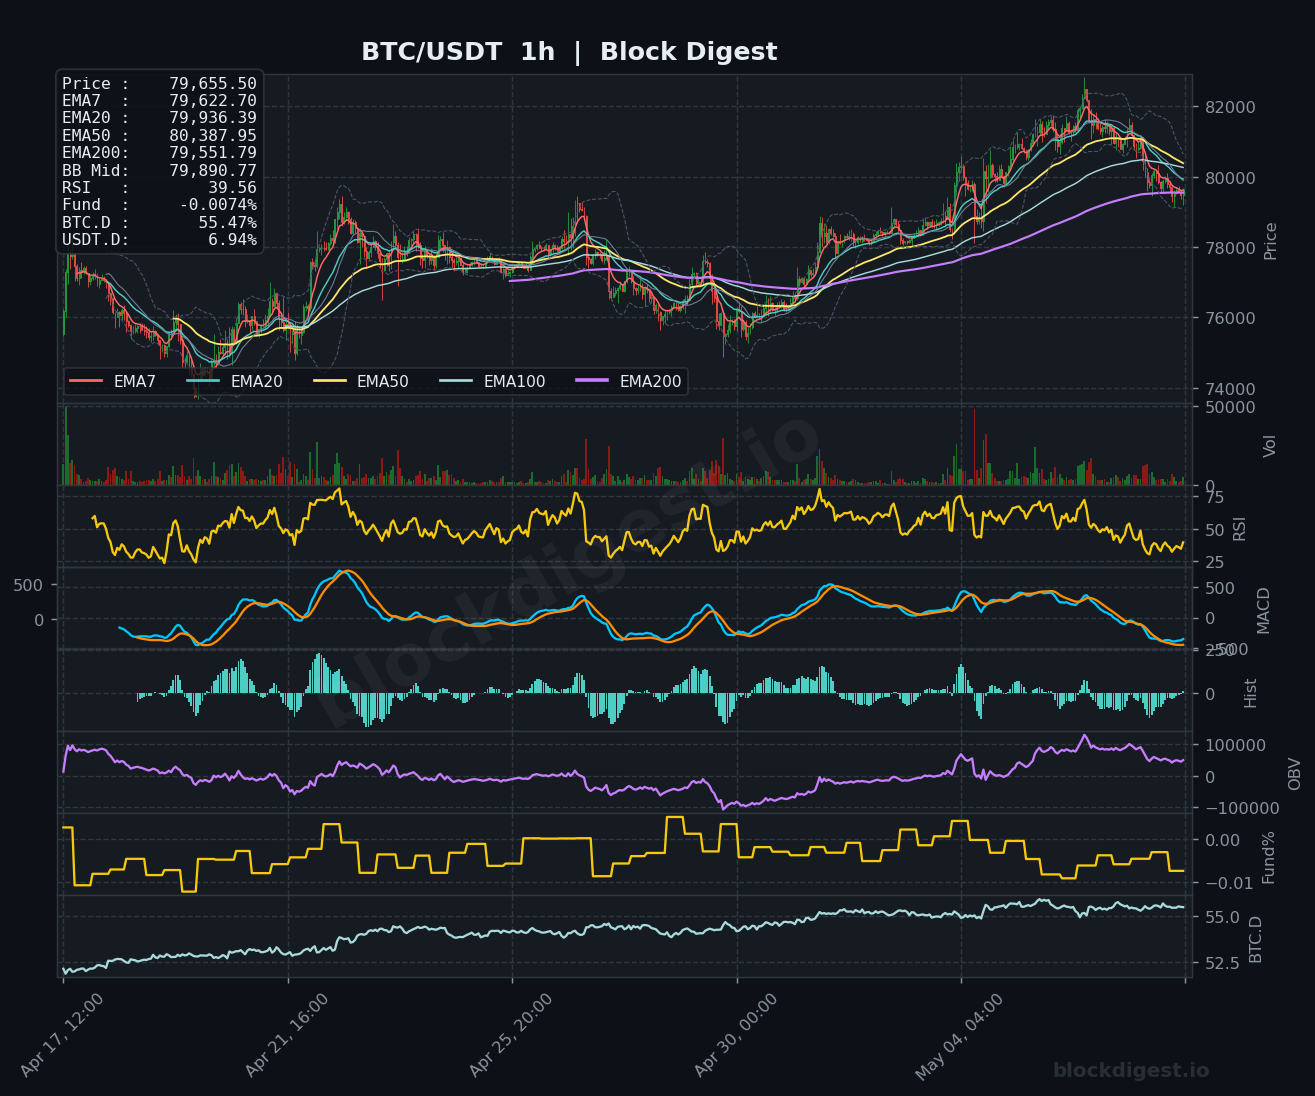
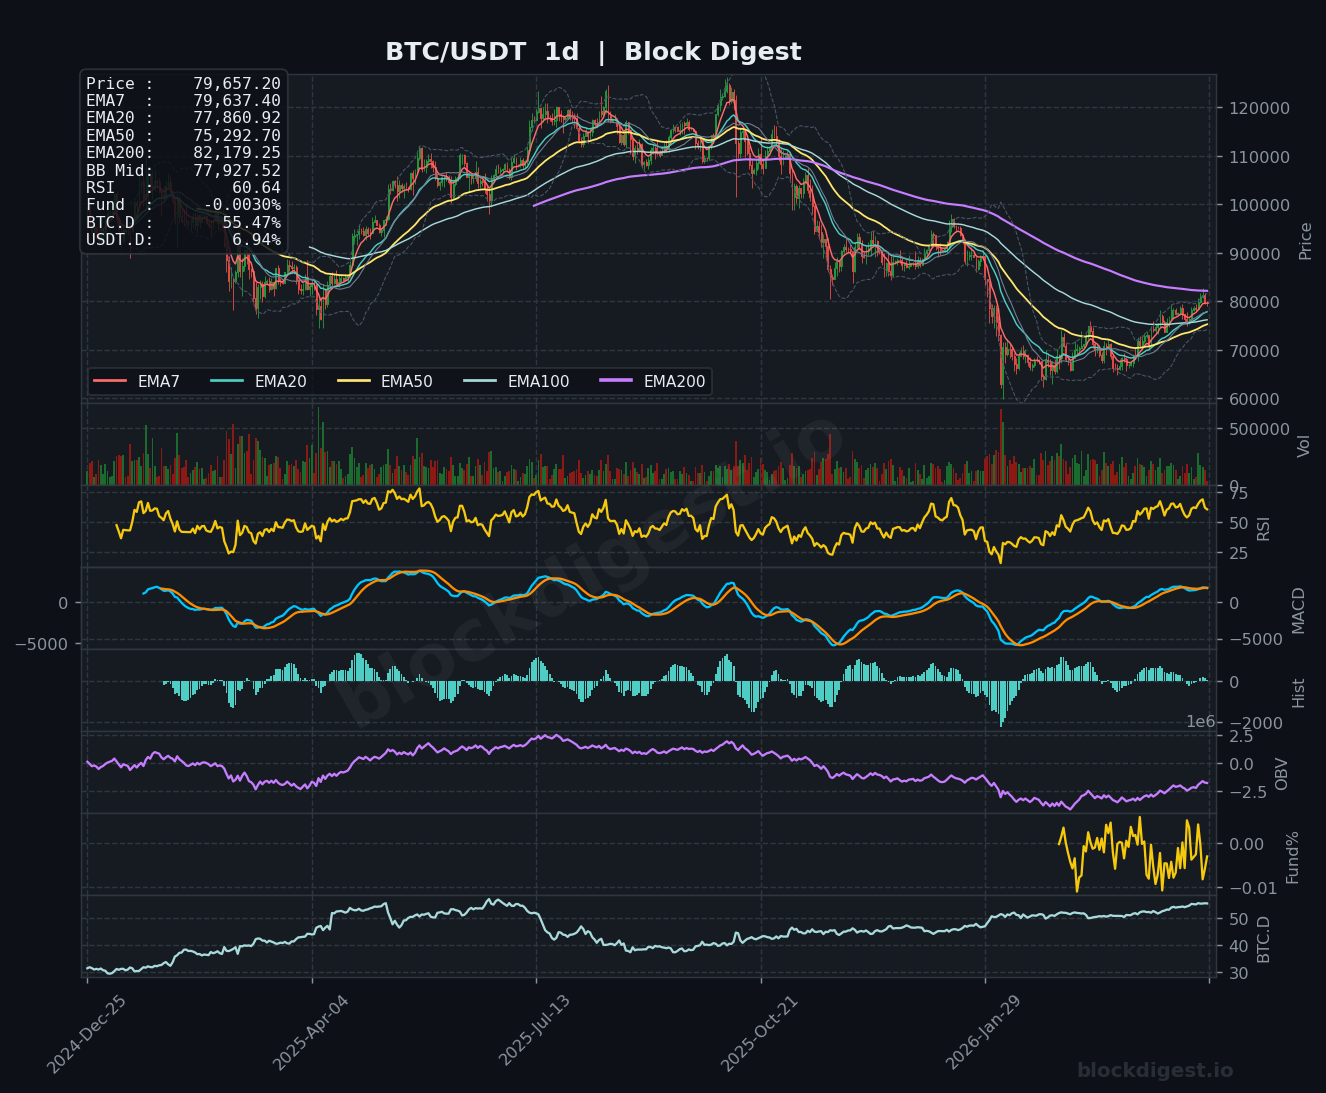
Bitcoin is currently trading at $79,657, positioned precariously below its short-term moving averages on the 1-hour timeframe while showing signs of stabilization on higher timeframes. Price is squeezed between the EMA7 ($79,622) and EMA20 ($79,936) on the 1h chart, indicating indecision at current levels. The daily chart reveals BTC trading near the lower Bollinger Band at $77,927, suggesting oversold conditions after the recent pullback from the $82,500 local high. The dominant daily trend remains contested, with price hovering just above the EMA50 ($75,292) but well below the EMA200 ($82,179), creating a critical inflection zone.
Multi-Timeframe Confluence
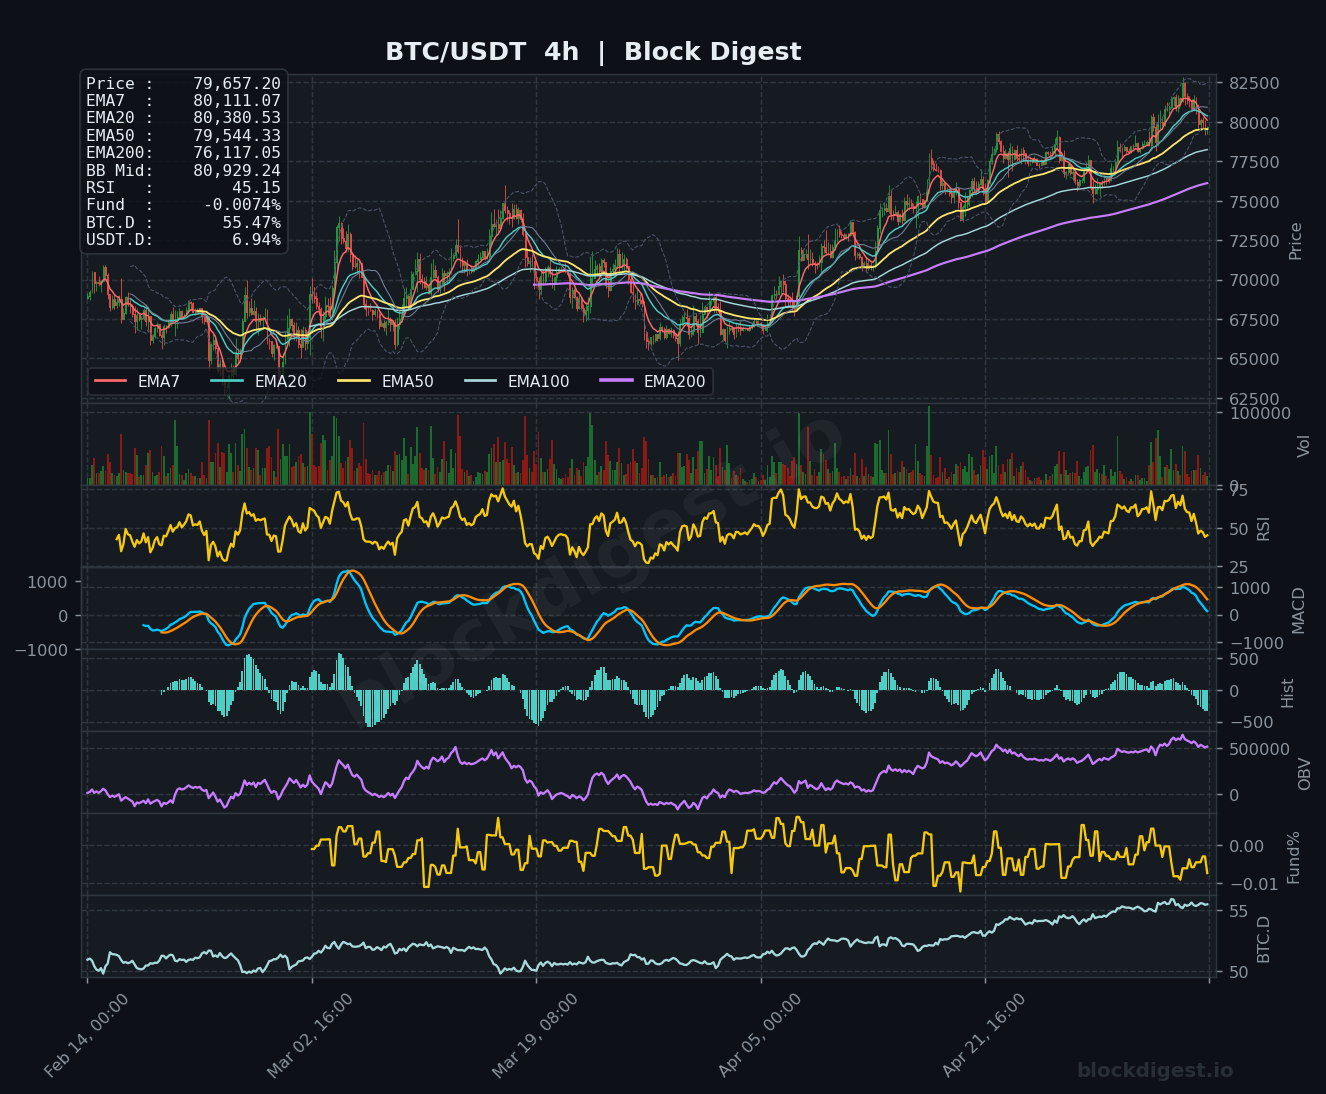
The multi-timeframe analysis reveals significant divergence that traders must navigate carefully. The 1-hour chart shows price consolidating below key EMAs with RSI at 39.56, suggesting short-term weakness, while the 4-hour timeframe displays more resilience with price at $79,657 and RSI at 45.15, indicating potential stabilization. The daily chart provides the most constructive view with RSI at 60.64, well above oversold territory, and price holding above the critical EMA50 support at $75,292. The convergence zone around $79,500-$80,000 represents a critical battleground where the EMA20 on the 4h chart ($80,380) and multiple EMAs on the 1h chart cluster, creating a natural resistance ceiling that must be reclaimed for bullish continuation.
Key Levels to Watch
Resistance:
- $80,387 (4h EMA50) – Immediate resistance that has capped recent recovery attempts; reclaiming this level would signal short-term trend reversal
- $80,929 (4h BB Mid) – Critical middle Bollinger Band on 4h chart representing the mean reversion target and gateway to bullish structure
- $82,500-$83,000 – Major resistance zone marking the recent local high and confluence with the daily EMA200 at $82,179; breaking above would confirm trend reversal
Support:
- $79,550-$79,620 (1h EMA cluster) – Immediate support zone where EMA7, EMA20, and EMA200 converge; loss of this level opens downside risk
- $77,927 (1d BB Lower) – Critical daily Bollinger Band support that has provided a floor; break below signals deeper correction
- $75,292 (1d EMA50) – Major structural support representing the 50-day moving average; failure here would invalidate the medium-term recovery thesis
Momentum & On-Chain Signals
Momentum indicators present a mixed but cautiously constructive picture across timeframes. The 1-hour RSI at 39.56 shows short-term weakness but approaches oversold territory where bounces typically emerge, while the 4-hour RSI at 45.15 suggests neutral momentum with room to move in either direction. The daily RSI at 60.64 remains healthy and well-positioned above the midpoint, indicating the broader trend hasn’t broken despite recent weakness. MACD across all timeframes shows bearish positioning with both lines in negative territory and declining histograms, though the rate of decline is slowing on the 4h and daily charts. OBV shows concerning distribution patterns on lower timeframes with declining volume supporting the recent pullback, though daily OBV remains relatively stable, suggesting institutional holders haven’t panicked. The Funding Rate at -0.0074% indicates a slightly negative bias with shorts paying longs, which often precedes short-term bounces as overleveraged shorts get squeezed.
BTC Dominance & Market Sentiment
Bitcoin dominance stands at 55.47%, reflecting BTC’s relative strength as capital continues flowing toward the market leader amid broader uncertainty. This elevated dominance level suggests risk-off behavior in crypto markets, with traders preferring Bitcoin’s relative safety over altcoins. USDT dominance at 6.94% remains elevated compared to risk-on periods, confirming defensive positioning across the market. The combination of rising BTC.D and elevated USDT.D typically indicates a “flight to quality” environment where Bitcoin maintains better than altcoins but overall crypto market sentiment remains cautious, supporting a range-bound outlook until clearer directional catalysts emerge.
Risk Scenarios
Bullish case: A reclaim of the $80,400 level (4h EMA50) with accompanying volume would trigger short covering and open the path toward $82,500-$83,000, where the daily EMA200 confluence presents the next major test. Sustained trading above $80,900 (4h BB Mid) with RSI breaking above 50 on the 4h chart would confirm short-term trend reversal and target a retest of recent highs near $85,000.
Bearish case: Failure to hold the $79,550 support cluster would likely trigger stops and accelerate selling toward the daily Bollinger Band at $77,927, with further breakdown opening $75,292 (daily EMA50) as the next critical support. A daily close below $75,000 would represent a significant technical breakdown, potentially targeting the $70,000-$72,000 zone where deeper demand resides.
Outlook
Bitcoin remains at a critical juncture, trapped in a consolidation zone between $79,500 and $80,500 that will likely resolve within the next 24-48 hours. The technical structure favors a near-term bounce given oversold 1h conditions, positive funding rates for longs, and the daily timeframe maintaining its structural integrity above the EMA50. However, conviction remains low until price can reclaim and hold above $80,900, which would shift the short-term bias bullish and open the door for a move toward $82,500. Traders should watch for volume expansion above $80,400 as the key trigger for upside continuation, while a breakdown below $79,500 with increasing volume would signal further downside risk. The ideal scenario for bulls involves a defense of current levels followed by a decisive break above the 4h resistance cluster, while bears need to see breakdown below $79,500 to gain control.
Disclaimer: This analysis is for informational purposes only and does not constitute financial advice. Cryptocurrency markets are highly volatile and unpredictable. All trading decisions should be made based on your own research and risk tolerance. Block Digest is not responsible for any financial losses incurred as a result of acting on this content.