Weekly Market Overview
Bitcoin’s daily and weekly charts are giving different signals. With those signals in disagreement, the next structural confirmation matters more than a single directional headline.
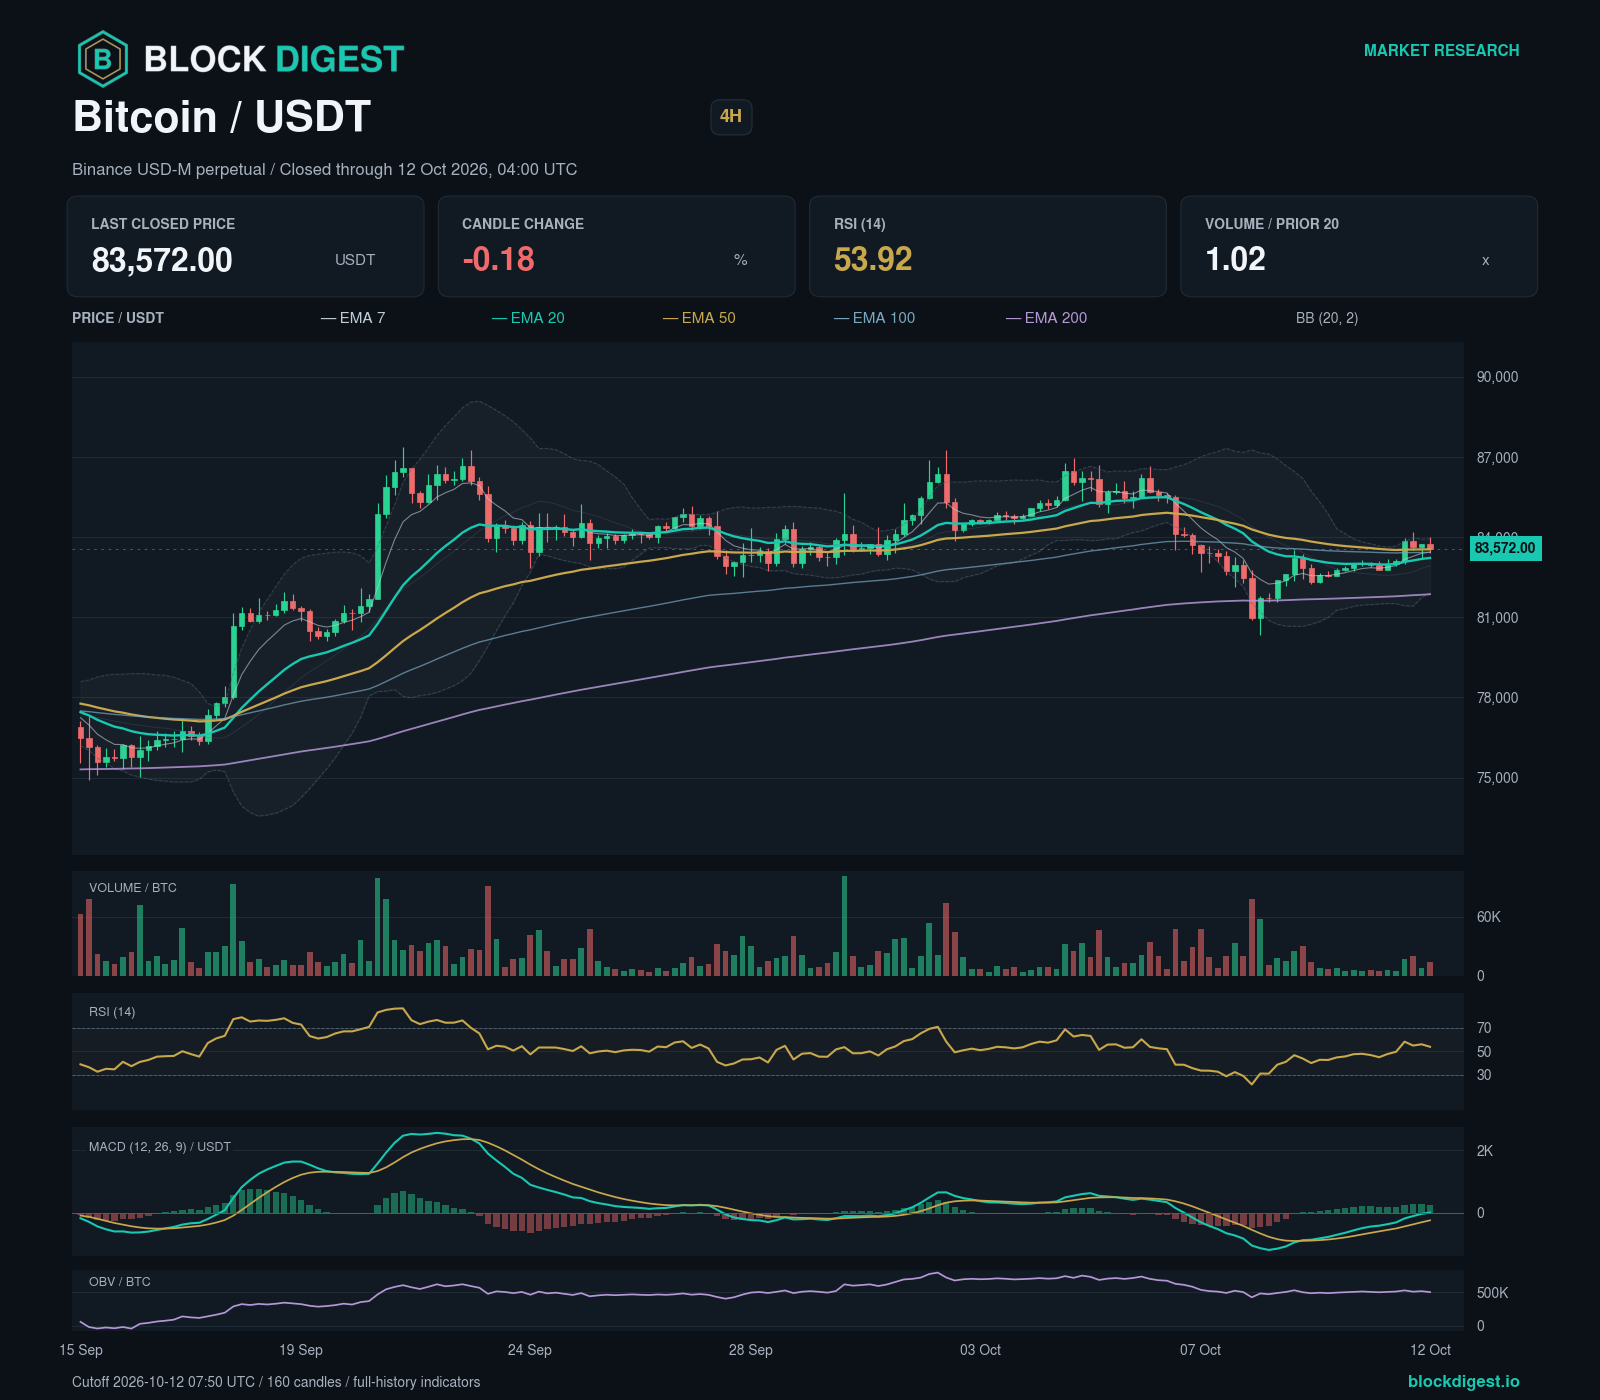
Bitcoin’s latest completed four-hour candle closed at 83,572.00 USDT, for the period ending 2026-10-12 04:00 UTC. The last daily close rose 0.94% from the previous close. BlockDigest’s base assessment is bearish.
The next upside checkpoint requires a completed daily candle closing above 84,180.00 USDT. The downside scenario begins with a completed daily candle closing below 82,515.08 USDT. Both conditions apply after the analysis cutoff.
Key Weekly Levels
| Area | Price zone |
|---|---|
| Potential support | 82,515.08 USDT–83,145.62 USDT |
| Potential support | 81,969.18 USDT–82,813.72 USDT |
| Potential support | 80,031.18 USDT–80,913.62 USDT |
| Overhead resistance | 86,662.48 USDT–87,563.22 USDT |
| Overhead resistance | 87,071.48 USDT–87,698.72 USDT |
| Overhead resistance (older structure) | 94,241.38 USDT–94,868.62 USDT |
Some listed zones overlap because they retain distinct confirmed price anchors; overlapping bands are not independent confirmations.
Zones marked as older structure come from earlier price anchors and are wider context, not forecasts for this week’s range.
The last completed daily high at 84,180.00 USDT is an observed reference, not yet a confirmed swing high.
Trend Across Timeframes
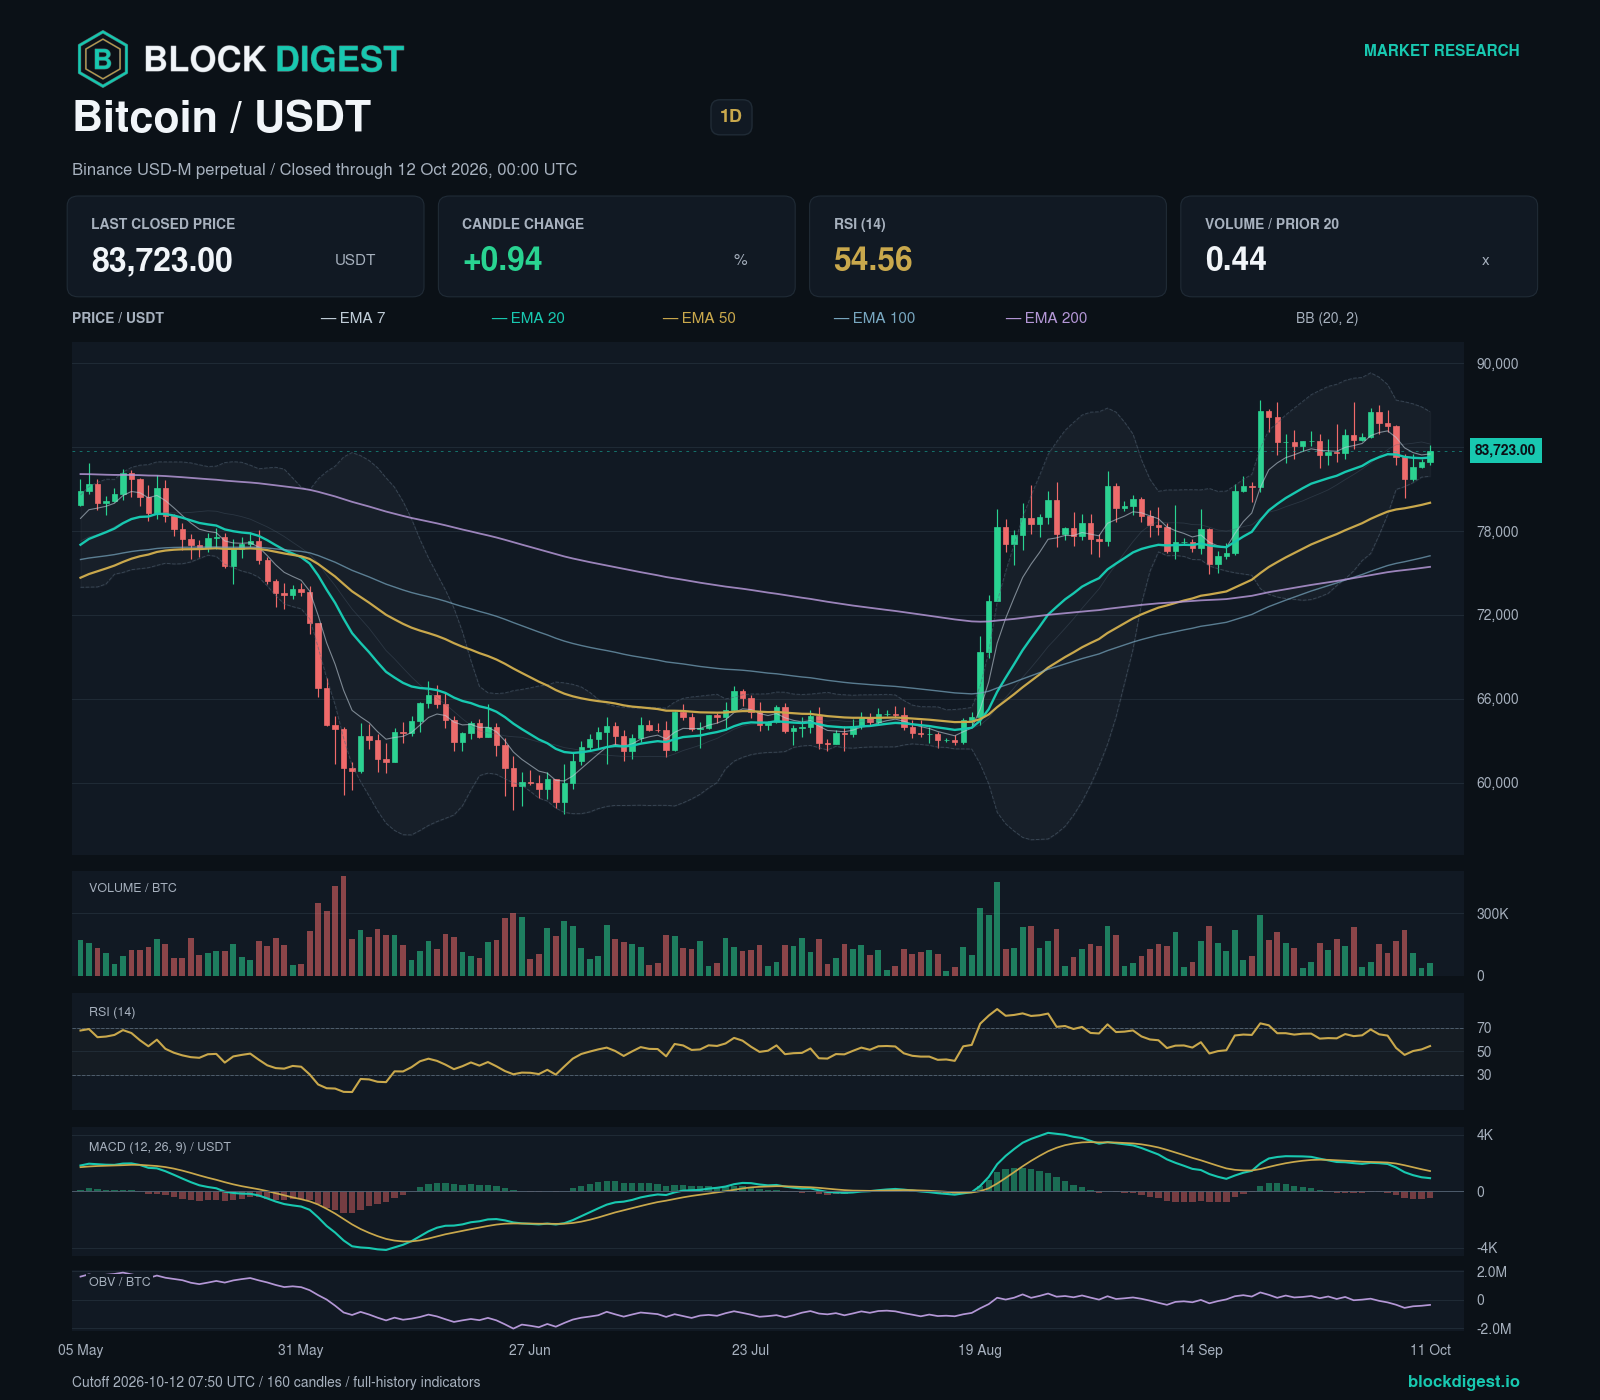
The daily chart shows lower confirmed swing highs and lower swing lows. The latest confirmed daily swing high is 86,976.10 USDT. The latest confirmed daily swing low is 80,344.80 USDT.
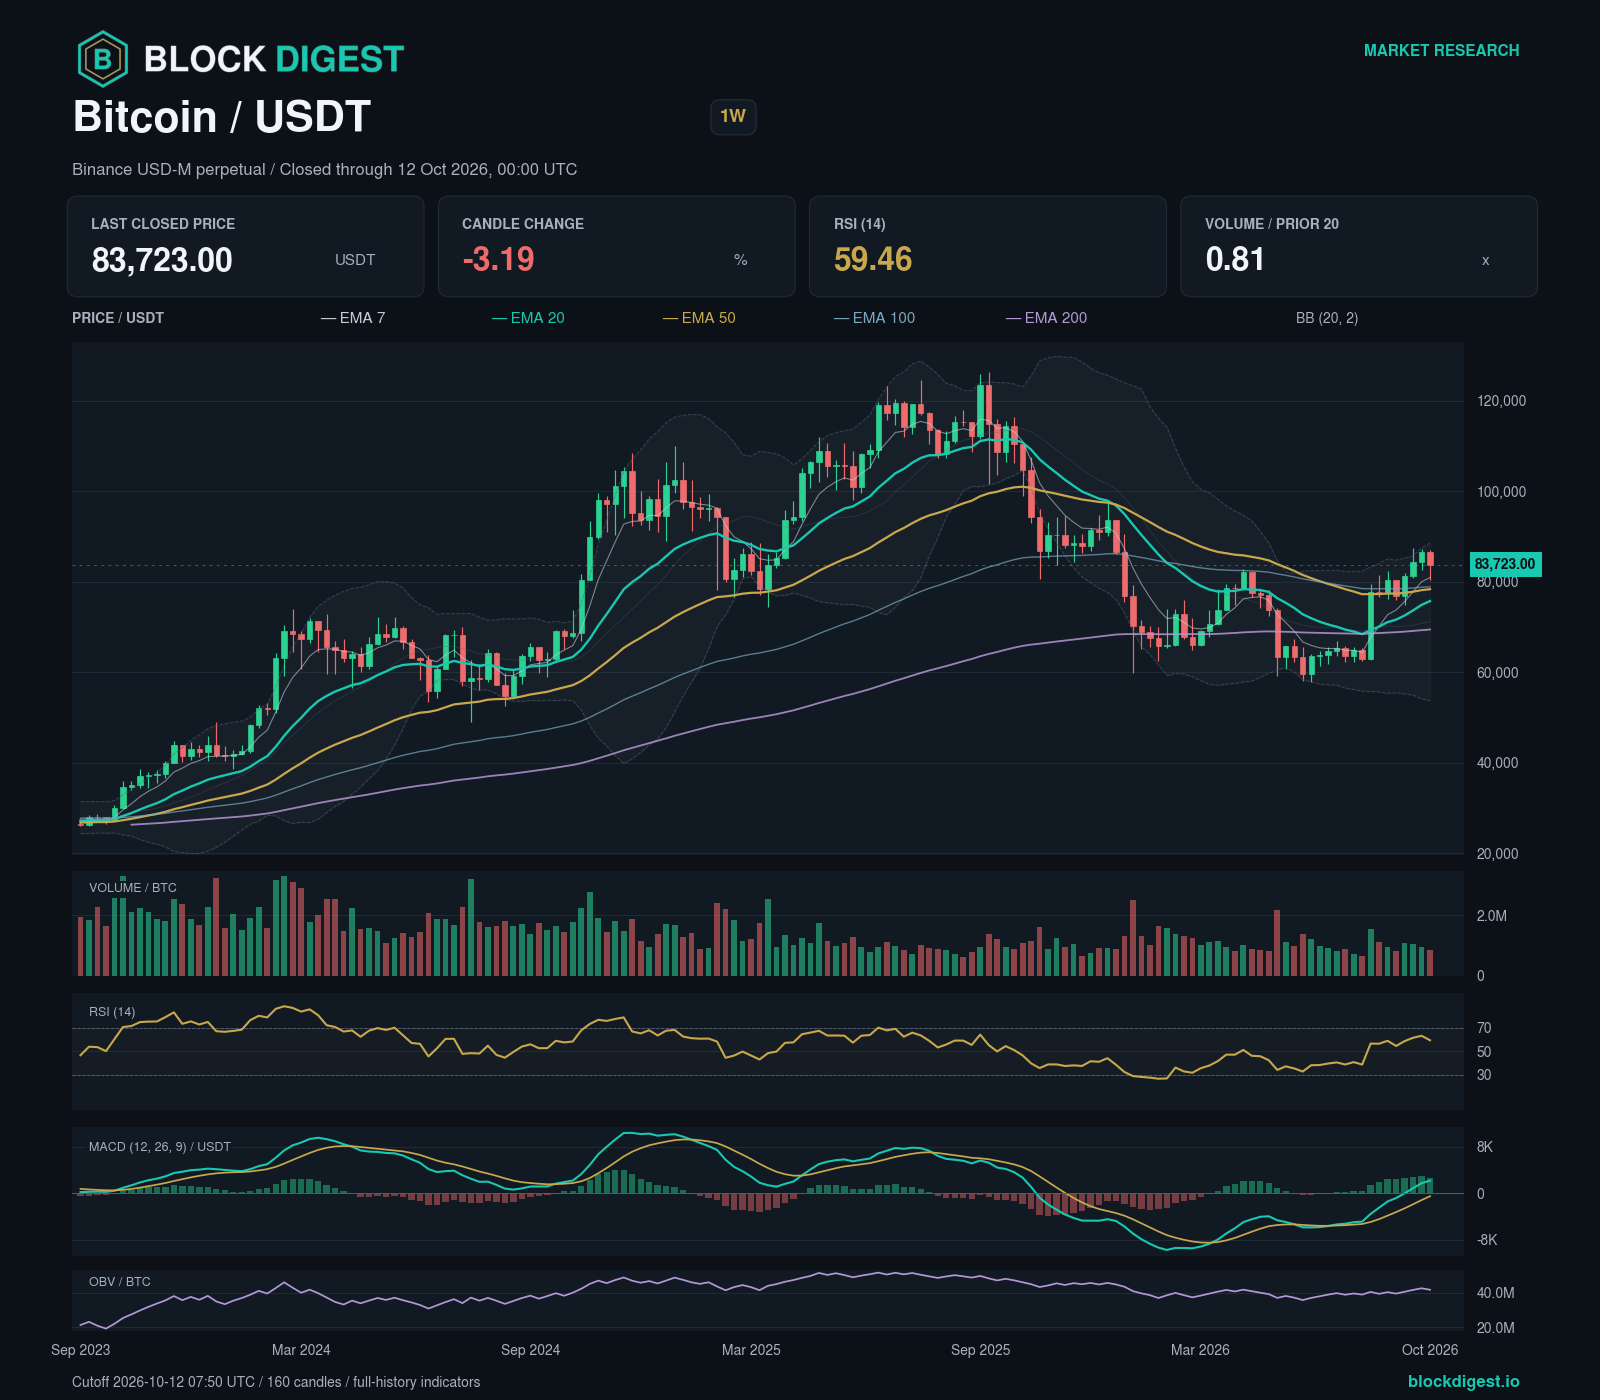
The weekly chart shows higher confirmed swing highs and higher swing lows. Its 20-, 50- and 200-period EMA arrangement is mixed. The last completed week closed at 83,723.00 USDT, for the period ending 2026-10-12 UTC.
The daily and weekly swing structures point in opposite directions. The four-hour chart shows higher confirmed swing highs and higher swing lows.
Momentum, Volume & Volatility
Daily RSI is 54.56, a change of +7.53 points over three bars. The MACD histogram is -507.02 USDT and decreased over the same interval. MACD is still above zero, though below its signal line.
Daily volume was 0.44 times the mean of the preceding 20 completed daily candles. OBV rose over three daily bars. OBV is rising against the bearish structure, but participation remains subdued.
Daily Bollinger Band width is 5.49%, at the 7.9 percentile of its trailing 120-bar range. The volatility classification is compression; daily ATR is 2,090.77 USDT.
BD Pulse & Extreme
| Period | Period end (UTC) | BD Pulse | Change from previous period | BD Extreme |
|---|---|---|---|---|
| Weekly | 2026-10-12 | 64.5/100 (Bullish) | -6.5 points from 71.0 | +0.91 sigma (typical; 104 weekly observations) |
| Daily | 2026-10-12 | 45.5/100 (Neutral) | +4.8 points from 40.7 | -0.21 sigma (typical; 365 daily observations) |
| Monthly | 2026-10-01 | 48.0/100 (Neutral) | +2.0 points from 46.0 | -1.00 sigma (unusually low; 36 monthly observations) |
The daily Pulse reading recovered against a weaker weekly reading. The weekly reading agrees with the confirmed swing trend on that timeframe. The daily reading provides neutral context on that timeframe.
The monthly reading provides longer-term context.
Key Indicators Snapshot
Daily readings use the completed candle ending 2026-10-12 00:00 UTC.
| Daily indicator | Value |
|---|---|
| Close | 83,723.00 USDT |
| EMA 20 | 83,252.99 USDT |
| EMA 50 | 80,013.52 USDT |
| EMA 200 | 75,431.08 USDT |
| RSI (14) | 54.56 |
| MACD / signal | 924.91 / 1431.93 USDT |
Risk Scenarios
Bullish case: Confirmation requires a completed daily candle closing above 84,180.00 USDT after the analysis cutoff. The scenario is invalidated by a completed daily candle closing below 82,515.08 USDT. This is a break above the last completed daily high. The reference is an observed candle extreme, not a confirmed swing pivot. The mapped checkpoints beyond the trigger are 86,662.48 USDT–87,563.22 USDT; 94,241.38 USDT–94,868.62 USDT.
Bearish case: Confirmation requires a completed daily candle closing below 82,515.08 USDT after the analysis cutoff. The scenario is invalidated by a completed daily candle closing above 84,180.00 USDT. The trigger lies within the structural zone at 81,969.18 USDT–82,813.72 USDT. A qualifying close can still be inside this zone, leaving its lower boundary at 81,969.18 USDT uncleared. The mapped checkpoints beyond the trigger are 80,956.88 USDT–81,813.62 USDT; 80,031.18 USDT–80,913.62 USDT.
The scenario checkpoints skip bands that overlap a preceding checkpoint. Such bands remain in the level map, but are not counted as separate successive objectives.
These scenarios run for seven days from the analysis cutoff. Confirmation requires the daily close, not an intraday touch. A confirming close may already be inside or beyond a mapped checkpoint; only zones still ahead remain prospective objectives. If none remain, a fresh assessment is needed.
Weekly Outlook
The bearish base thesis would be invalidated by a completed daily candle closing above 84,180.00 USDT. Confidence in the directional assessment is low because the daily and weekly swing trends point in opposite directions and the four-hour swing structure opposes the daily trend. This is a qualitative assessment, not a probability.
Data notes. Analysis cutoff: 2026-10-12 07:50:03.107 UTC. Prices and volume refer to Binance BTCUSDT perpetual futures, not spot quotes or the whole Bitcoin market. The directional classification describes confirmed swings; newer extremes remain provisional. Price zones are potential reaction areas, not guaranteed support or targets. Dominance and Alt/BTC relative strength are outside this assessment. Pulse combines BTC spot inputs with perpetual funding and overlaps with the technical evidence above. It is context, not an independent confirmation. Extreme measures the historical unusualness of Pulse, not price valuation or the probability of a reversal. Changes compare the previous week, day or month respectively.
Disclaimer: This analysis is for informational purposes only and does not constitute financial advice. Cryptocurrency markets are highly volatile and unpredictable. All trading decisions should be made based on your own research and risk tolerance. Block Digest is not responsible for any financial losses incurred as a result of acting on this content.
Stay Ahead of the Market
Follow BlockDigest for crypto market intelligence, research and real-time updates.