Ethereum Weekly Analysis: Ethereum Consolidates Beneath $2,485 Resistance Level
Weekly Market Overview
Ethereum is consolidating directly beneath critical multi-month resistance after an aggressive vertical expansion out of the sub-$2,000 accumulation range. The current weekly candle reflects tight compression around the $2,485 mark, showing shrinking bodies and a narrower intraweek range after weeks of sustained buying. This structural pause preserves the series of higher lows established off the cycle base while testing the macro downtrend’s primary pivot. Holding above key long-term moving averages keeps immediate momentum tilted toward buyers despite visible friction overhead.
Higher Timeframe Structure
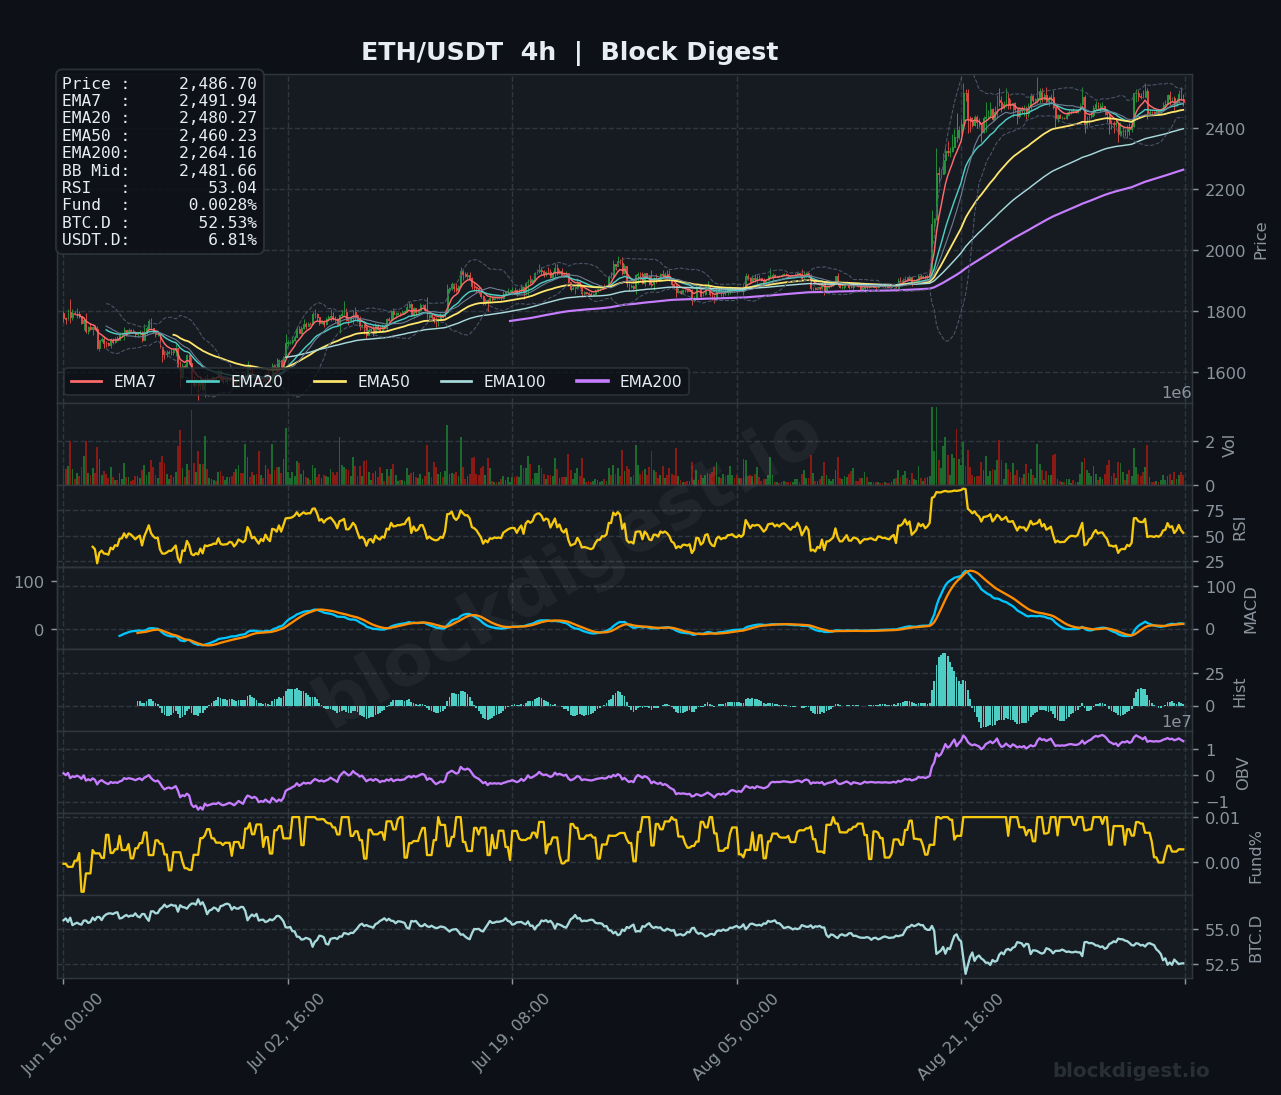
On the weekly chart, Ethereum is locked in a pivotal battle around its 200-week EMA ($2,482.03) and 100-week EMA ($2,553.86). The 7-week EMA ($2,285.71) has crossed back above the 20-week EMA ($2,152.42), confirming a transition from prolonged distribution into cyclical recovery. Price is pressing into the upper half of the Bollinger channel, comfortably above the $2,029.16 midline, though it faces supply from the breakdown shelf formed earlier in the cycle. A definitive weekly close above $2,555 would flip the macro posture cleanly bullish for the first time in months.
Multi-Timeframe Confluence
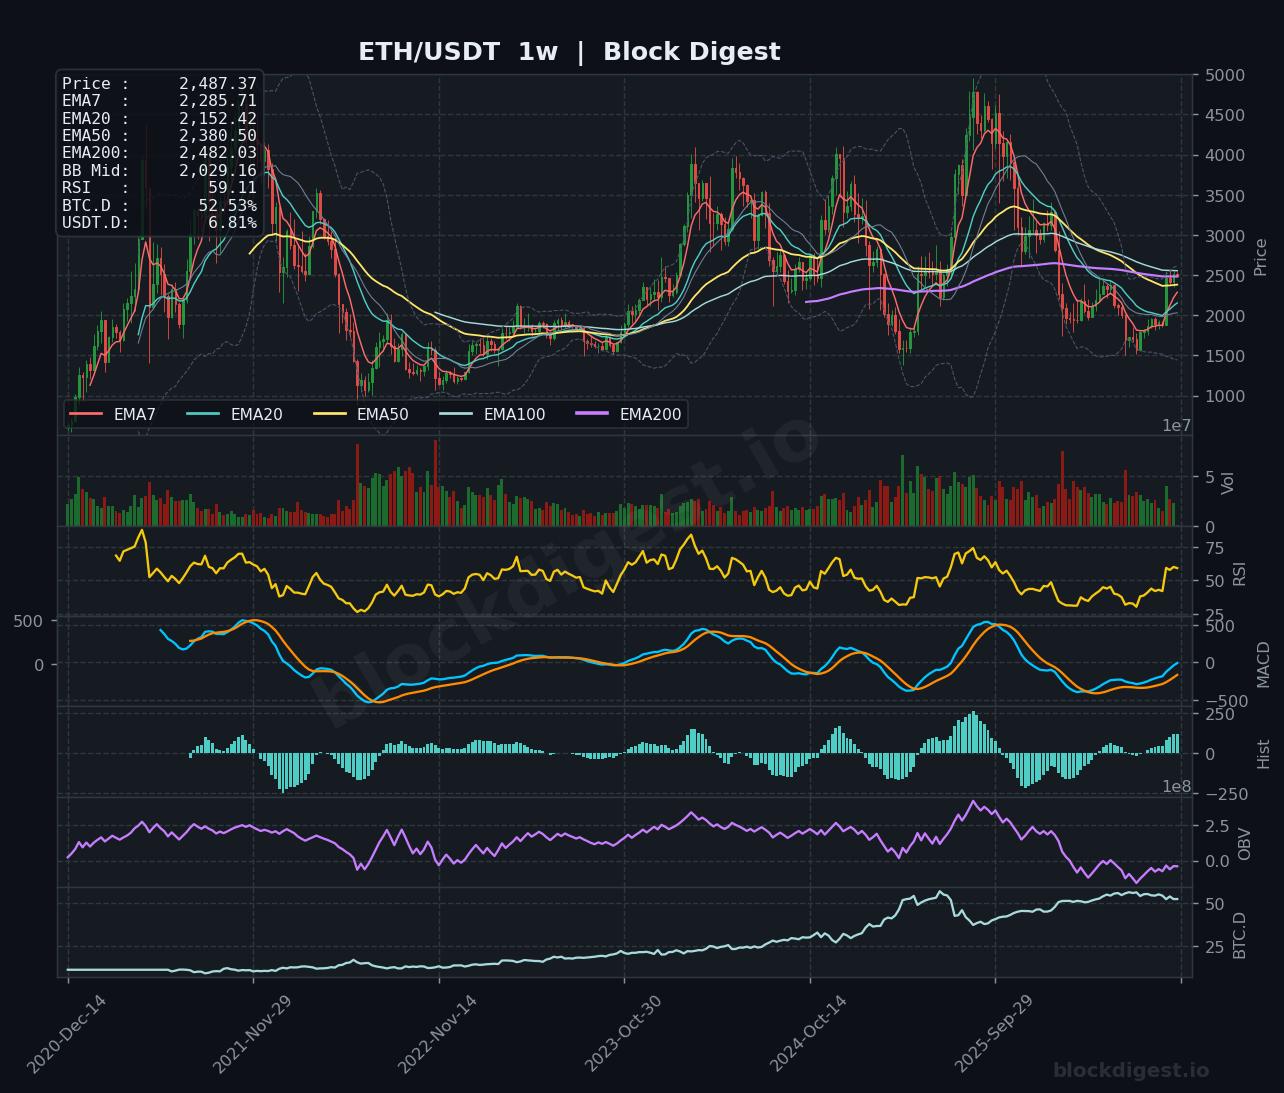
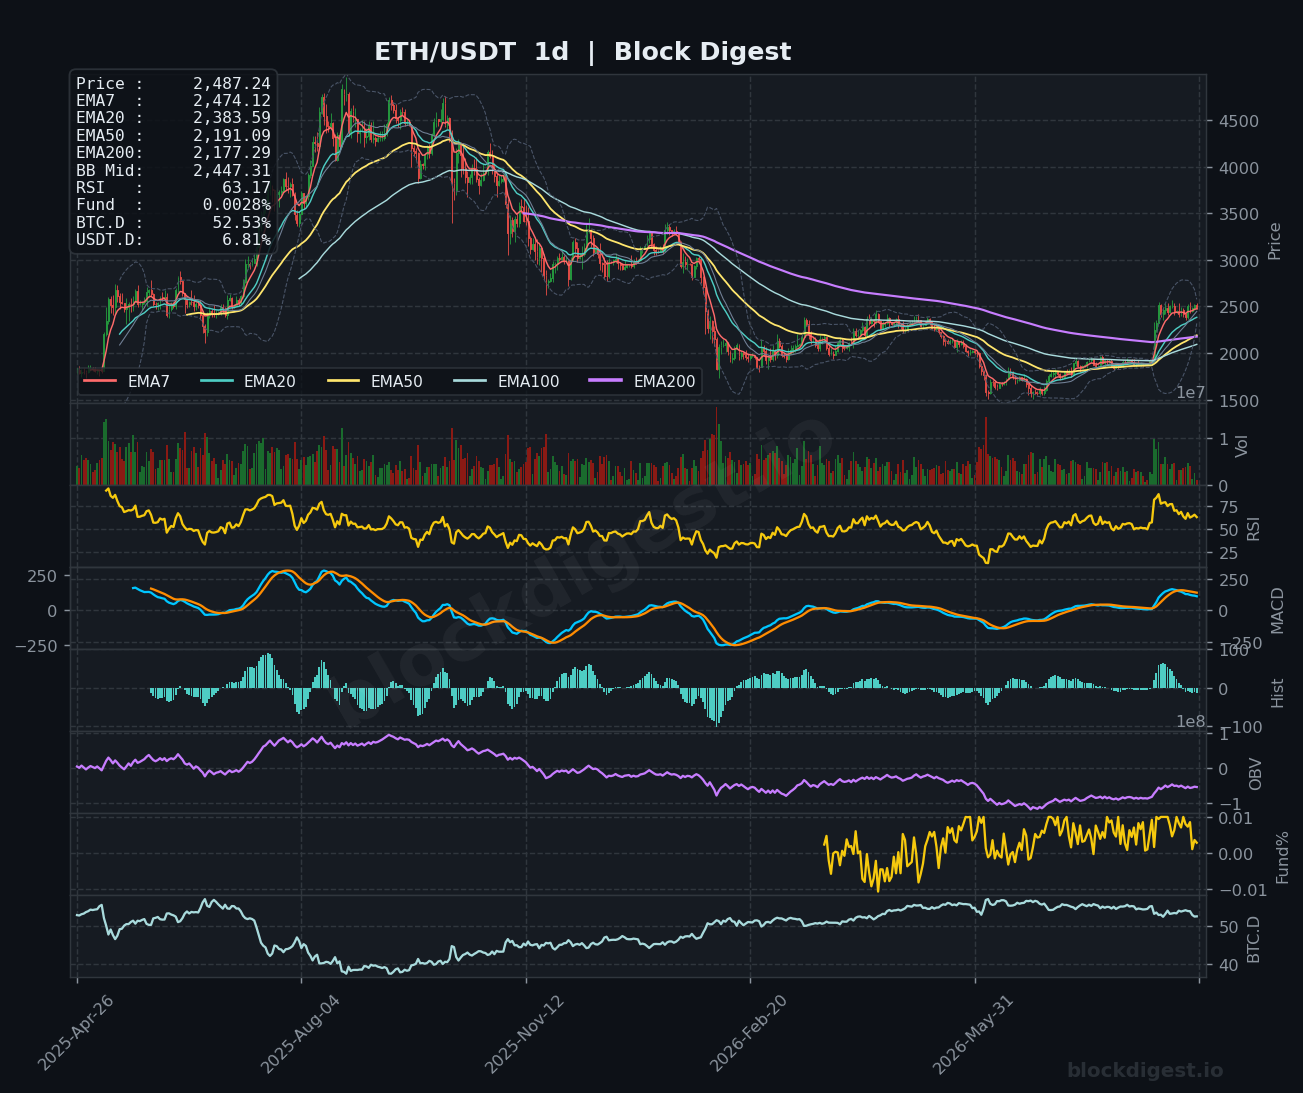
Timeframes are aligning as price consolidates above rising dynamic baselines. On the daily chart, the EMA cluster has fanned out into a standard bullish stack, with the 20-day EMA ($2,383.59) offering secondary support alongside the weekly 50 EMA ($2,380.50). The 4-hour chart shows a tight sideways shelf between $2,460 and $2,525, where price repeatedly tests the 20-EMA and Bollinger midline. This low-volatility range demonstrates that higher prices are being absorbed steadily rather than aggressively sold off.
Key Weekly Levels
- Weekly Resistance:
- $2,555 – Confluence of the 100-week EMA and local range highs, acting as the primary breakout barrier.
- $2,615 – The upper weekly Bollinger Band, representing the immediate volatility extension target.
- $2,850 – Significant horizontal structural pivot from previous distribution phases.
- Weekly Support:
- $2,480 – Immediate confluence of the 200-week EMA and 4-hour 20 EMA baseline.
- $2,380 – Confluent support anchored by the weekly 50 EMA and the rising 20-day EMA.
- $2,285 – The weekly 7 EMA and primary swing-low validation level.
Momentum & Volume Analysis
Weekly momentum indicators reflect an accelerating trend, driven by an expanding positive MACD histogram and an RSI maintaining constructive positioning above the median line. The BD Pulse registers a bullish posture signaling ongoing macro accumulation, even as the BD Extreme Index reflects mild local extension. On-chain volume and steady open interest expansion alongside flat funding rates suggest this consolidation is driven by spot absorption rather than excessive leverage. The lack of negative divergence across higher timeframe oscillators indicates that buyer fatigue has not yet materialized.
Disclaimer: This analysis is for informational purposes only and does not constitute financial advice. Cryptocurrency markets are highly volatile and unpredictable. All trading decisions should be made based on your own research and risk tolerance. Block Digest is not responsible for any financial losses incurred as a result of acting on this content.