Market Context
The broader altcoin market remains under meaningful pressure, with Bitcoin dominance sitting at 54.53% — a level that historically suppresses sustained altcoin rallies and signals continued capital rotation toward BTC safety. USDT dominance at 8.04% suggests meaningful dry powder remains on the sidelines, reflecting a cautiously risk-off posture from market participants. With the total crypto market cap down roughly 3% on the week and Bitcoin range-bound between $62,300 and $63,800, altcoins face an uphill battle for directional conviction in the near term.
Solana (SOL)
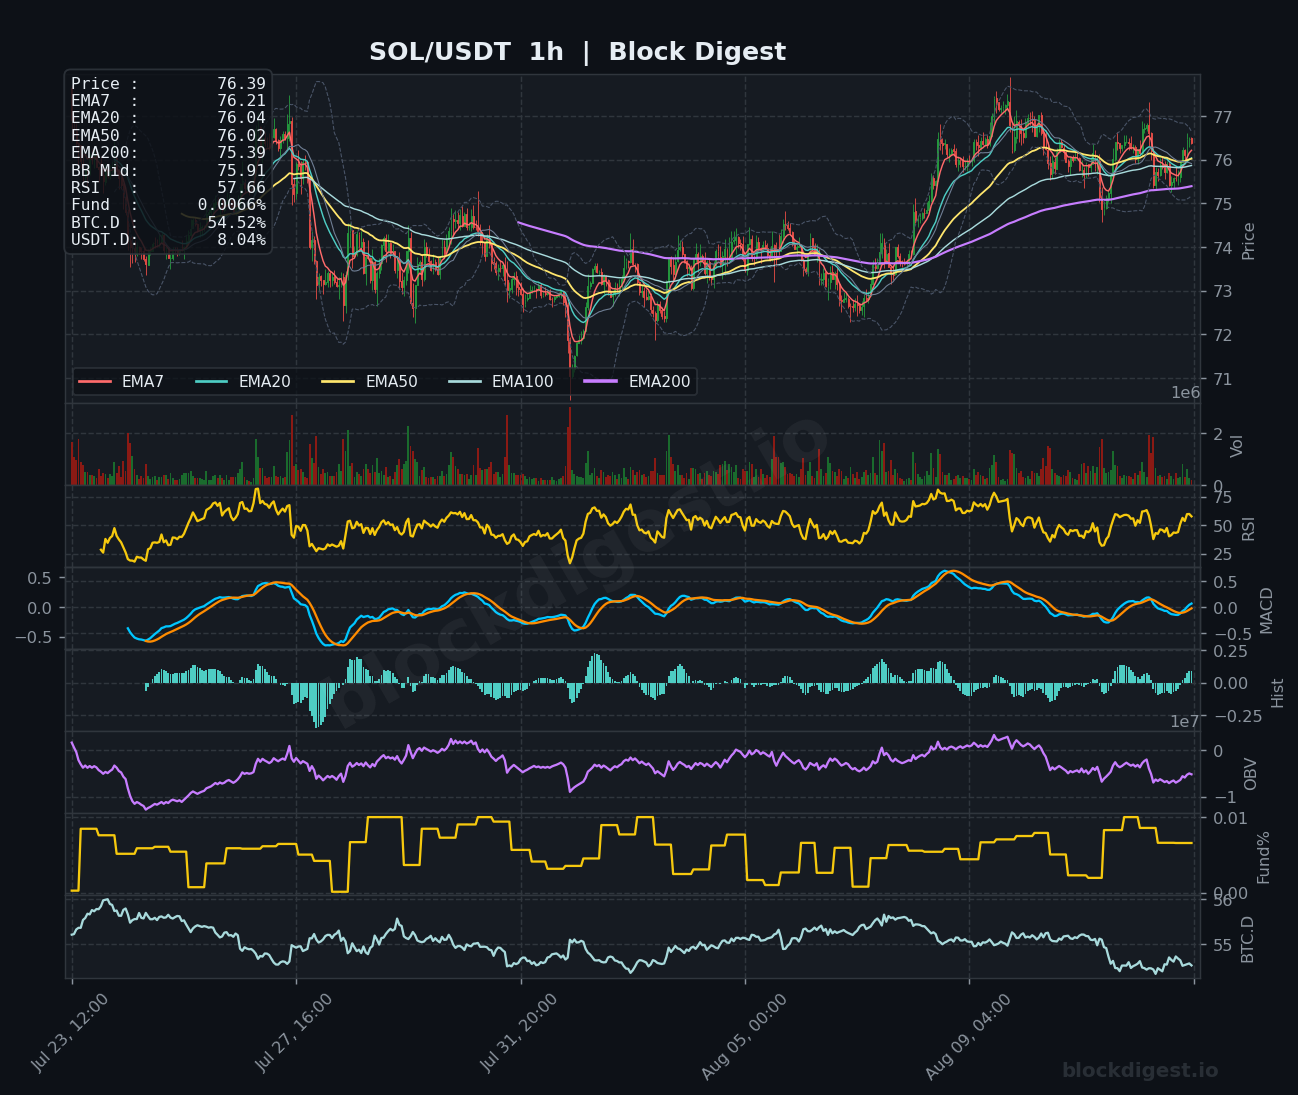
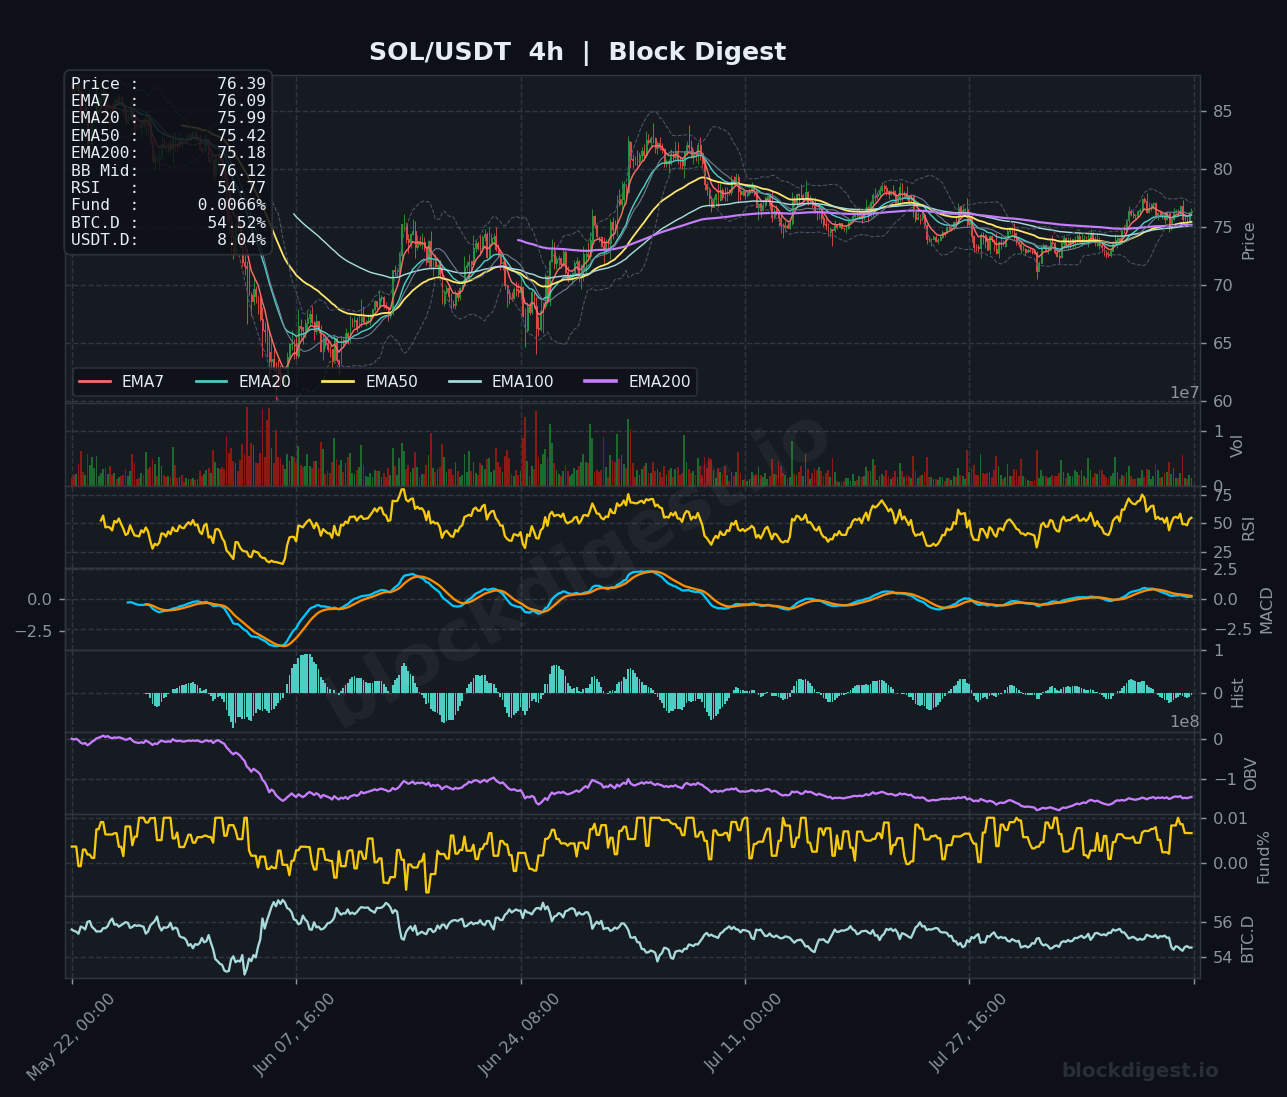
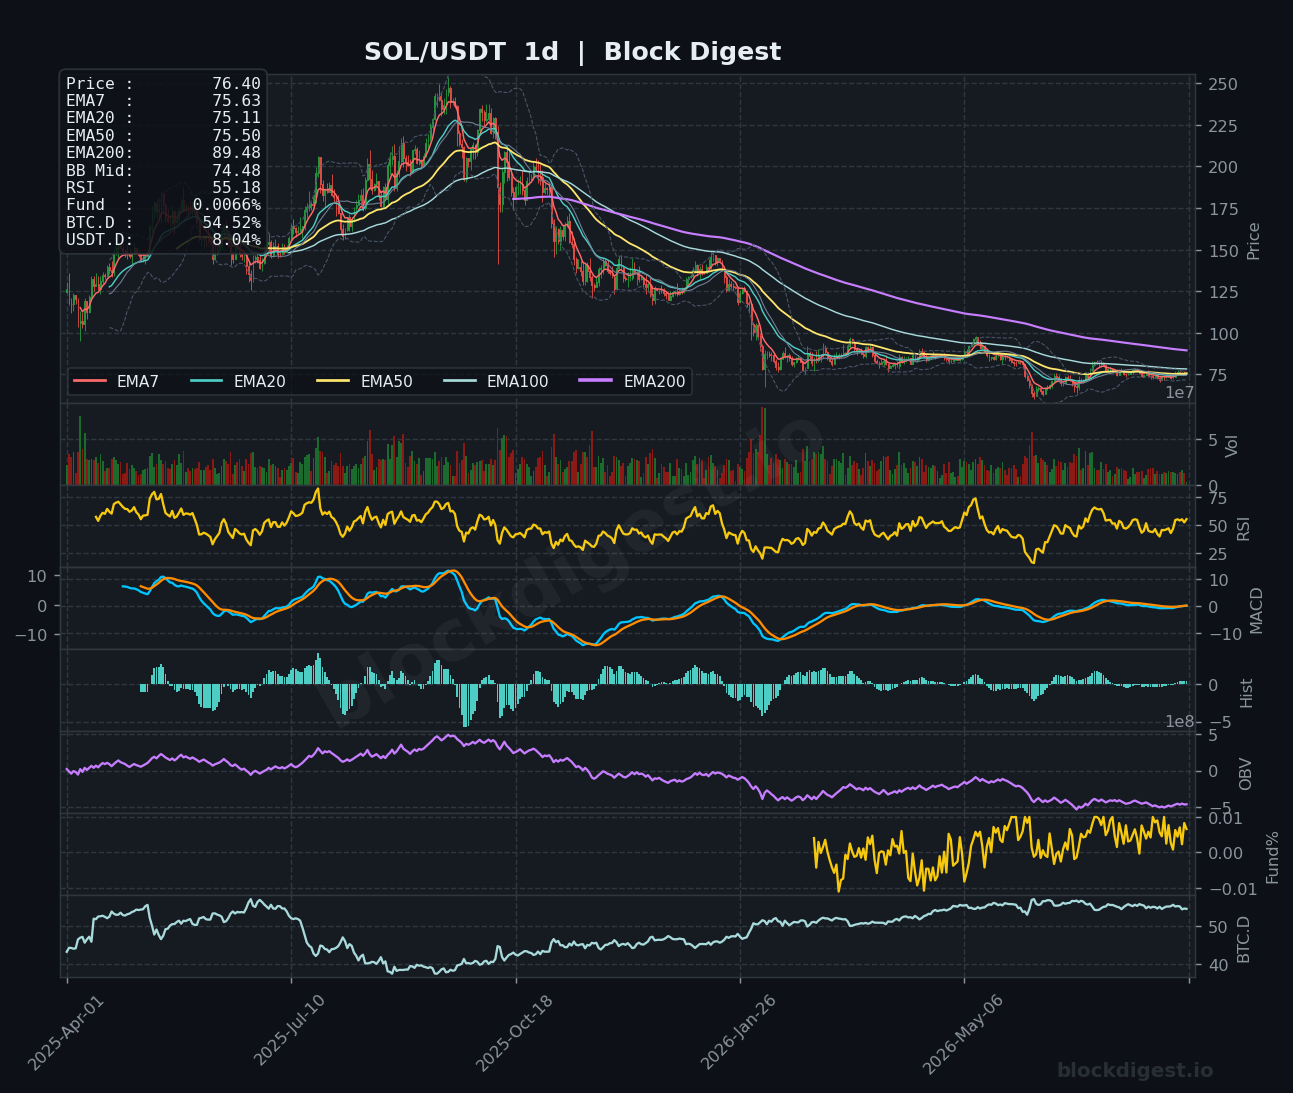
SOL is trading at $76.39, holding above its tightly clustered short-term EMAs (EMA7 at $76.21, EMA20 at $76.04, EMA50 at $76.02) on the 1H chart, suggesting the recent recovery from the $73 lows is intact but increasingly fragile. The 4H chart paints a more cautious picture — price has been grinding sideways after rejecting from the $80–$85 range, with the MACD barely above zero and histogram bars shrinking, indicating fading bullish momentum. On the daily timeframe, SOL remains well below its EMA200 at $89.48, confirming the broader structural downtrend that has been in place since the 2025 peak above $200. Our BD Pulse RSI reading of 48.33 aligns with the 1H chart’s mid-range RSI of 57.66, suggesting neither oversold bounce fuel nor overbought exhaustion — a neutral-to-mildly-bullish short-term bias with $74.50 as the critical support to defend.
XRP (XRP)
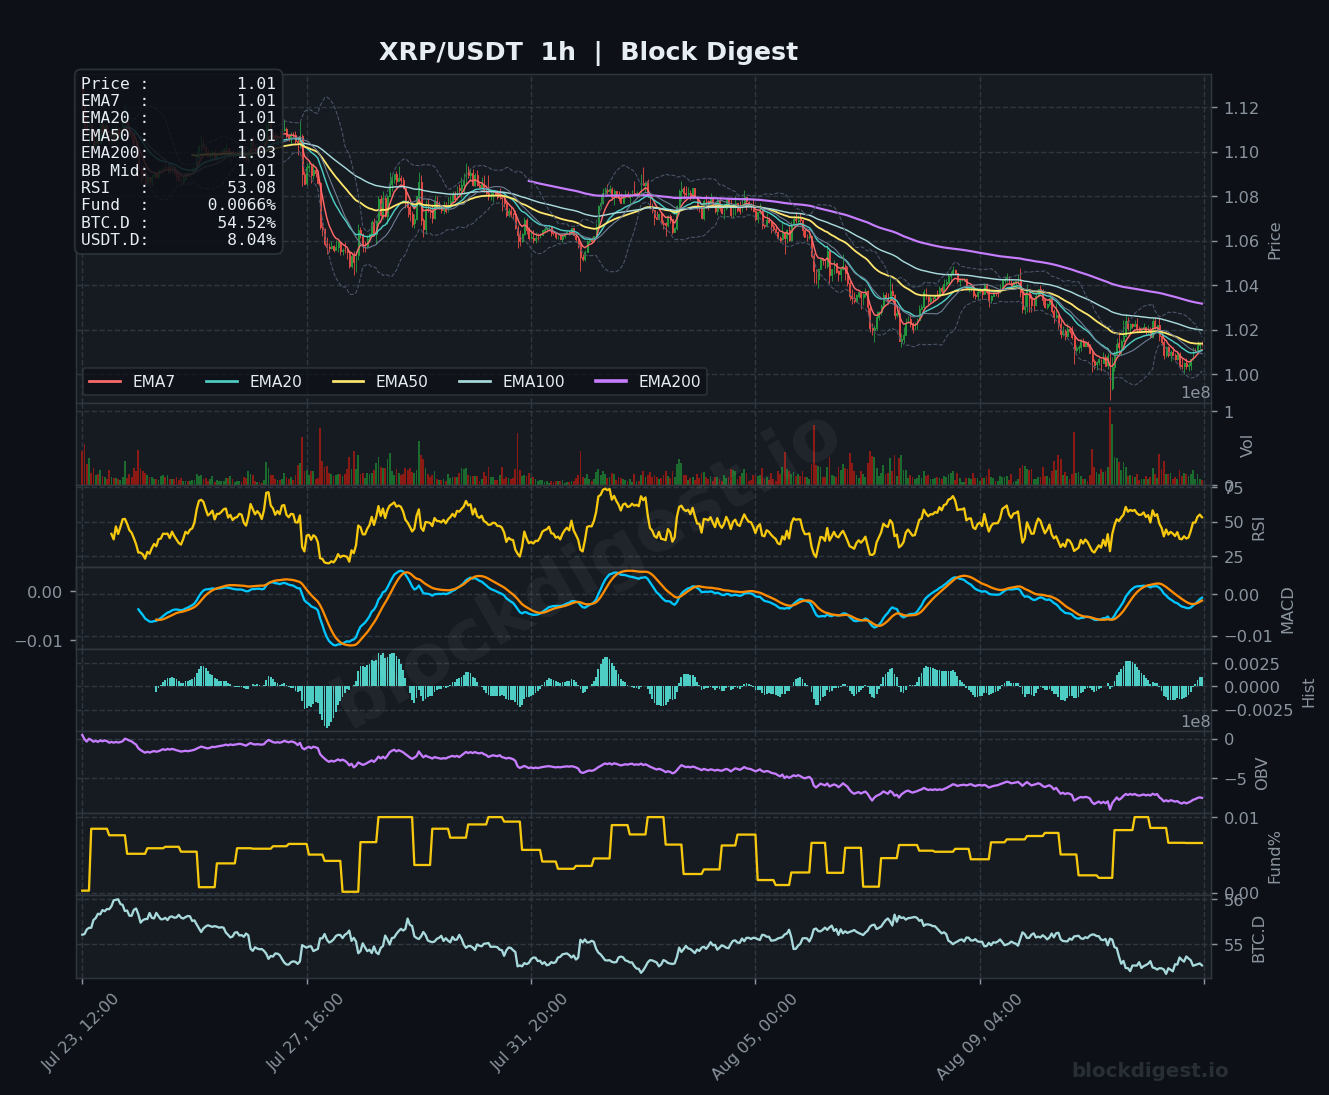
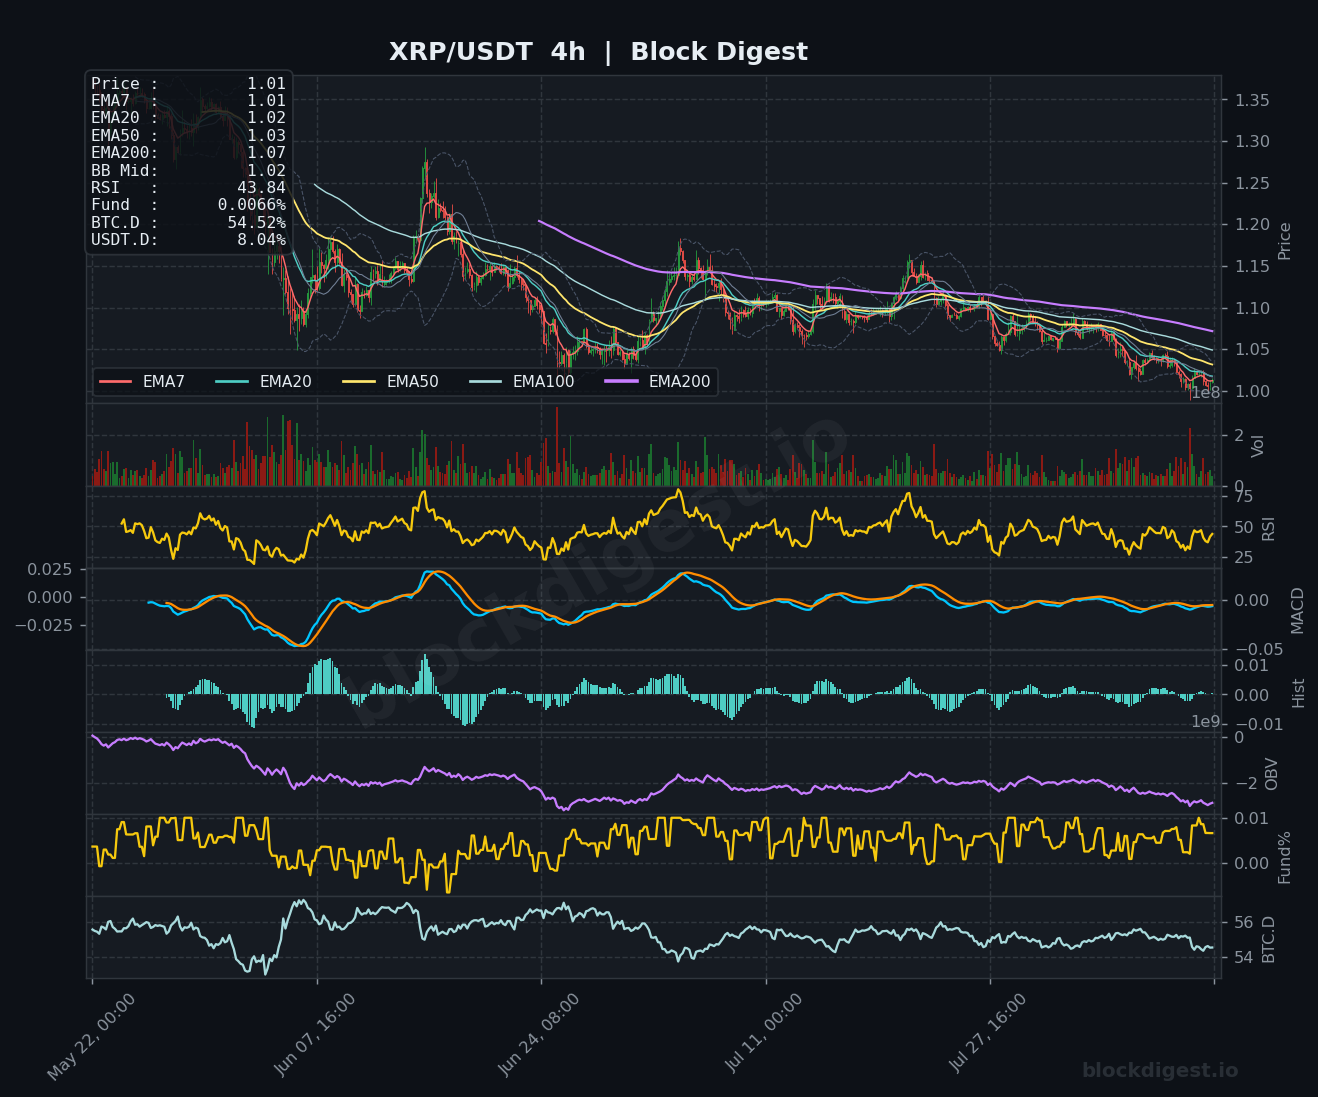
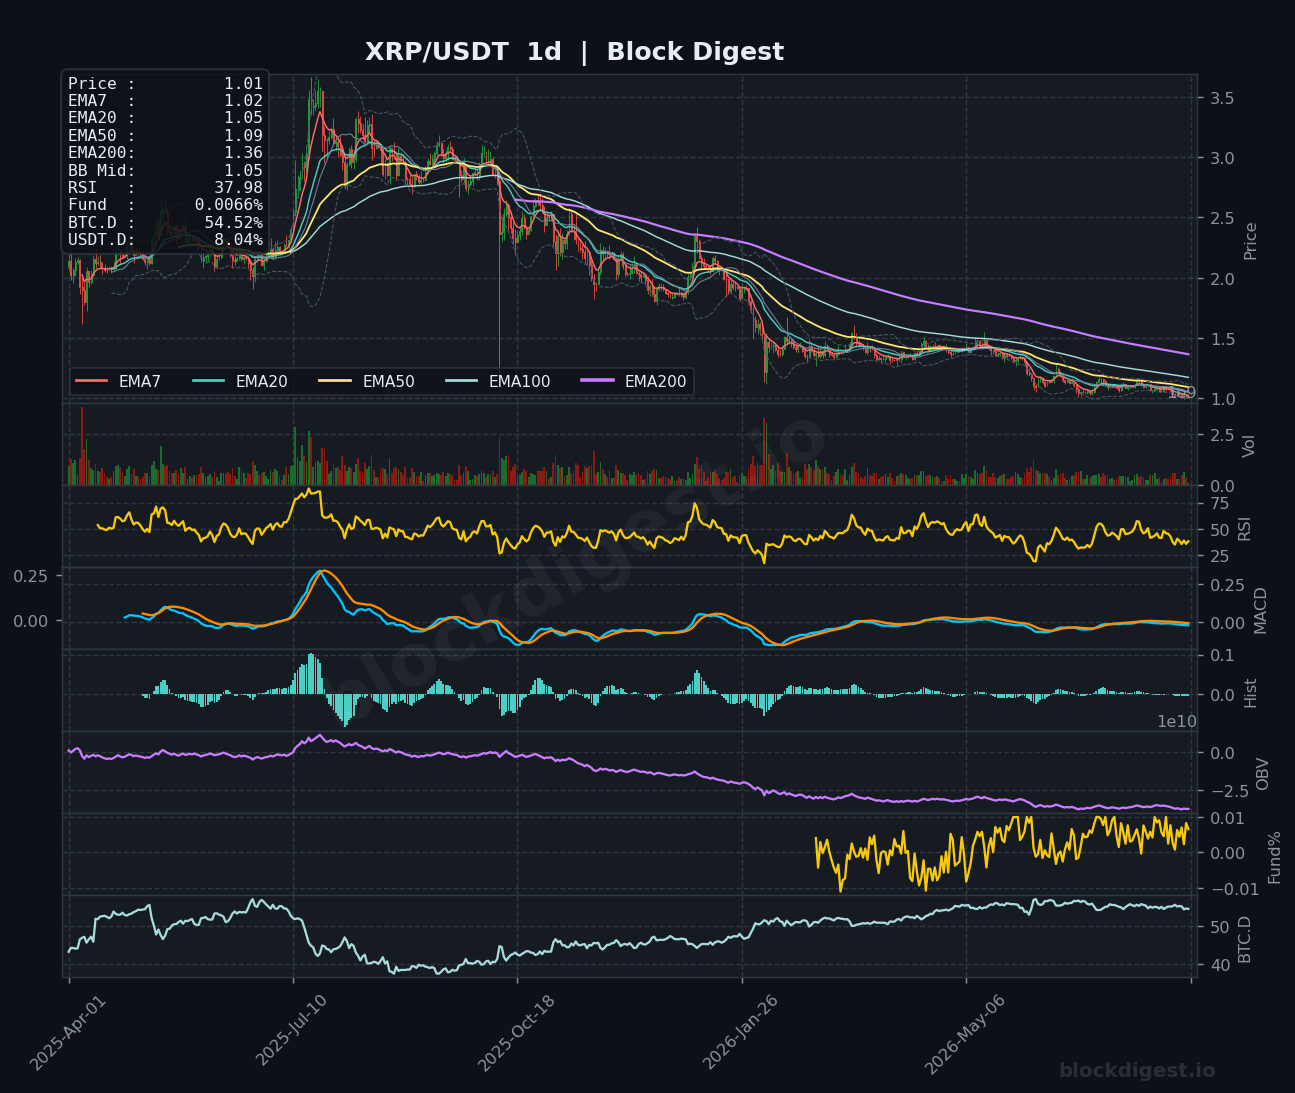
XRP is trading at $1.01, and the technical picture across all timeframes is notably bearish. On the 1H chart, price is below the declining EMA200 ($1.03) with all shorter-term EMAs stacked bearishly and RSI at 53.08 — a slight uptick but still failing to reclaim momentum above the midline on higher timeframes. The 4H RSI has dropped to a more concerning 43.84, with MACD in negative territory and OBV continuing its multi-month downtrend, confirming persistent distribution. The daily chart shows RSI at just 37.98, approaching oversold territory but not yet producing a convincing reversal signal, with price trading well below the EMA50 ($1.09), EMA100, and the EMA200 ($1.36). A notable fundamental development provides some counterweight: Ripple’s RLUSD stablecoin now holds more supply on the XRP Ledger ($810M) than on Ethereum ($756M) for the first time, but until price reclaims the $1.05–$1.08 resistance band with volume conviction, the short-term bias remains bearish.
BNB (BNB)
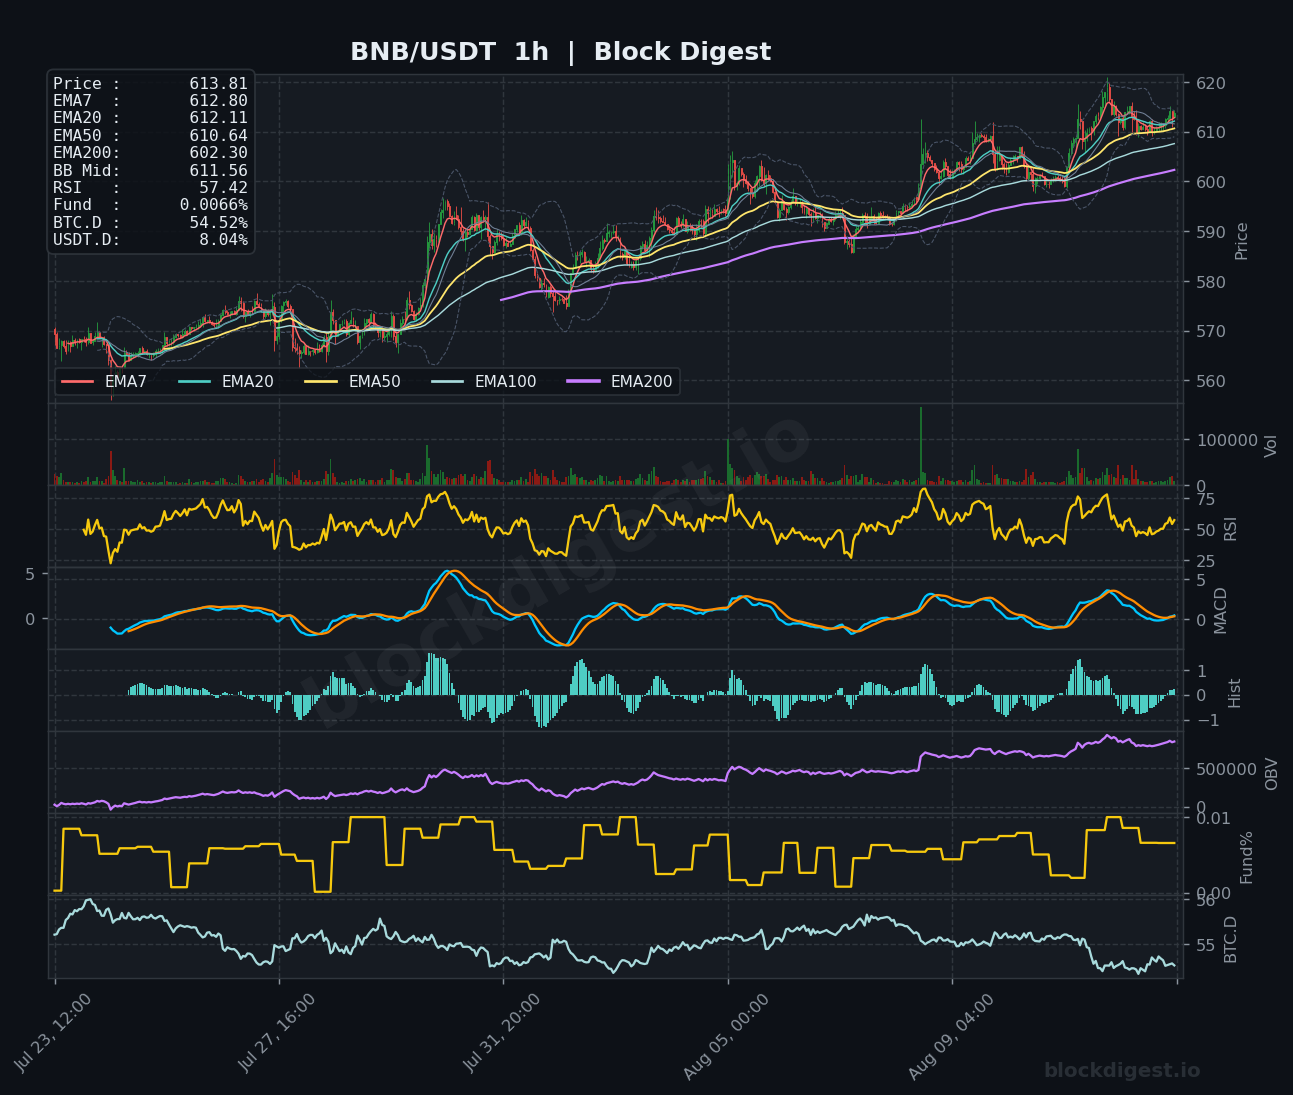
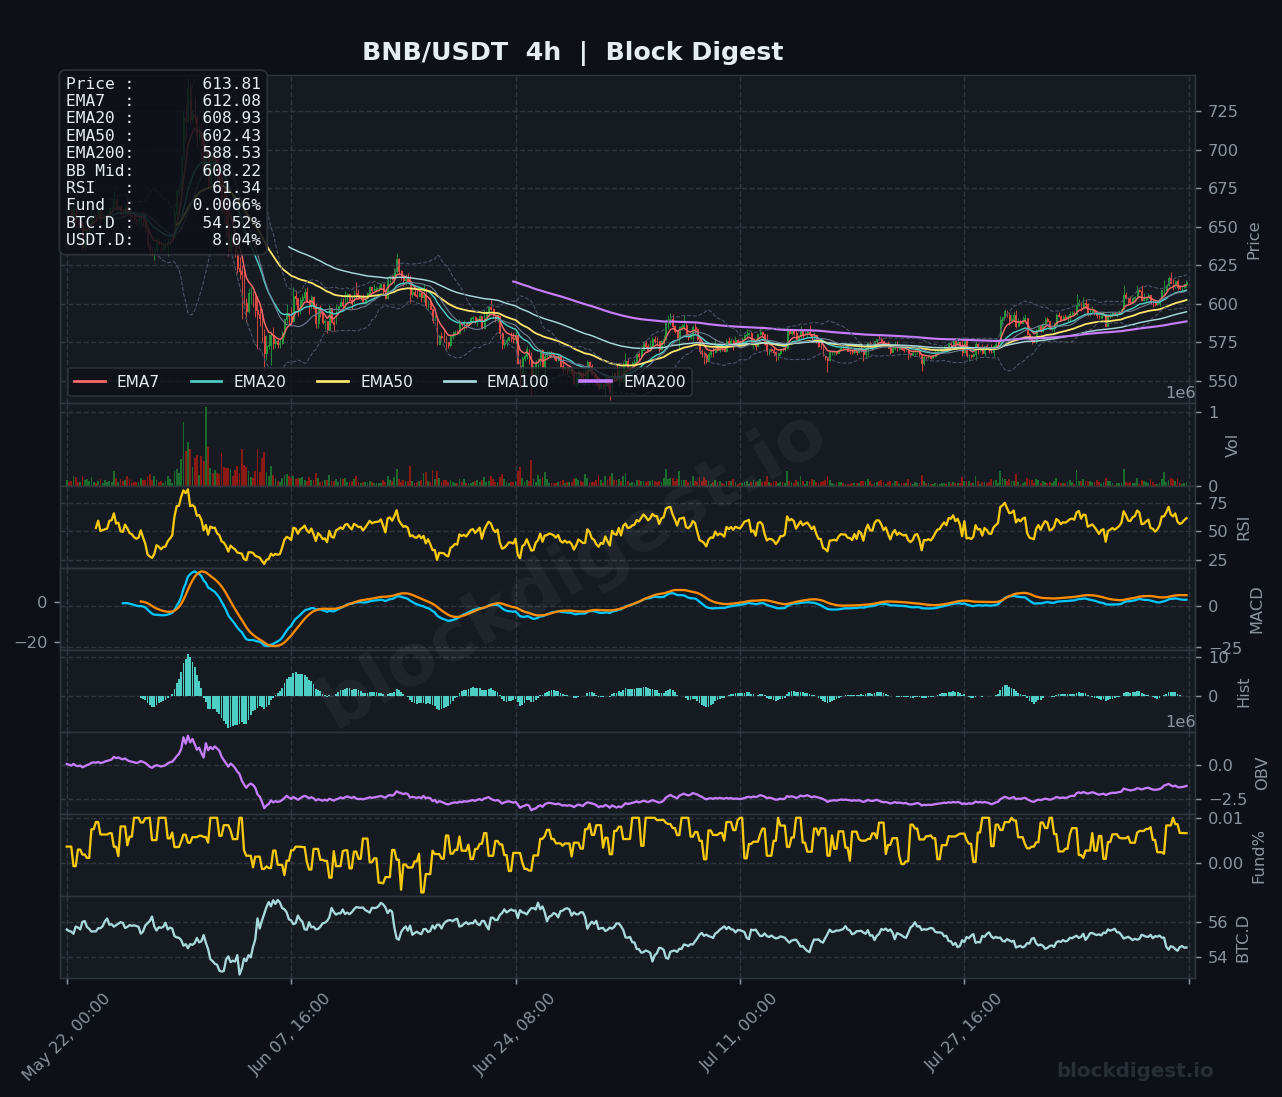
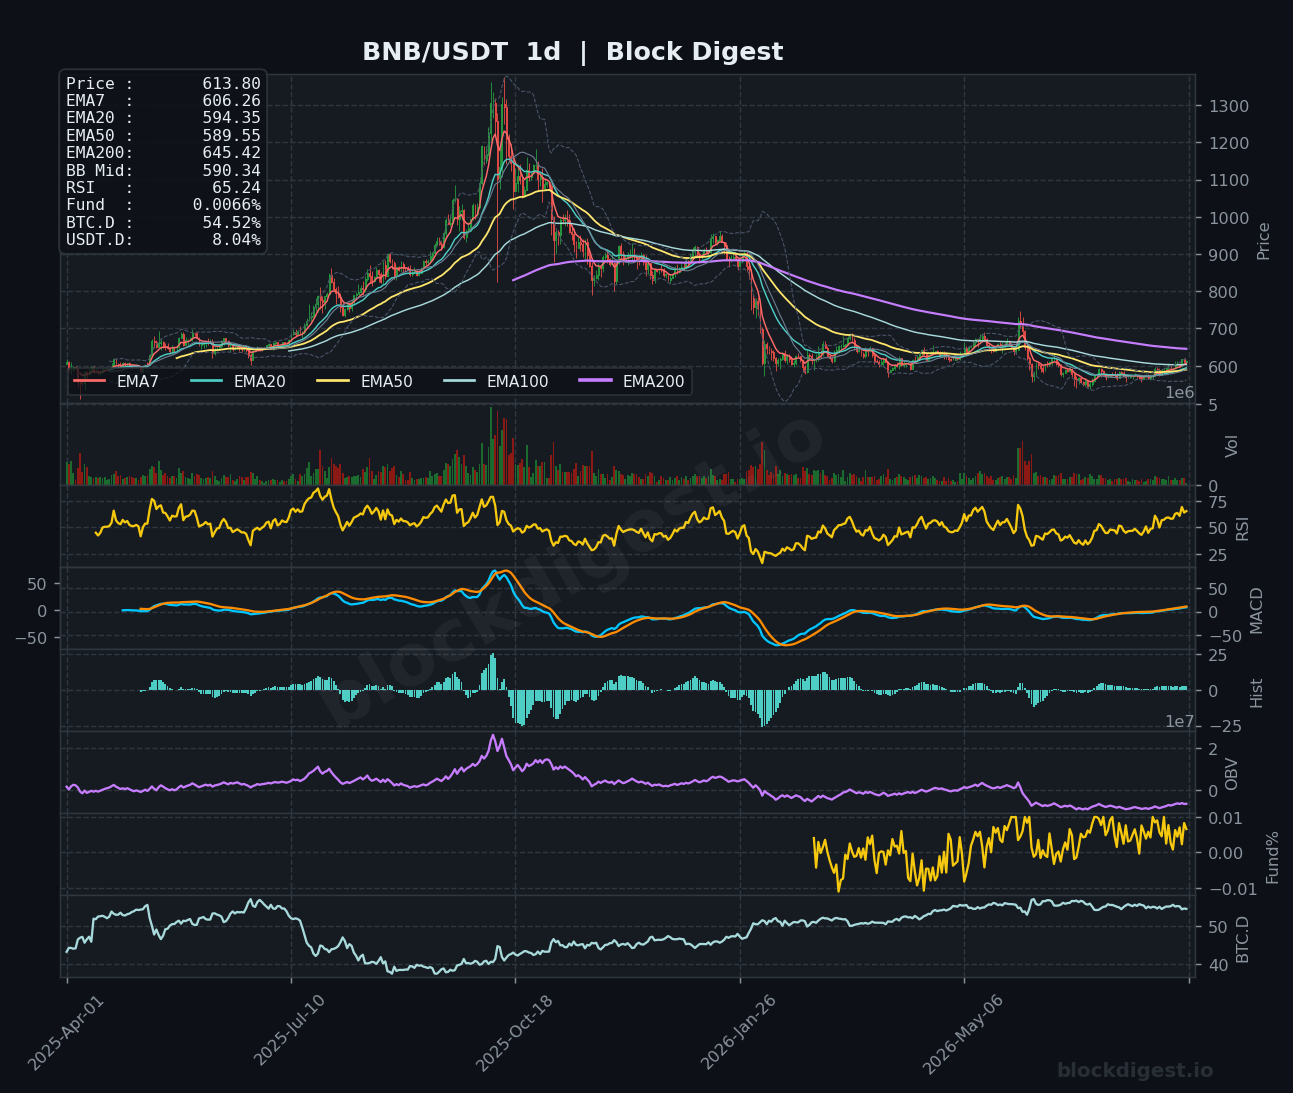
BNB is the relative standout among today’s coverage, trading at $613.81 with a bullish EMA alignment on the 1H chart — price above all major moving averages with EMA7 ($612.80) leading above EMA200 ($602.30) and the 1H RSI at 57.42, suggesting healthy but not overextended momentum. The 4H chart reinforces this constructively, with RSI at 61.34 and MACD edging into positive territory after a prolonged base-building phase between $570–$590. On the daily chart, the RSI has climbed to a robust 65.24, the strongest reading among all six coins reviewed, and OBV on the 1H timeframe shows a consistent upward slope — a notable divergence from the negative OBV trends observed across most other altcoins in this review. Key resistance sits near $620–$625; a clean breakout there opens the door toward $640, while $600 remains the critical short-term support to hold.
Dogecoin (DOGE)
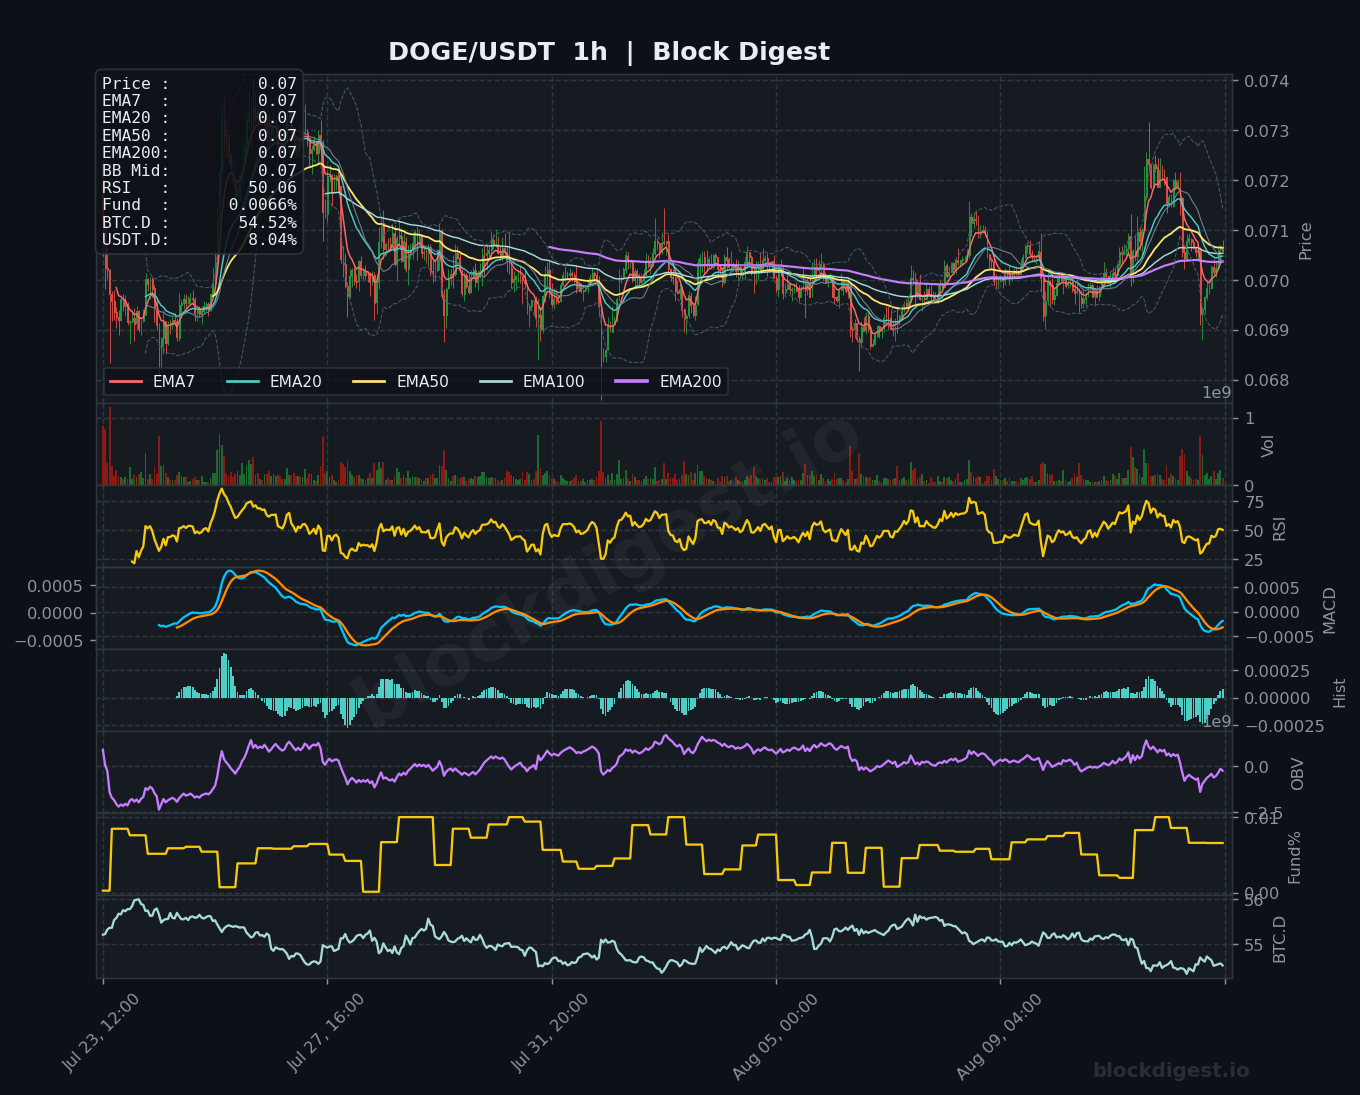
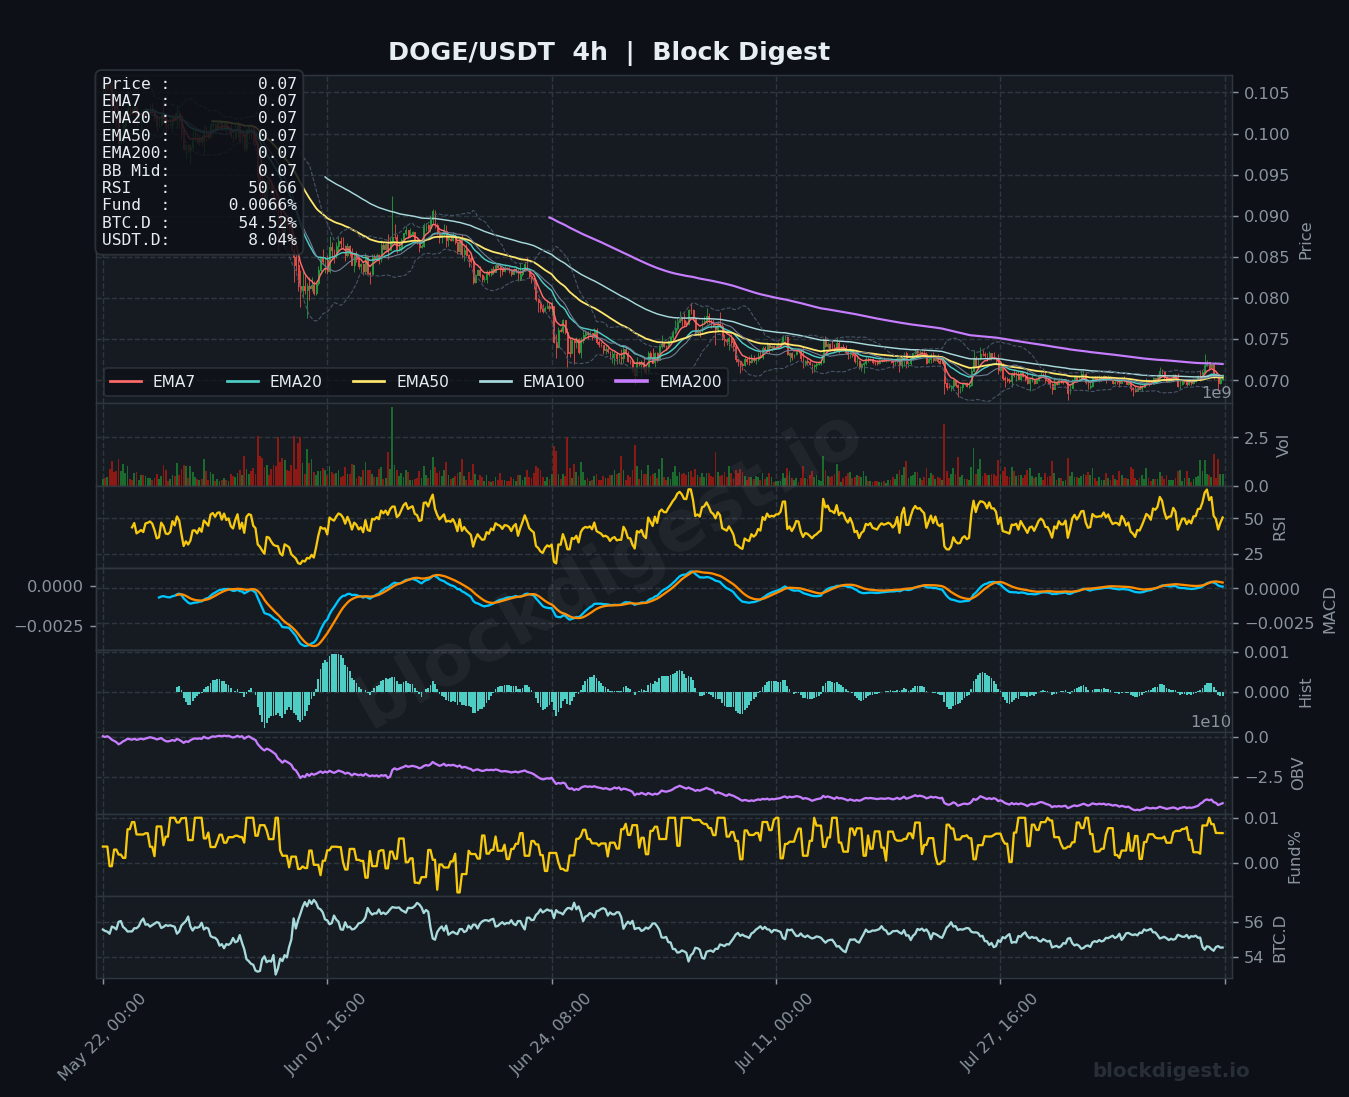
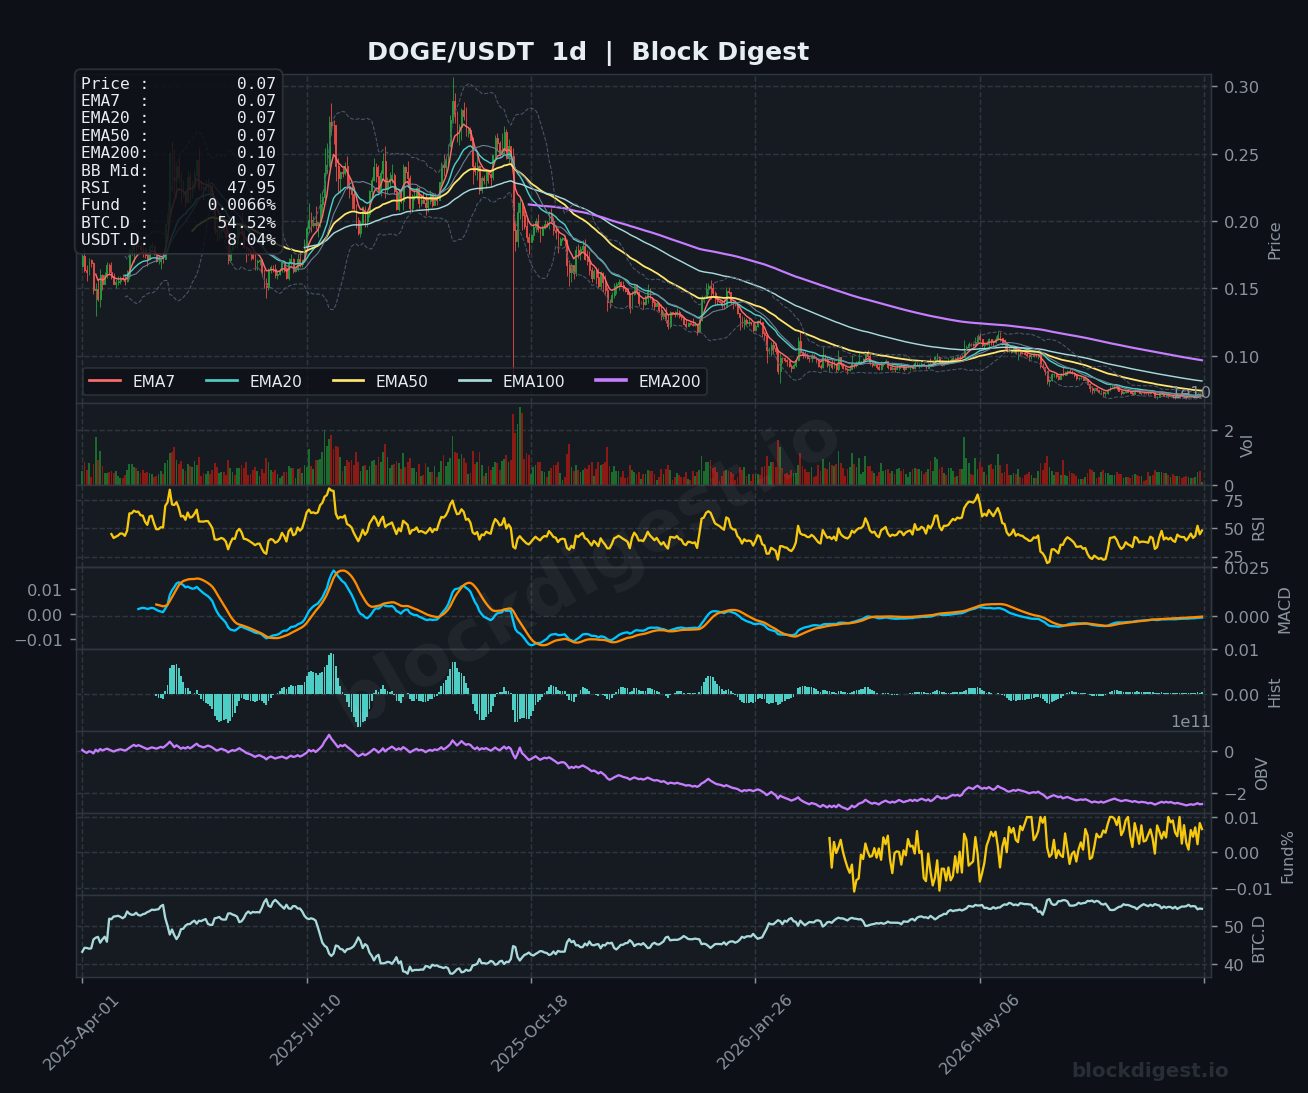
DOGE is trading at approximately $0.0708, consolidating tightly around its flat EMAs on the 1H chart with RSI at 50.06 — precisely mid-range and offering little directional signal in the short term. The 4H chart, however, tells a more sobering story: DOGE has been in a sustained downtrend since its 2025 highs above $0.26, and while the most recent price action has stabilized near $0.069–$0.073, the EMA200 on the 4H ($0.07) remains a significant overhead drag. The daily chart shows RSI at 47.95 with the MACD signal lines hovering near zero and OBV in prolonged decline, suggesting accumulation has not yet materialized in any meaningful way. A clean hourly close above $0.073 with volume expansion would shift the short-term bias to cautiously bullish; below $0.069, the next meaningful support cluster sits near $0.065.
Litecoin (LTC)
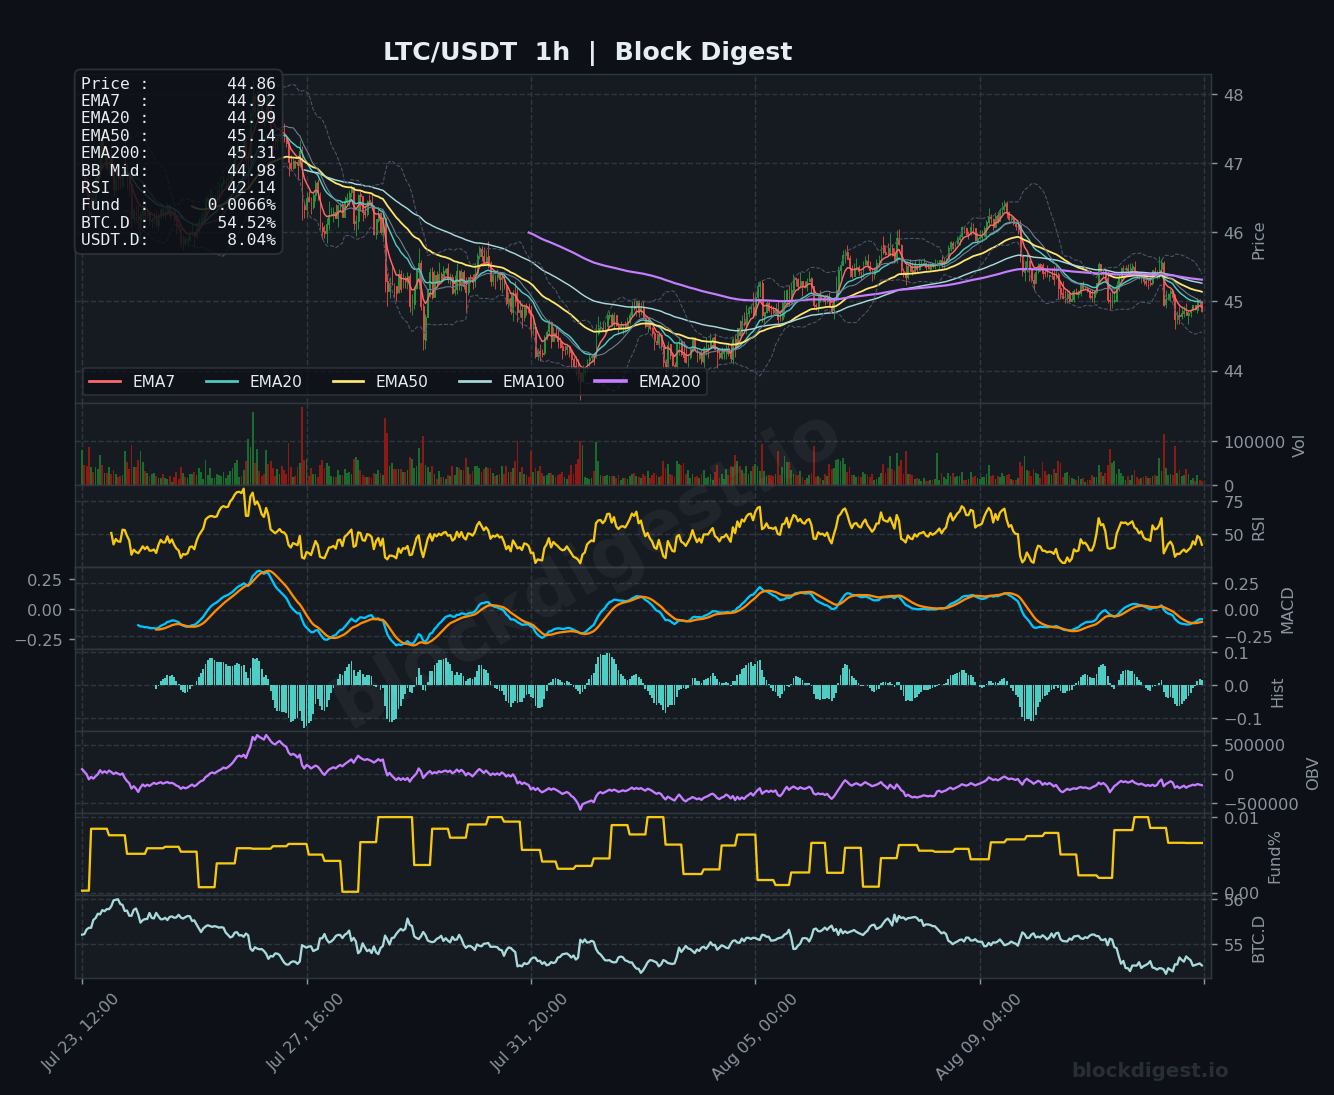
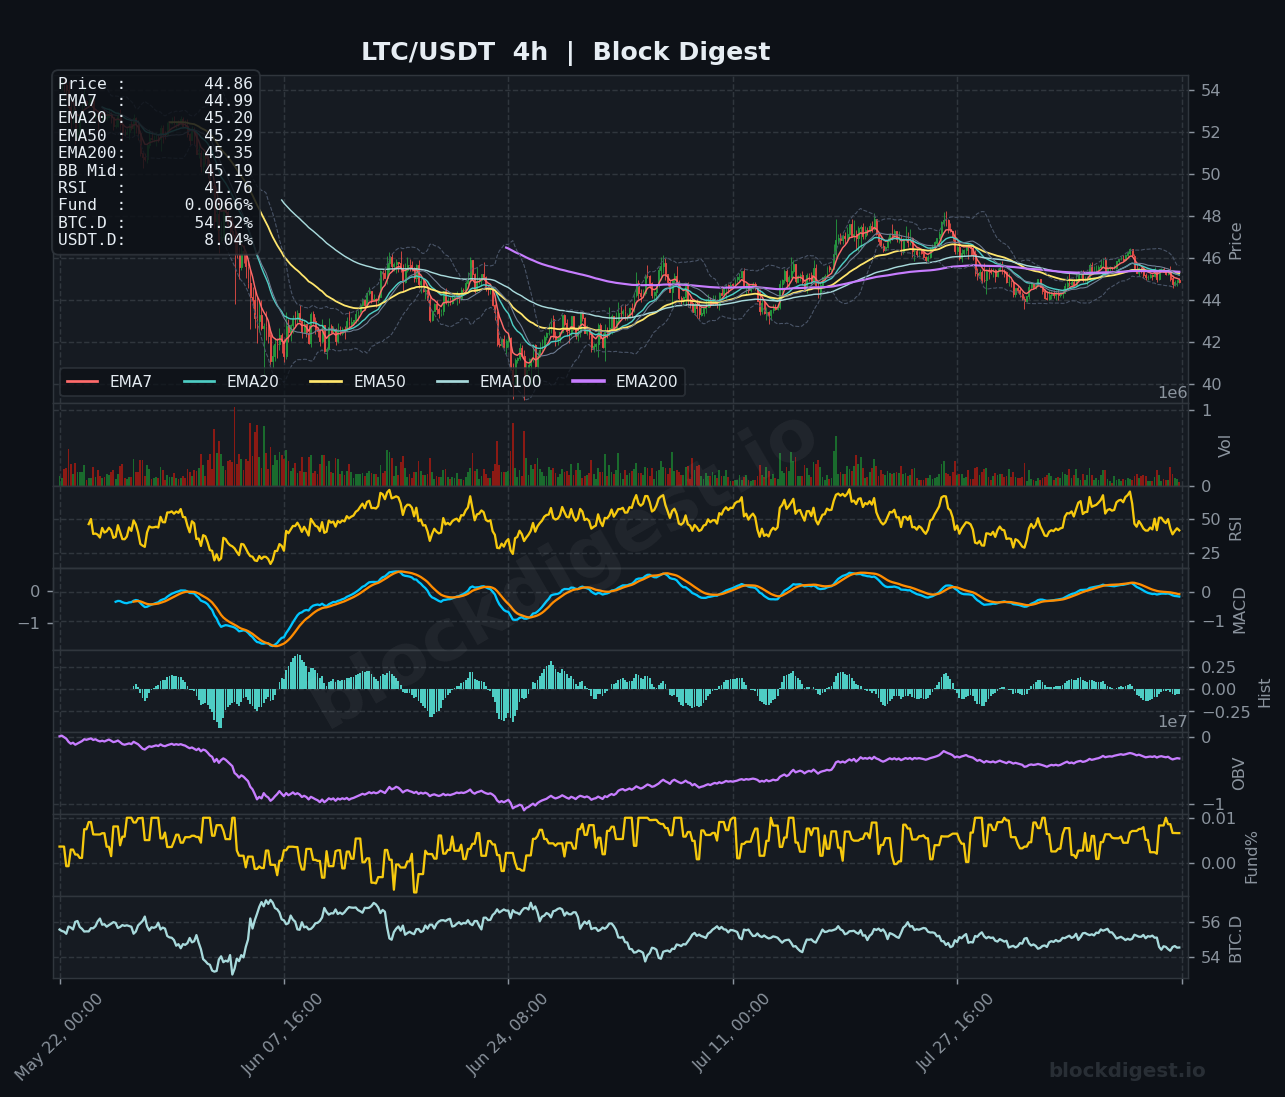
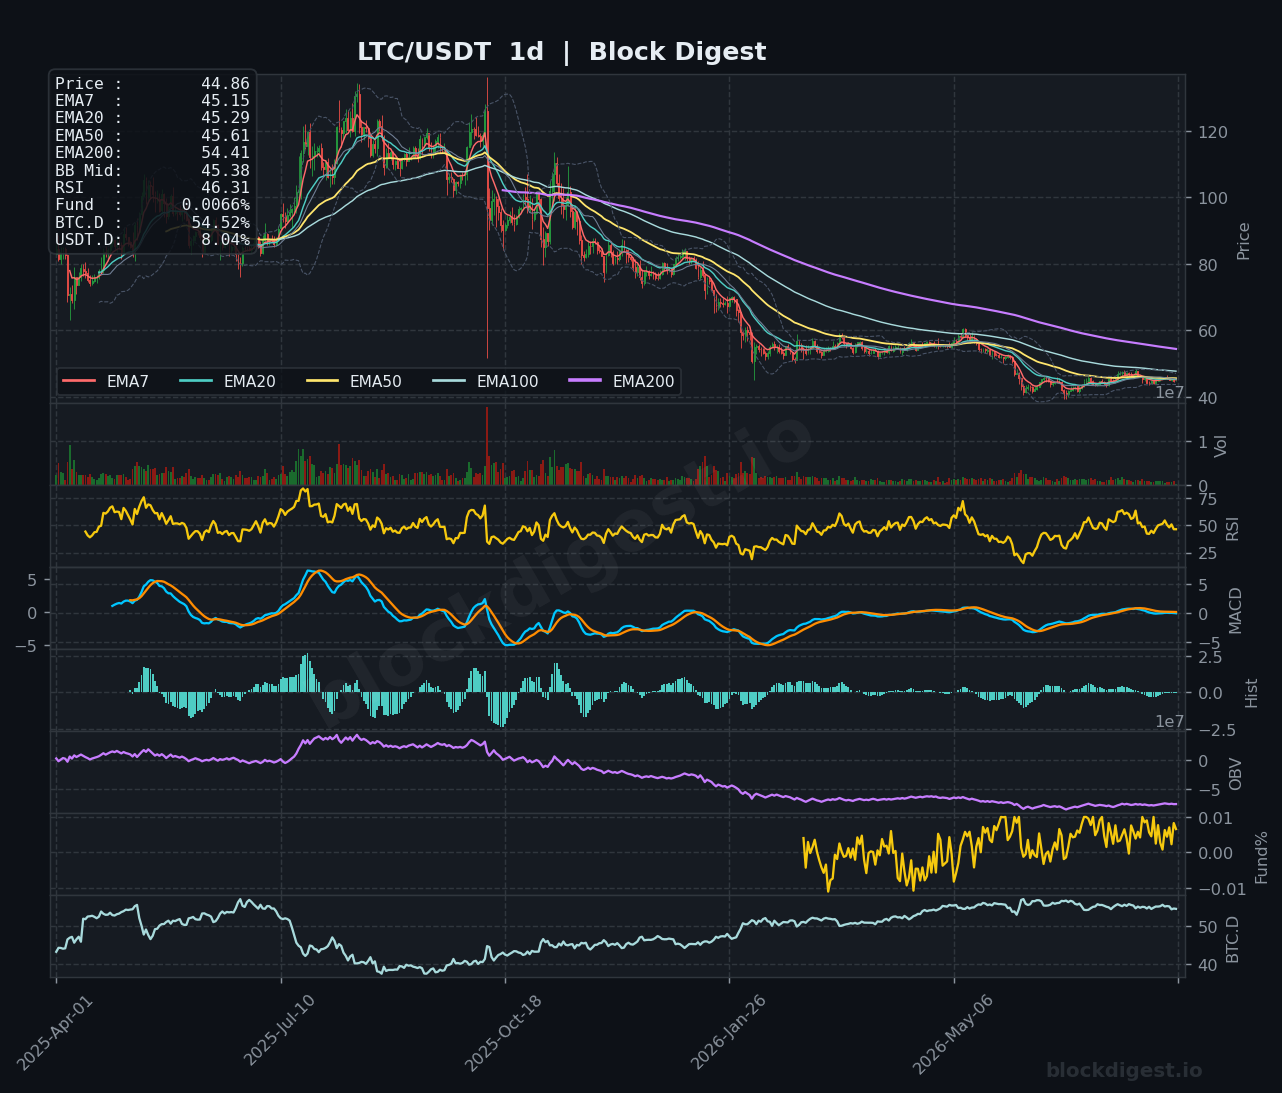
LTC is one of the weaker setups in today’s review, trading at $44.86 with price sitting below all key EMAs on the 1H chart (EMA7: $44.92, EMA50: $45.14, EMA200: $45.31) and an RSI of just 42.14 — edging toward oversold territory without yet producing a meaningful bounce. The 4H chart confirms the weakness, with RSI at 41.76, MACD negative, and OBV in a multi-month decline that shows no sign of base formation. On the daily timeframe, LTC has been in a persistent structural downtrend since its peak above $100, with price now trading near multi-year support in the $44–$46 zone; the daily RSI at 46.31 and a bearish EMA stack (EMA200 at $54.41 acting as distant overhead resistance) underscore the lack of bullish catalysts. Short-term bias is bearish-to-neutral, with $44.00 as the immediate support floor and $46.50 representing a key area bulls need to reclaim.
TRON (TRX)
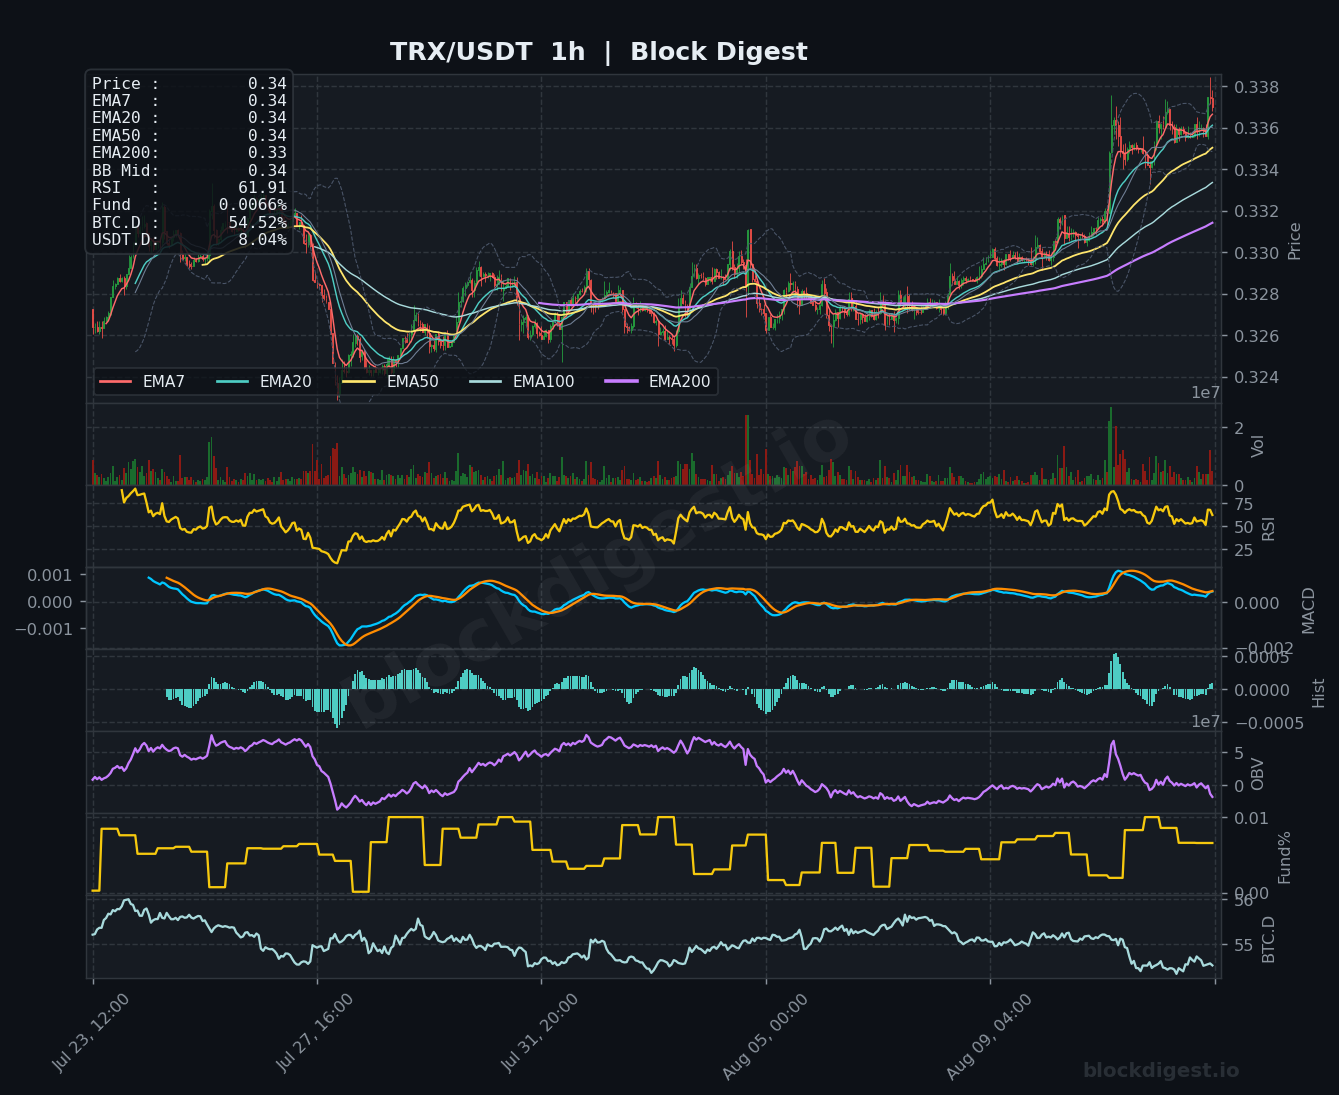
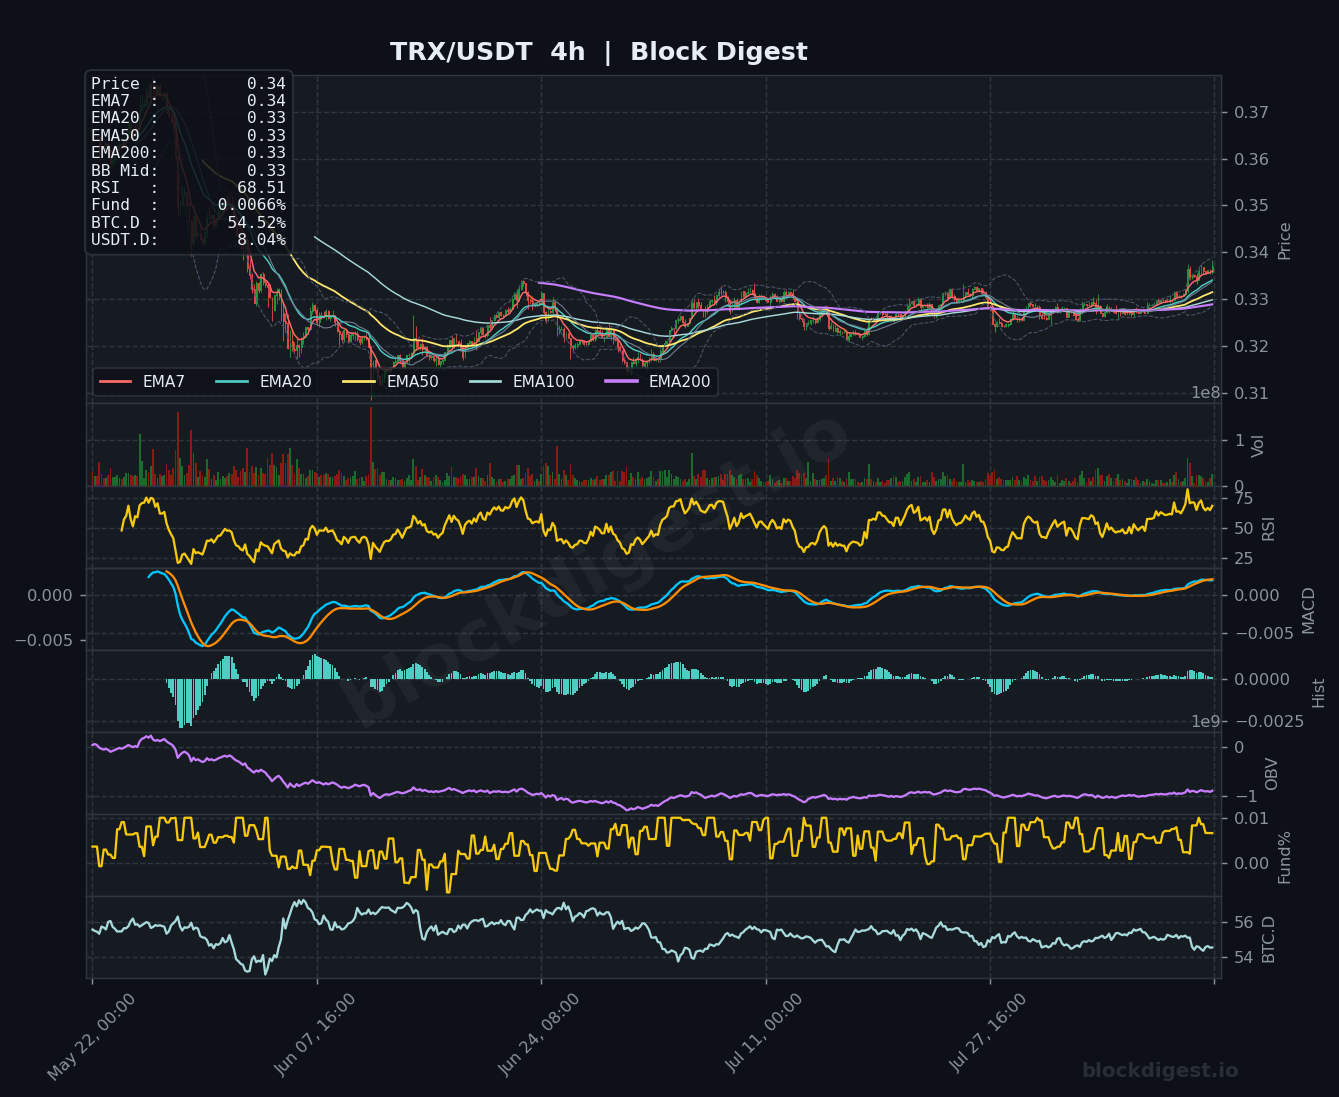
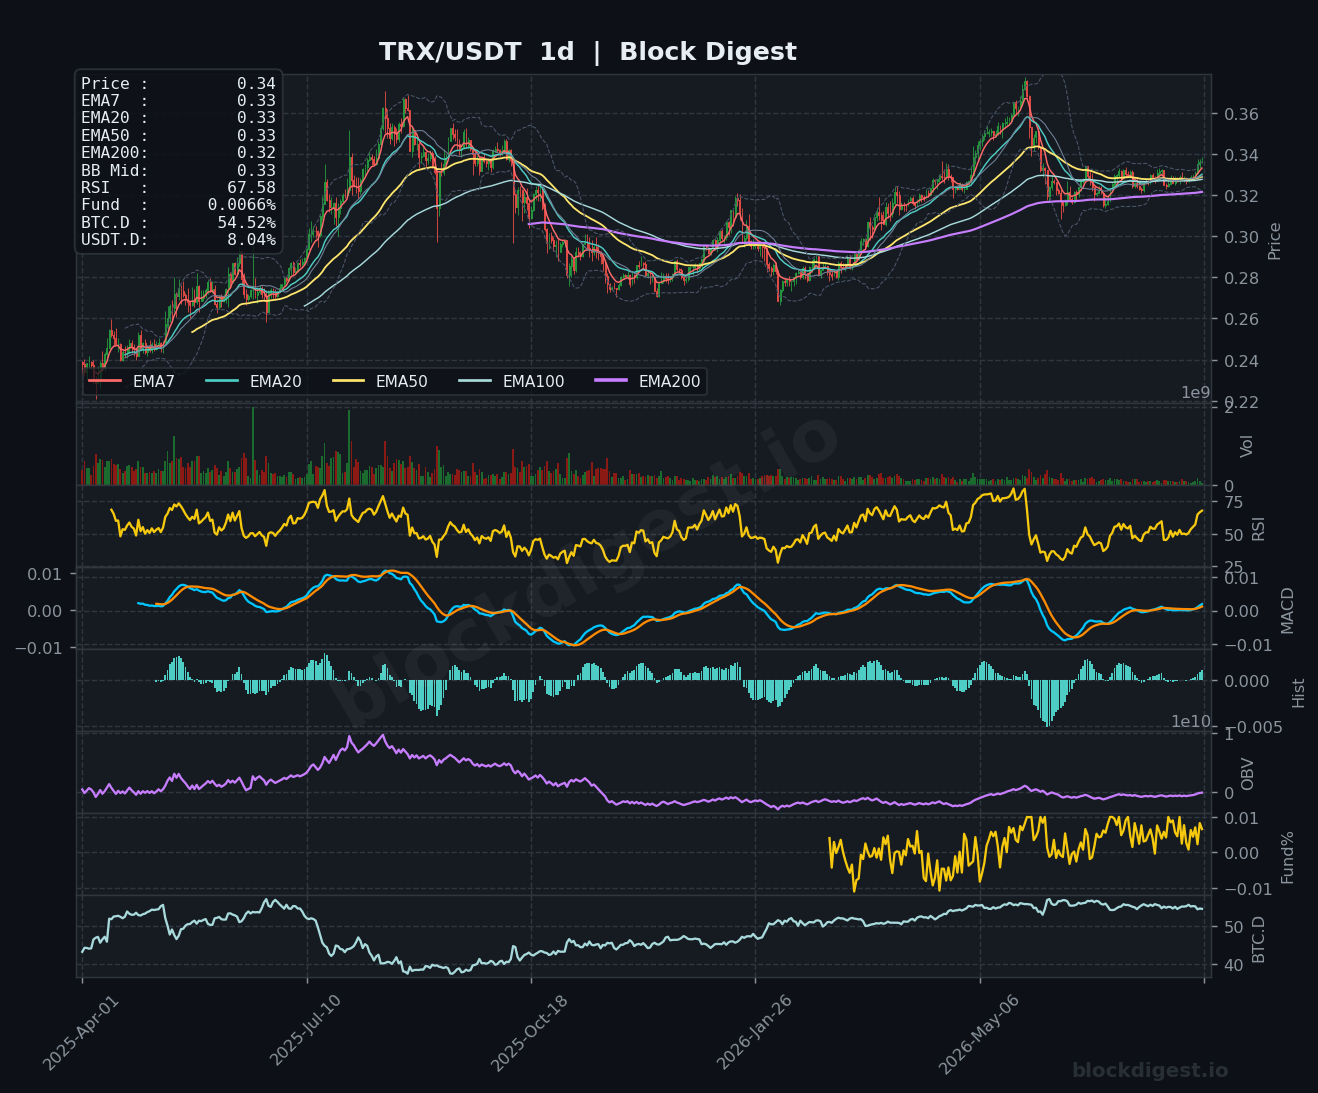
TRX is the most technically compelling chart in today’s review, with price at $0.3381 breaking out of its recent consolidation range with a notably bullish configuration across all timeframes. The 1H RSI sits at 61.91 and the 4H RSI has climbed to 68.51, approaching but not yet in overbought territory, while price is cleanly above all EMAs with a bullish fan formation developing on the 1H chart. The daily chart is equally constructive: RSI at 67.58 and MACD turning positive after a prolonged bearish phase, with the EMA200 ($0.32) now functioning as support rather than resistance — a significant structural development. Our BD Pulse OBV trend reading of -1 across the broader market is a notable counterpoint worth monitoring, as broader capitulation in on-chain volume could cap TRX’s upside; immediate resistance is at $0.338–$0.340, with a sustained break above that level targeting $0.350+.
Altcoin Outlook
The altcoin landscape on August 13, 2026 is one of stark divergence: BNB and TRX are displaying the strongest technical structures with bullish EMA alignments, positive MACD momentum, and relatively healthy RSI readings across multiple timeframes, while LTC and XRP represent the weakest setups with persistent downtrends and below-midline momentum indicators. SOL and DOGE sit in a precarious middle ground — stabilized but lacking the volume and momentum confirmation needed for sustained directional moves. With our BD Pulse Score at just 32/100 and the Long/Short Account Ratio sitting at 1.71 (63.1% long exposure), the market is leaning long in positioning but bearish in conviction — a combination that can amplify downside quickly if Bitcoin loses the $62,300 floor. Traders should watch BTC dominance closely: any sustained move below 54% would be the clearest signal that altcoin season conditions are returning, while a push above 56% would likely invalidate most near-term bullish altcoin setups across the board.
Disclaimer: This analysis is for informational purposes only and does not constitute financial advice. Cryptocurrency markets are highly volatile and unpredictable. All trading decisions should be made based on your own research and risk tolerance. Block Digest is not responsible for any financial losses incurred as a result of acting on this content.
Stay Ahead of the Market
Follow BlockDigest for crypto market intelligence, research and real-time updates.