
Market Overview
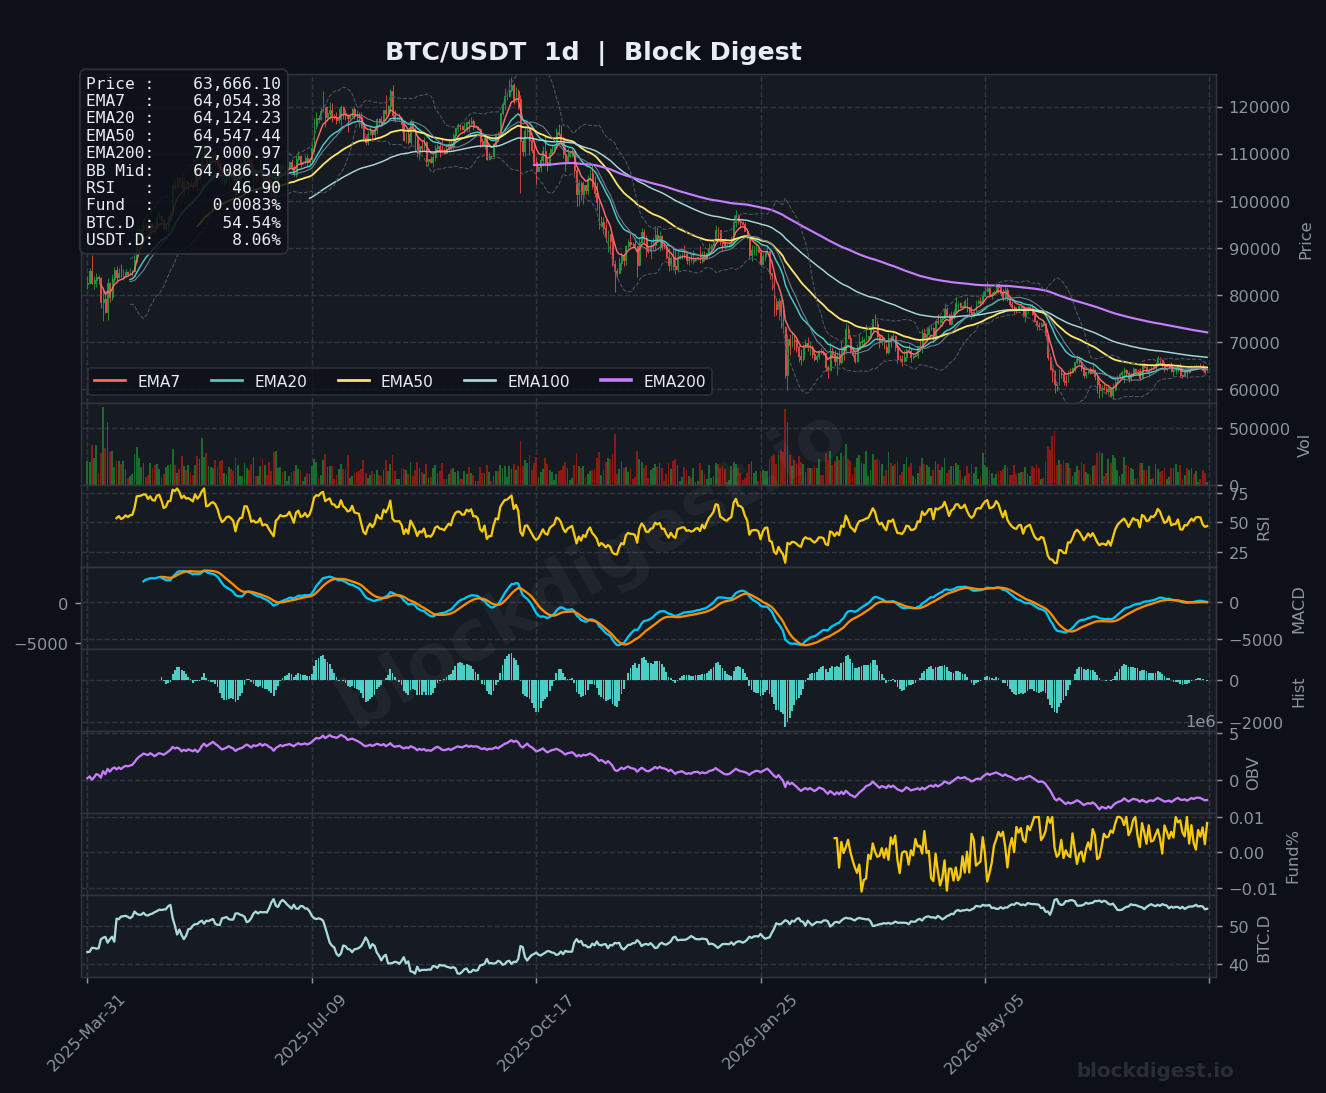
Bitcoin is trading at $63,666, sitting below a tightly clustered band of daily EMAs that are compressing between $64,054 (EMA7) and $64,547 (EMA50), with the 200-day EMA looming far above at $72,001 — a clear reminder that the broader trend remains corrective. Price is currently below the Bollinger Band midline of $64,087 on the daily chart, suggesting near-term bearish momentum after failing to sustain the push above $65,000 seen over the past several sessions. The daily structure shows a series of lower highs since the cycle peak, and BTC is now wrestling with a dense overhead EMA cluster that has repeatedly capped rallies. While the weak U.S. jobs print has provided a macro tailwind by reducing rate-hike probability, the technical picture has yet to confirm any meaningful structural shift.
Multi-Timeframe Confluence
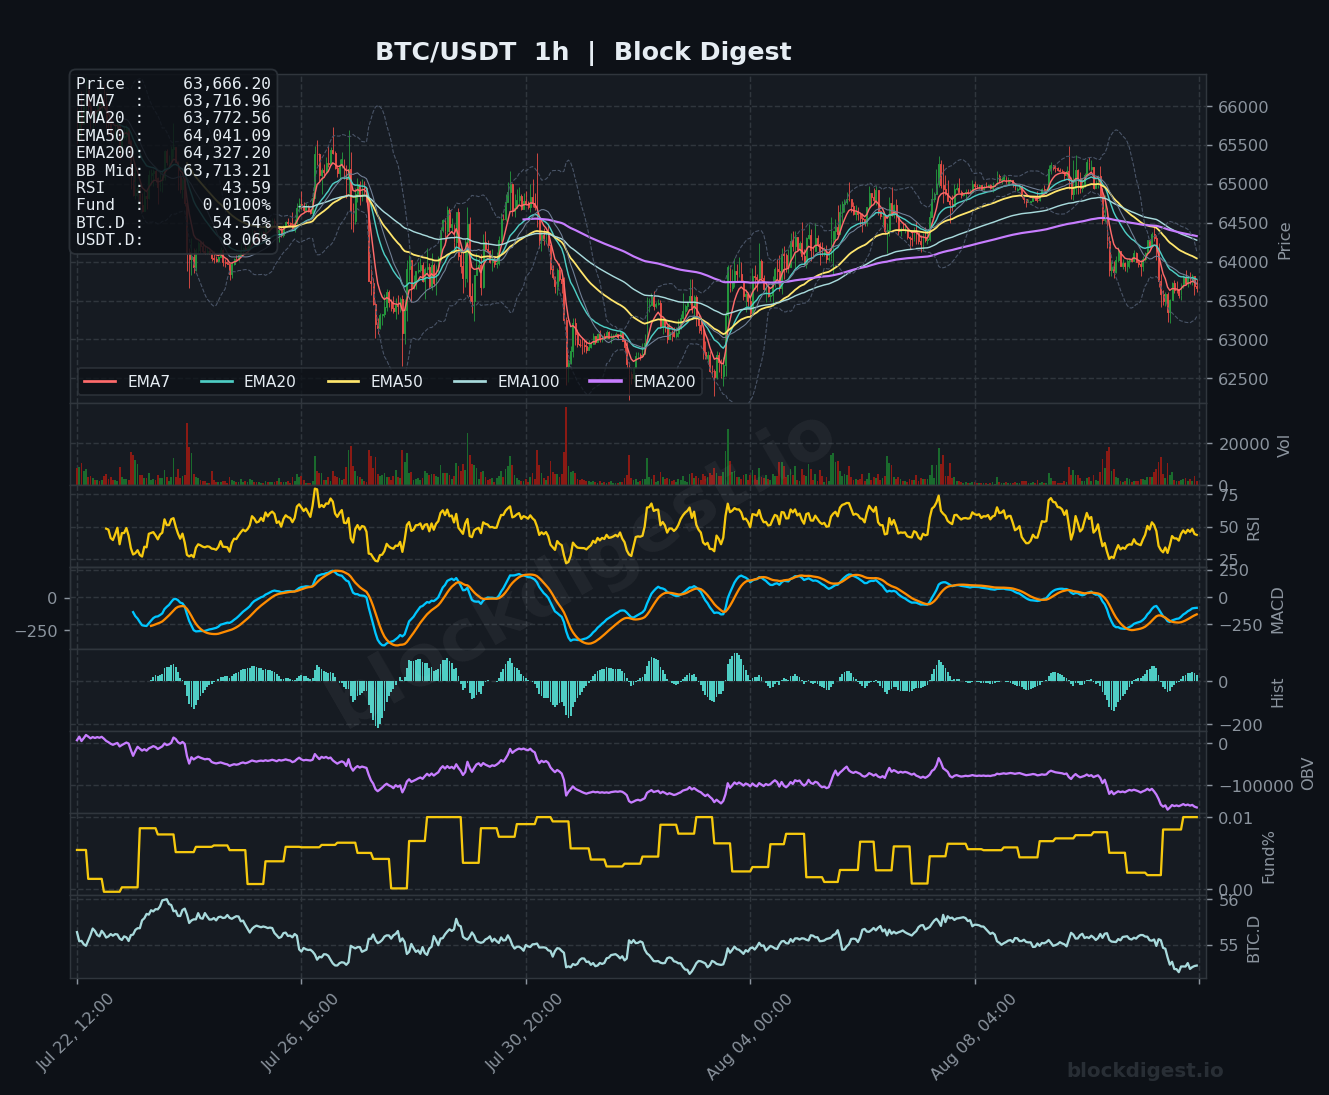
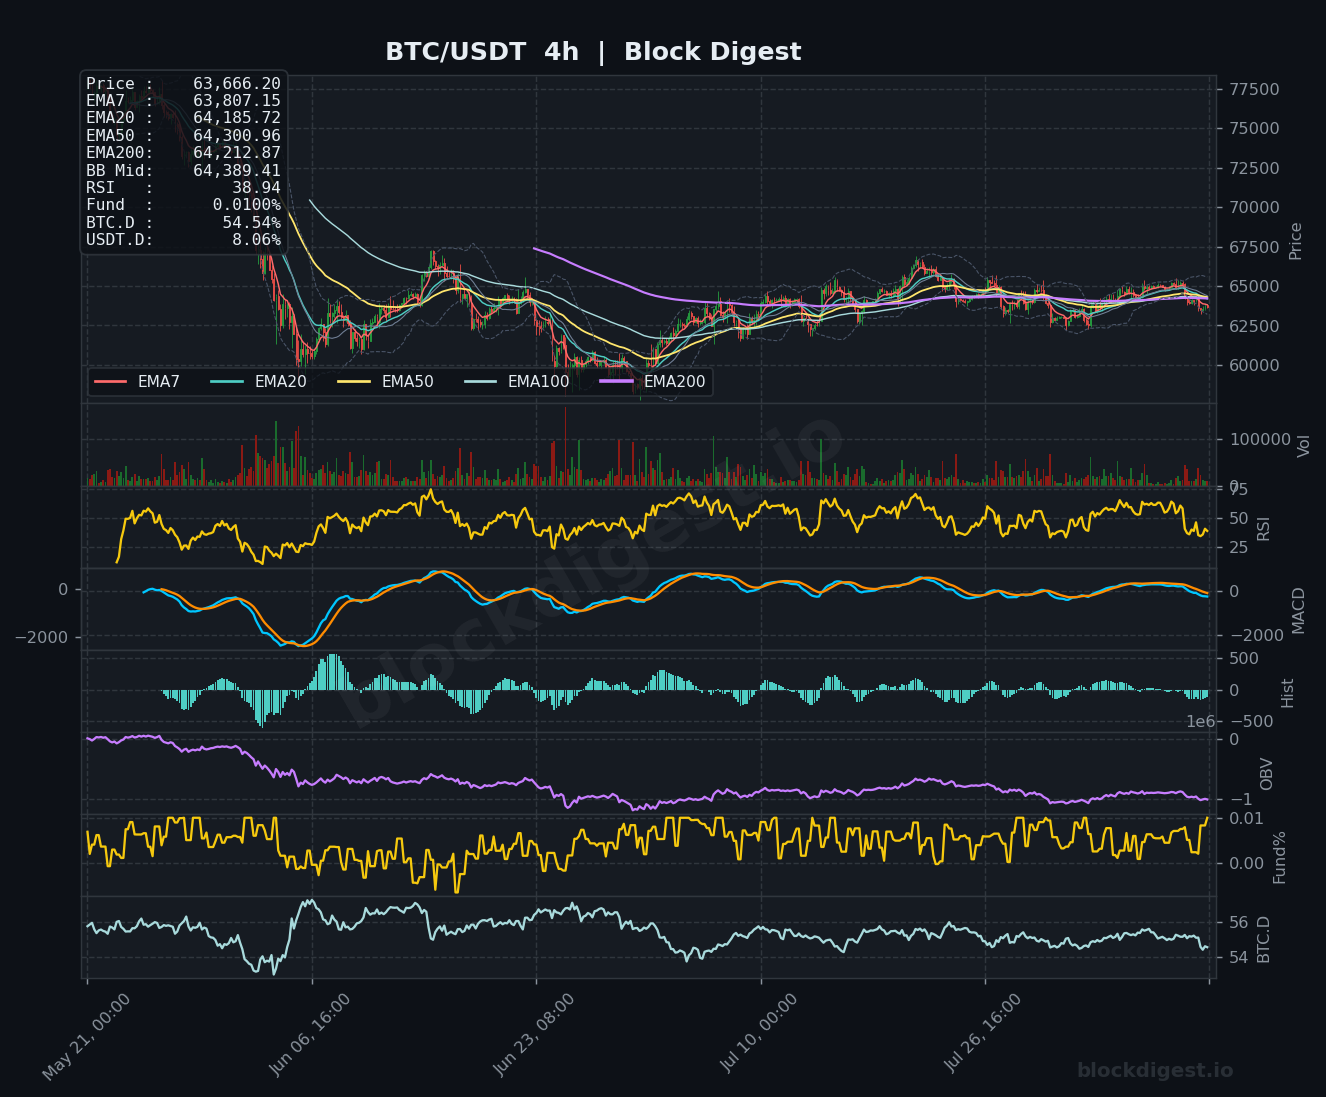
On the 1-hour chart, price has slipped back below all short-term EMAs (EMA7 at $63,717, EMA20 at $63,773, EMA50 at $64,041, and EMA200 at $64,327), indicating sellers have reasserted control following the recent $65,000 rejection. The 4-hour chart paints a similar picture, with price trading beneath the EMA7 ($63,807), EMA20 ($64,186), EMA50 ($64,301), and EMA200 ($64,213), all of which are tightly stacked and beginning to flatten — a bearish convergence that typically signals indecision resolving to the downside. On the daily timeframe, the EMA cluster between $64,054 and $64,547 represents a formidable overhead wall, and price failing to reclaim this zone on a closing basis is a concerning signal for bulls. Short-term momentum on the 1h and 4h frames is clearly bearish and aligns with the corrective higher-timeframe structure, with no meaningful divergence offering contrarian hope at this stage.
Key Levels to Watch
- Resistance: $64,212–$64,547 — The confluent 4h and daily EMA cluster (EMA7 through EMA50) that has capped multiple recovery attempts and now represents the most immediate ceiling for any bounce.
- Resistance: $65,000–$65,200 — The psychological round number and recent multi-day high that was rejected; reclaiming this zone would significantly improve short-term sentiment.
- Resistance: $66,825 — The 100-day EMA on the daily chart, which represents the next major structural hurdle and would need to be cleared to shift the medium-term narrative toward recovery.
- Support: $63,000–$63,200 — A visible consolidation zone from prior price action on the 1h chart and a psychologically significant level; a decisive break here opens deeper downside.
- Support: $62,500 — The lower Bollinger Band region on the 1h timeframe and a recent swing low that acted as a base during prior selloffs.
- Support: $61,000–$61,500 — Deeper structural support visible on the 4h chart corresponding to the lows established during the extended base-building phase; loss of this zone would be materially bearish.
Momentum & On-Chain Signals
The RSI across timeframes is uniformly subdued — 43.59 on the 1h, 38.94 on the 4h, and 46.90 on the daily — with the 4h reading approaching oversold territory without yet triggering a bounce, which suggests selling pressure remains organized rather than exhausted. Block Digest’s proprietary BD Pulse score sits at just 38/100, a bearish reading that corroborates what the charts are showing: this is not a momentum-driven market. The MACD on the 4h chart shows the signal line hovering near zero with a mildly negative histogram, consistent with a market drifting lower without conviction; the daily MACD is similarly tepid, with both lines converging near the zero axis and no clear bullish crossover in sight. On-chain, the OBV trend registered a score of -1 in our BD Pulse model, and the visual OBV on all three charts shows a declining trajectory — a distribution pattern that suggests larger participants are not aggressively accumulating at current prices. Funding rates remain a slight positive at +0.0067%, indicating no extreme leverage buildup on either side, which reduces the risk of a sudden short squeeze or long liquidation cascade.
BTC Dominance & Market Sentiment
BTC dominance is reading 54.53% across all charts, consistent with our BD Pulse data, and the trend on the 1h chart shows dominance ticking lower in recent sessions — a subtle signal that some capital may be rotating toward altcoins even as the broader market softens. USDT dominance at 8.06% remains elevated, suggesting a meaningful pool of sidelined capital that has not yet committed to risk assets, which could act as dry powder for a rally but equally reflects lingering caution. Together, these readings paint a picture of a market in wait-and-see mode, neither fleeing to safety in force nor charging back into risk — broadly consistent with the macro uncertainty surrounding the Federal Reserve’s September decision.
Risk Scenarios
- Bullish case: A daily close back above the $64,547 EMA50 and subsequent reclaim of $65,000 — ideally on expanding volume — would suggest the recent pullback is a healthy consolidation within a recovery leg, targeting the $66,825 100-day EMA next. Confirmation of a Fed pause at the September 16 meeting could provide the macro catalyst to accelerate this move.
- Bearish case: A sustained break below $63,000 on the daily chart, particularly if accompanied by rising USDT dominance and a further deterioration of the BD Pulse score, would signal that the $65,000 rejection was a false breakout and shift the focus toward the $61,000–$61,500 support zone. In this scenario, the daily EMA cluster overhead would flip to firm resistance, making a recovery materially more difficult.
Outlook
The short-term bias leans cautiously bearish as BTC consolidates below a dense EMA cluster on the daily chart and all key short-term moving averages on the 1h and 4h frames. The macro backdrop — particularly the weak U.S. jobs data and growing Fed pause expectations — provides a genuine fundamental case for recovery, but technical momentum indicators are not yet confirming that narrative, and the BD Pulse’s bearish 38/100 reading adds weight to the case for patience. The critical trigger to watch over the next 24–48 hours is whether BTC can reclaim and close above $64,547 on the daily; failure to do so keeps the path of least resistance pointed toward a retest of $63,000 and potentially lower. Until the daily EMA cluster is convincingly recaptured, this market is best characterized as bearish consolidation at support — a setup that demands disciplined risk management rather than aggressive directional positioning.
Disclaimer: This analysis is for informational purposes only and does not constitute financial advice. Cryptocurrency markets are highly volatile and unpredictable. All trading decisions should be made based on your own research and risk tolerance. Block Digest is not responsible for any financial losses incurred as a result of acting on this content.
Stay Ahead of the Market
Follow BlockDigest for crypto market intelligence, research and real-time updates.


