ETH Daily Analysis — May 06, 2026
ETH Daily Analysis – May 06, 2026
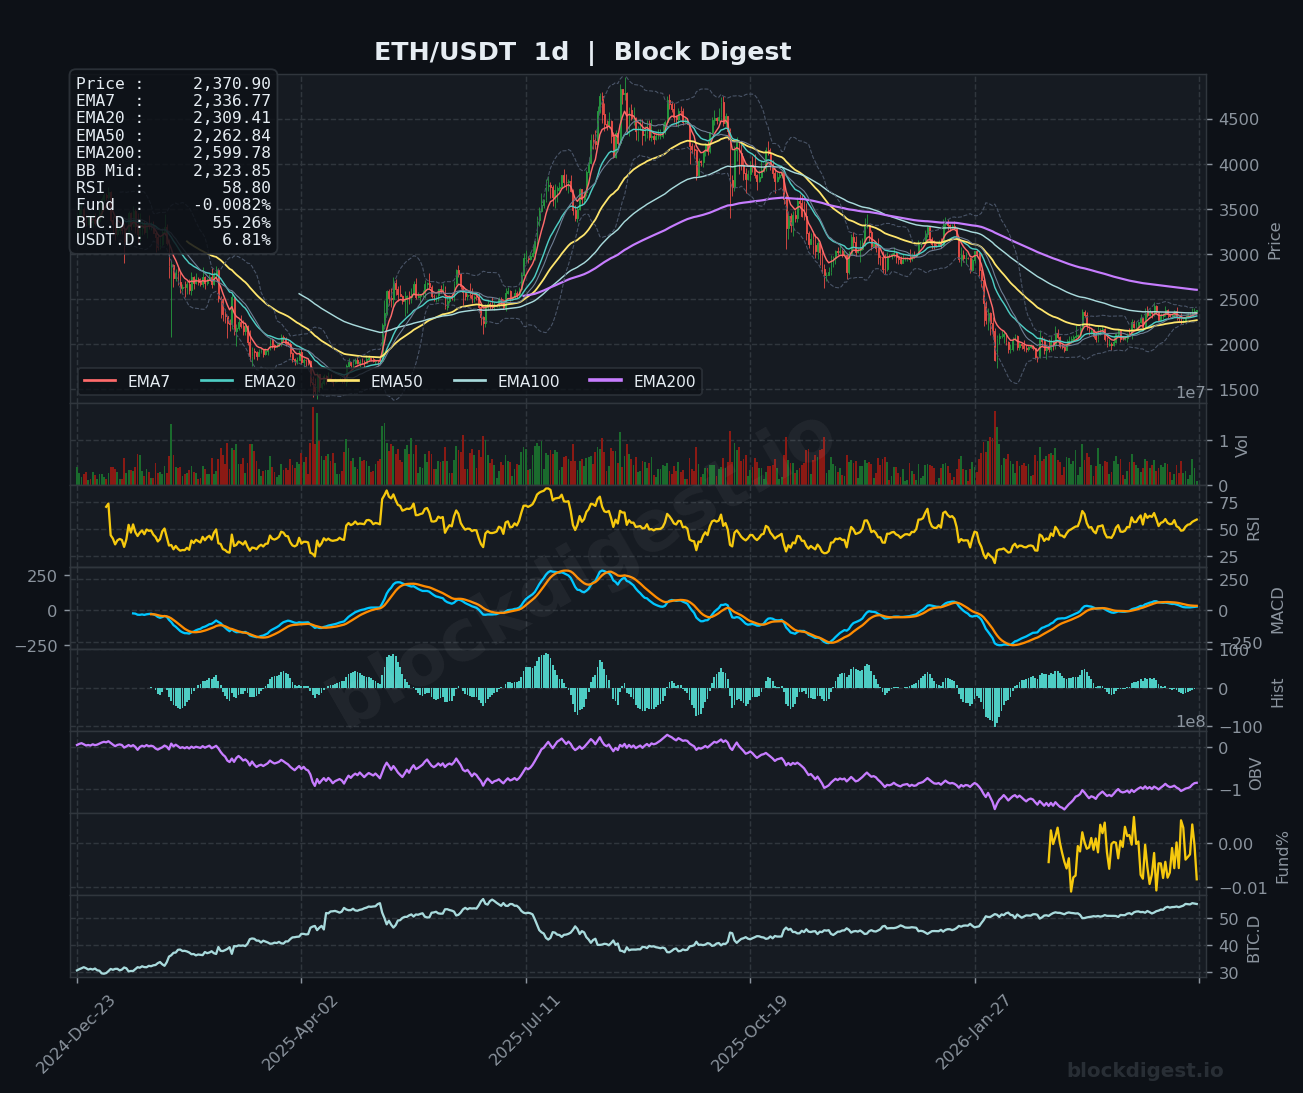
Market Overview
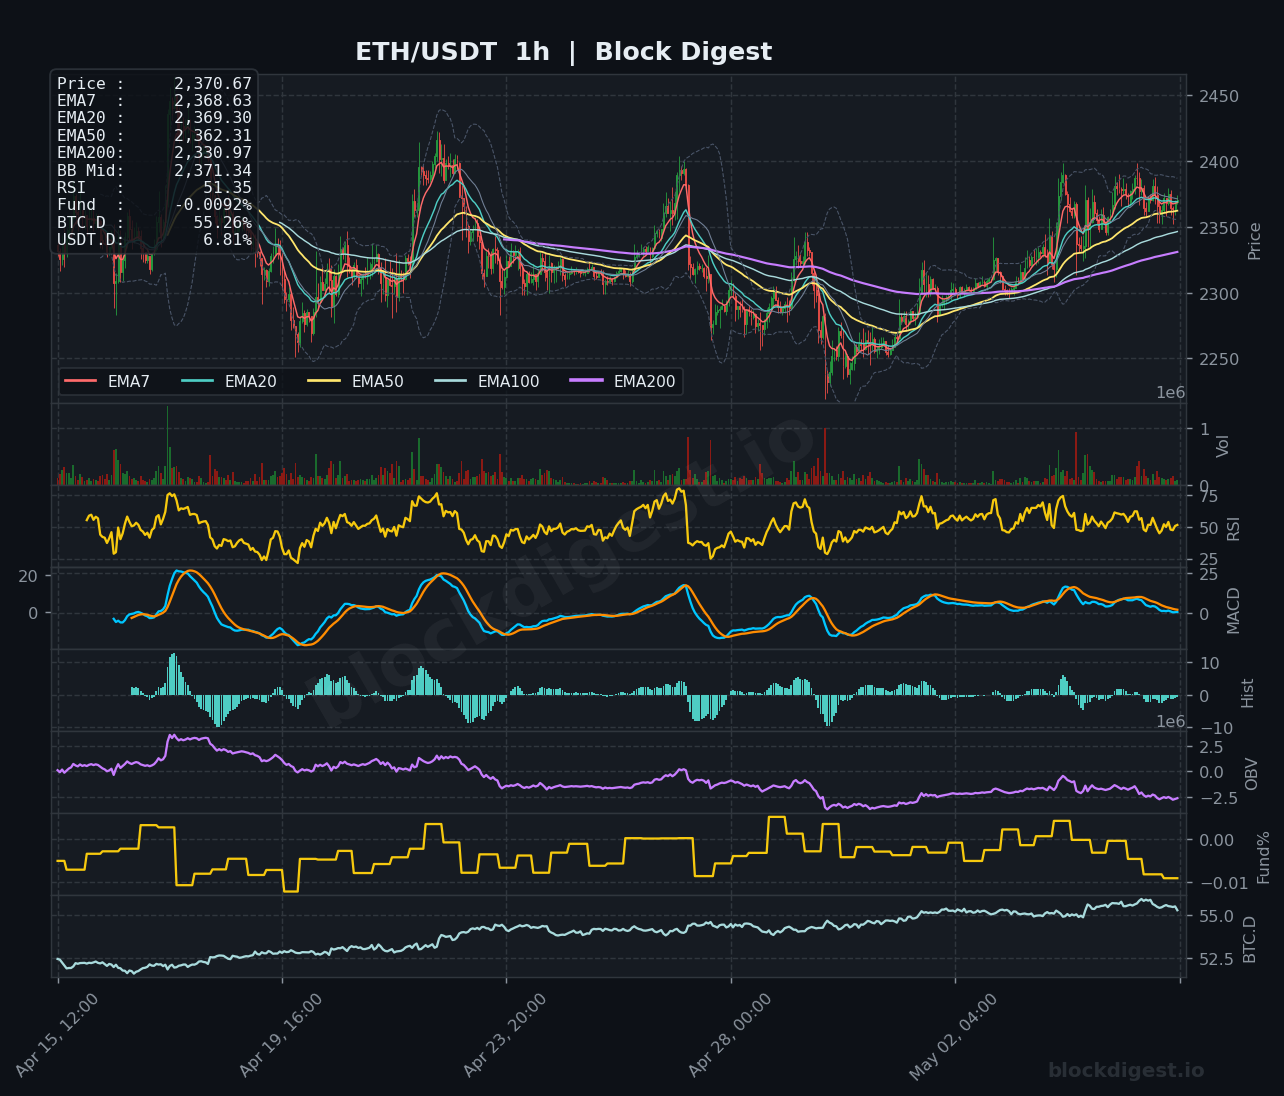
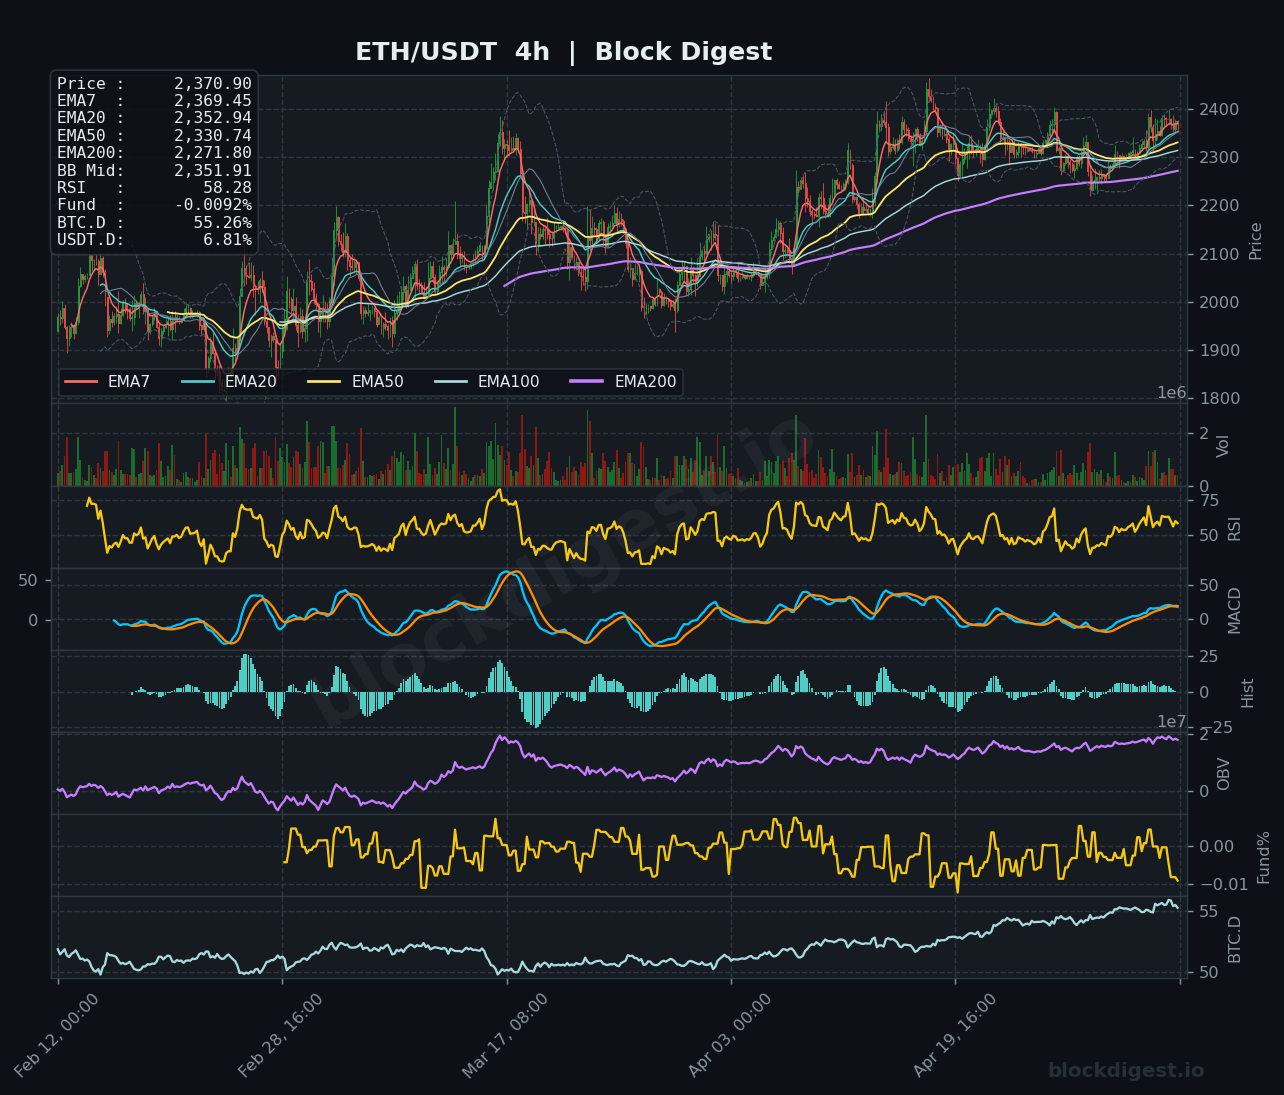
ETH is trading at $2,370.90, consolidating within a narrow range just above the EMA20 ($2,352.94 on 4h) after establishing a higher low structure. The daily timeframe reveals price attempting to hold above the EMA50 at $2,262.84 while remaining compressed below the EMA200 at $2,599.78, indicating a neutral-to-bullish intermediate setup. On the 1-hour chart, price is tightly coiled around the Bollinger Band midpoint ($2,371.34), suggesting an imminent volatility expansion. The daily trend remains constructive as long as the EMA50 support holds, though overhead resistance from declining longer-term moving averages continues to cap upside momentum.
Multi-Timeframe Confluence
The 1-hour, 4-hour, and daily charts show improving alignment, with all short-term EMAs (7, 20, 50) now positively sloped across timeframes, signaling strengthening momentum. The $2,330-$2,350 zone represents confluent support where the 4h EMA50 ($2,330.74), 1h EMA200 ($2,330.97), and daily EMA20 ($2,309.41) converge, creating a critical demand cluster. However, short-term price action on the 1h shows consolidation fatigue with declining volume, while the 4h timeframe displays healthier distribution of buying pressure. The daily structure suggests this consolidation is a continuation pattern within a broader recovery from the January lows near $1,600, but confirmation requires a decisive break above $2,400.
Key Levels to Watch
Resistance:
- $2,400-$2,420: Local swing high and psychological resistance coinciding with prior rejection zones; breakthrough here opens path to $2,500+
- $2,450: Mid-April high representing the next major supply zone and Bollinger Band upper boundary on the 4h timeframe
- $2,600: EMA200 on the daily chart serving as the primary macro resistance level that has capped rallies since late 2025
Support:
- $2,330-$2,350: Critical confluence zone with EMA50 (4h), EMA200 (1h), and Bollinger Band mid-line providing layered support
- $2,270-$2,300: Daily EMA50 and EMA20 cluster representing the last defense before trend deterioration
- $2,200: Psychological support and February lows; breakdown here would invalidate the bullish structure and target $2,000
Momentum & On-Chain Signals
RSI readings show neutral-to-slightly-bullish positioning across all timeframes: 51.35 (1h), 58.28 (4h), and 58.80 (daily), indicating room for upside expansion without immediate overbought concerns. The MACD on both 1h and 4h timeframes displays positive histogram readings with bullish crossovers intact, though momentum is flattening on the 1h suggesting consolidation continuation. OBV trends remain constructive on higher timeframes with gradual accumulation patterns visible since early April, indicating sustained buying interest despite sideways price action. Funding rates at -0.0092% reflect slight short bias in perpetual markets, which could fuel a short squeeze if bulls reclaim $2,400, while the minor negative rate suggests no excessive leverage buildup on either side.
BTC Dominance & Market Sentiment
BTC.D at 55.26% continues its gradual uptrend, indicating ongoing capital rotation toward Bitcoin and suggesting risk-off sentiment within crypto markets that may limit ETH’s upside potential in the near term. USDT.D at 6.81% has stabilized after recent increases, showing stablecoin dominance is not aggressively rising, which typically signals market participants are not rushing to exit positions. The combination suggests a cautious market environment where ETH may underperform BTC during rallies but could benefit from renewed altcoin appetite if BTC.D peaks and reverses near resistance zones.
Risk Scenarios
Bullish case: A decisive 4h close above $2,400 with expanding volume would confirm continuation, targeting $2,450 initially and $2,500-$2,600 on extension, particularly if BTC.D begins declining and RSI breaks above 65 on the daily timeframe.
Bearish case: Failure to hold $2,330 with a daily close below the EMA50 ($2,262.84) would signal trend exhaustion, targeting $2,200 and potentially retesting the $2,000 psychological level if selling accelerates with increasing OBV distribution.
Outlook
ETH remains in a constructive but indecisive pattern, with the bias tilting slightly bullish as long as the $2,330-$2,350 support cluster holds intact. The next 24-48 hours will be critical for direction, with a break and hold above $2,400 serving as the primary bullish trigger, while a break below $2,330 would warrant defensive positioning. Watch for volume expansion and RSI momentum divergence on lower timeframes as early signals of the impending breakout direction. The overall setup favors patience, with the risk/reward improving for long entries only above $2,400 or on confirmed support defense near $2,330 with bullish reversal patterns.
Disclaimer: This analysis is for informational purposes only and does not constitute financial advice. Cryptocurrency markets are highly volatile and unpredictable. All trading decisions should be made based on your own research and risk tolerance. Block Digest is not responsible for any financial losses incurred as a result of acting on this content.