
Market Overview
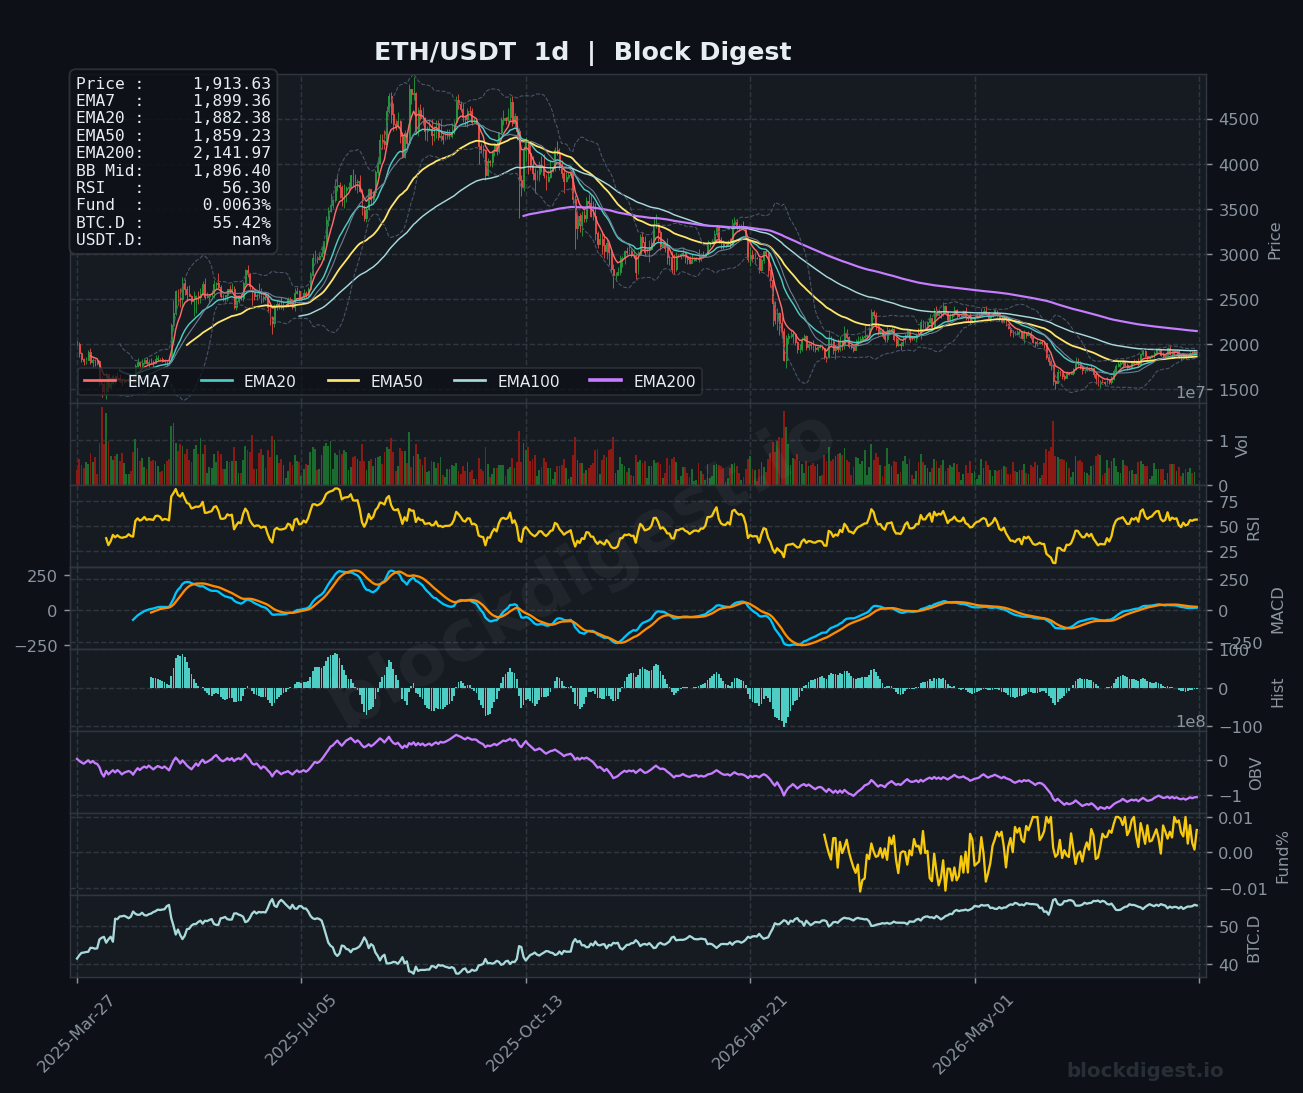
Ethereum is trading at $1,913.64 as of August 8, 2026, consolidating just above the psychologically significant $1,900 level after a multi-week recovery from lows near $1,600 seen earlier this summer. On the daily timeframe, price has reclaimed the EMA7 ($1,899.36), EMA20 ($1,882.38), and EMA50 ($1,859.23), signaling a meaningful structural shift after a prolonged bear trend — though the EMA200 at $2,141.97 remains a formidable overhead ceiling. Price is trading marginally above the daily Bollinger Band midline at $1,896.40, suggesting the market is attempting to establish the upper half of the BB range as its new base. The dominant daily trend remains technically bearish on the macro scale given the EMA200 suppression, but near-term price action is constructive.
Multi-Timeframe Confluence
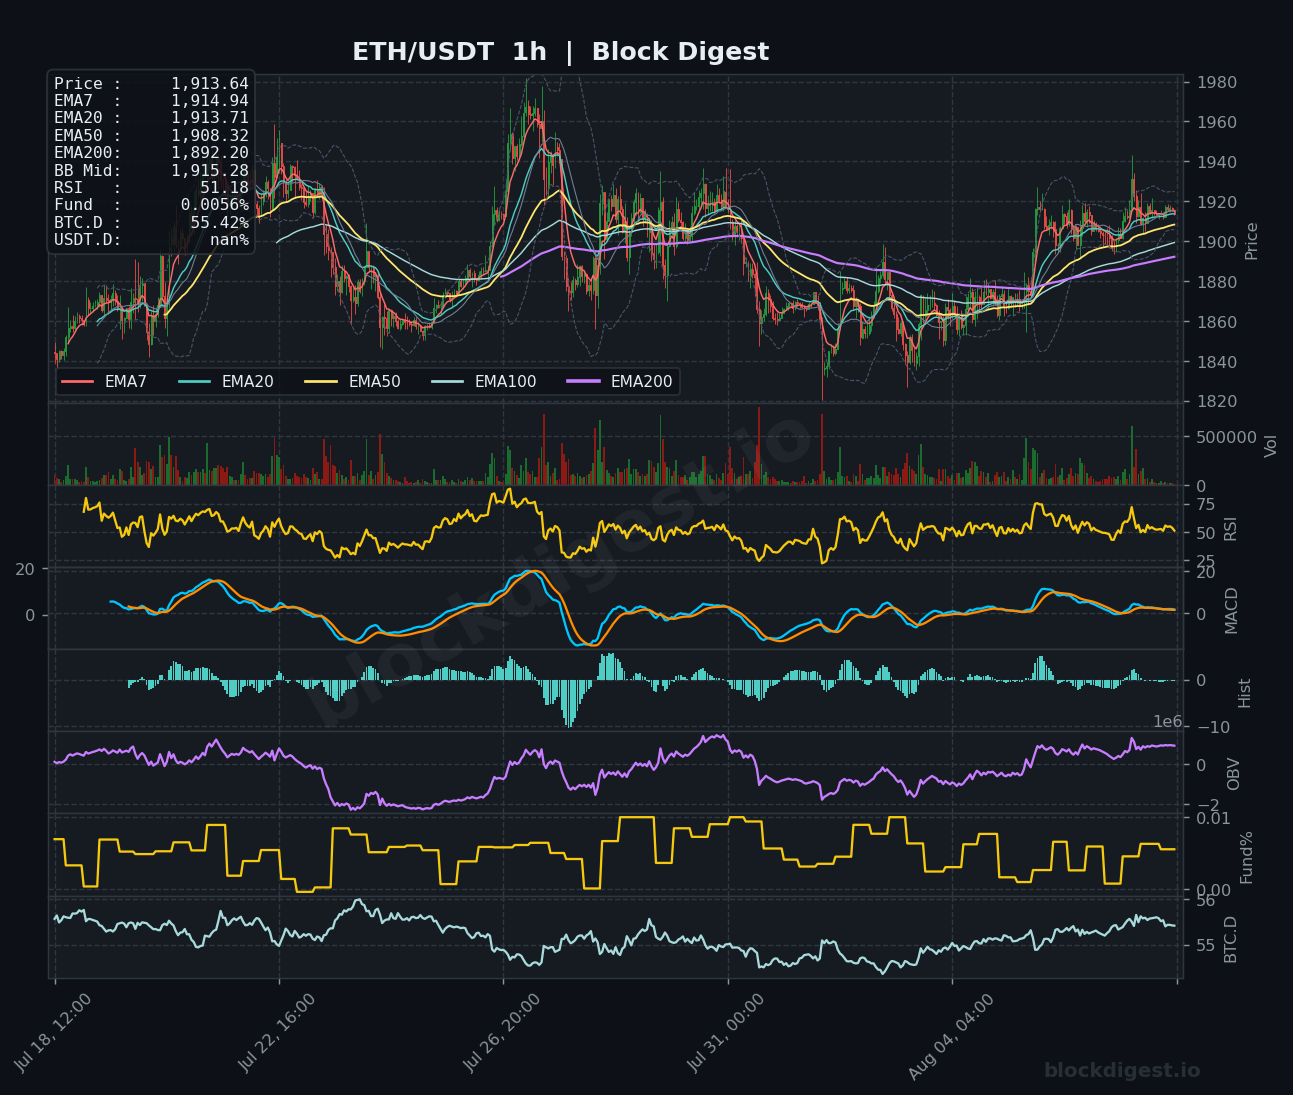
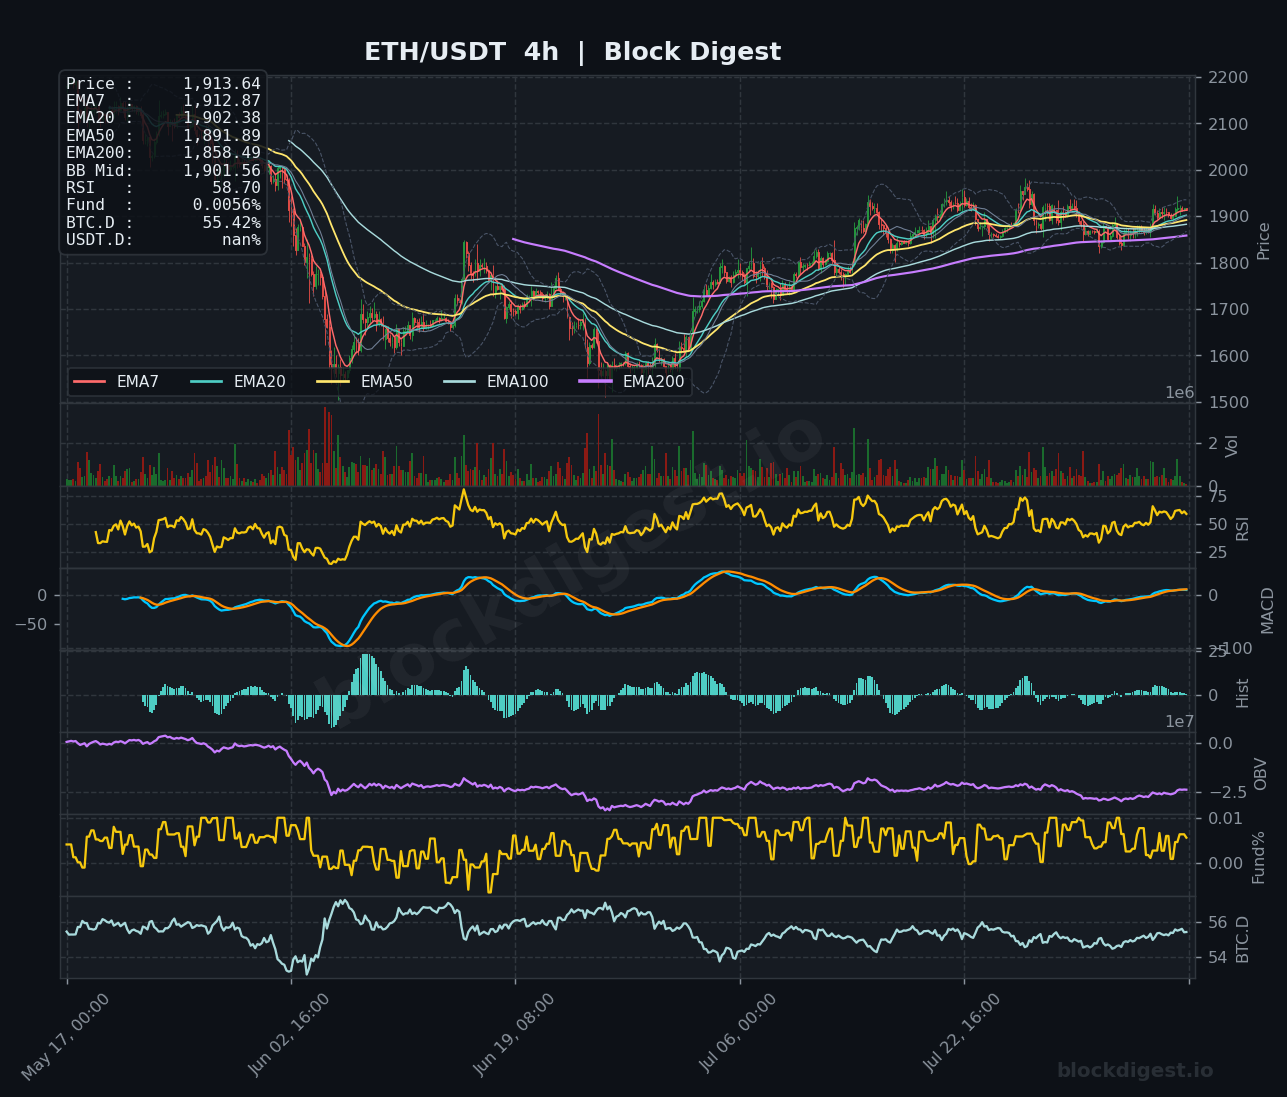
Across all three timeframes, ETH is navigating a tightly clustered EMA stack, with the 1h showing price sandwiched between EMA7 ($1,914.94), EMA20 ($1,913.71), and EMA50 ($1,908.32) — a sign of compression that typically precedes a directional resolution. The 4h view reinforces the recovery thesis: price has climbed back above all key short-term EMAs, with EMA50 at $1,891.89 and EMA200 at $1,858.49 now acting as layered support on pullbacks. There is notable confluence of support between $1,890–$1,902 across the 4h EMA cluster and the daily BB midline, making that zone a critical near-term pivot. The short-term momentum on the 1h and 4h broadly supports the higher timeframe recovery attempt, though the daily EMA200 divergence serves as a reminder that the macro structure is not yet repaired.
Key Levels to Watch
Resistance:
- $1,940–$1,950 — Recent swing high from the 1h chart; area where selling pressure emerged during the most recent push higher
- $1,980–$1,990 — Upper Bollinger Band boundary on the 1h timeframe; previous intraday highs and a logical target for bulls
- $2,141.97 — Daily EMA200; the defining macro resistance that has capped ETH’s recovery attempts and would need a sustained close above to confirm a structural trend reversal
Support:
- $1,900–$1,902 — 4h EMA20 and daily BB midline confluence; the most immediate demand zone and short-term trend pivot
- $1,858–$1,891 — 4h EMA50 through EMA7 cluster; broader support band that held during recent consolidation
- $1,820–$1,840 — Prior consolidation range lows visible on the 1h chart; loss of this level would suggest a retest of mid-summer lows
Momentum & On-Chain Signals
The RSI picture across timeframes tells a moderately constructive story: the 4h RSI sits at 58.70, the daily at 56.30, and the 1h at 51.18 — all holding above the 50 midline without being overextended into overbought territory, leaving room for further upside. Block Digest’s proprietary BD Pulse Score of 43/100, however, registers a bearish reading, cautioning that underlying momentum has not yet shifted decisively — a meaningful divergence from what price action alone might suggest. The daily MACD is showing a gradual bullish curl with the histogram building positive bars, consistent with a slow accumulation phase, while the 4h MACD lines remain tightly compressed near zero after a prolonged bearish cycle. The OBV trend on the 1h has been climbing steadily in recent sessions (BD Pulse OBV Trend: +1), pointing to quiet but persistent accumulation rather than a volume-backed breakout.
BTC Dominance & Market Sentiment
BTC dominance sits at 55.42%, reflecting continued capital concentration in Bitcoin — a headwind for ETH and altcoins seeking independent breakouts. The macro context supports this reading: Bitcoin’s positive response to the softer-than-expected July jobs report (economy lost 23,000 jobs, unemployment at 4.1%) and growing expectations for a Fed pause in September have lifted risk assets broadly, but the majority of capital inflows appear to be gravitating toward BTC rather than rotating into ETH. Until dominance shows a clear rollover below the 54–55% zone, ETH is likely to remain a relative underperformer against Bitcoin in the near term, even if it continues recovering in USD terms.
Risk Scenarios
Bullish case: A sustained hold above $1,900 accompanied by a 4h candle close above $1,940 would signal buyers absorbing overhead supply, opening a measured move toward $1,980–$1,990 and ultimately a test of the $2,050–$2,100 region. A Fed pause confirmation at the September 16 meeting — now priced at roughly 56% probability — could serve as the macro catalyst to drive that leg.
Bearish case: A failure to hold the $1,890–$1,902 confluence zone on the 4h, particularly on elevated selling volume, would expose ETH to a retest of $1,840–$1,858 support; a decisive breakdown below $1,820 would invalidate the near-term recovery structure and shift the bias back toward the $1,700–$1,750 range.
Outlook
ETH’s near-term setup is cautiously constructive — price has reclaimed key short-term EMAs and is holding above the daily BB midline, supported by a macro tailwind from softer labor data and Fed pause speculation. However, Block Digest’s BD Pulse Score of 43/100 serves as a useful counterweight to unrestrained optimism, flagging that the underlying on-chain and momentum conditions have not yet confirmed a high-conviction trend reversal. The critical trigger to watch in the next 24–48 hours is whether ETH can convert the $1,900–$1,902 zone from resistance-turned-support into a genuine launch pad, or whether the market stalls and rolls over in the face of the imposing daily EMA200 at $2,141.97. A clean hold above $1,900 with improving volume would keep the recovery thesis intact; a close back below $1,880 on the daily chart would warrant a reassessment.
—
Disclaimer: This analysis is for informational purposes only and does not constitute financial advice. Cryptocurrency markets are highly volatile and unpredictable. All trading decisions should be made based on your own research and risk tolerance. Block Digest is not responsible for any financial losses incurred as a result of acting on this content.
Stay Ahead of the Market
Follow BlockDigest for crypto market intelligence, research and real-time updates.


