
Market Overview
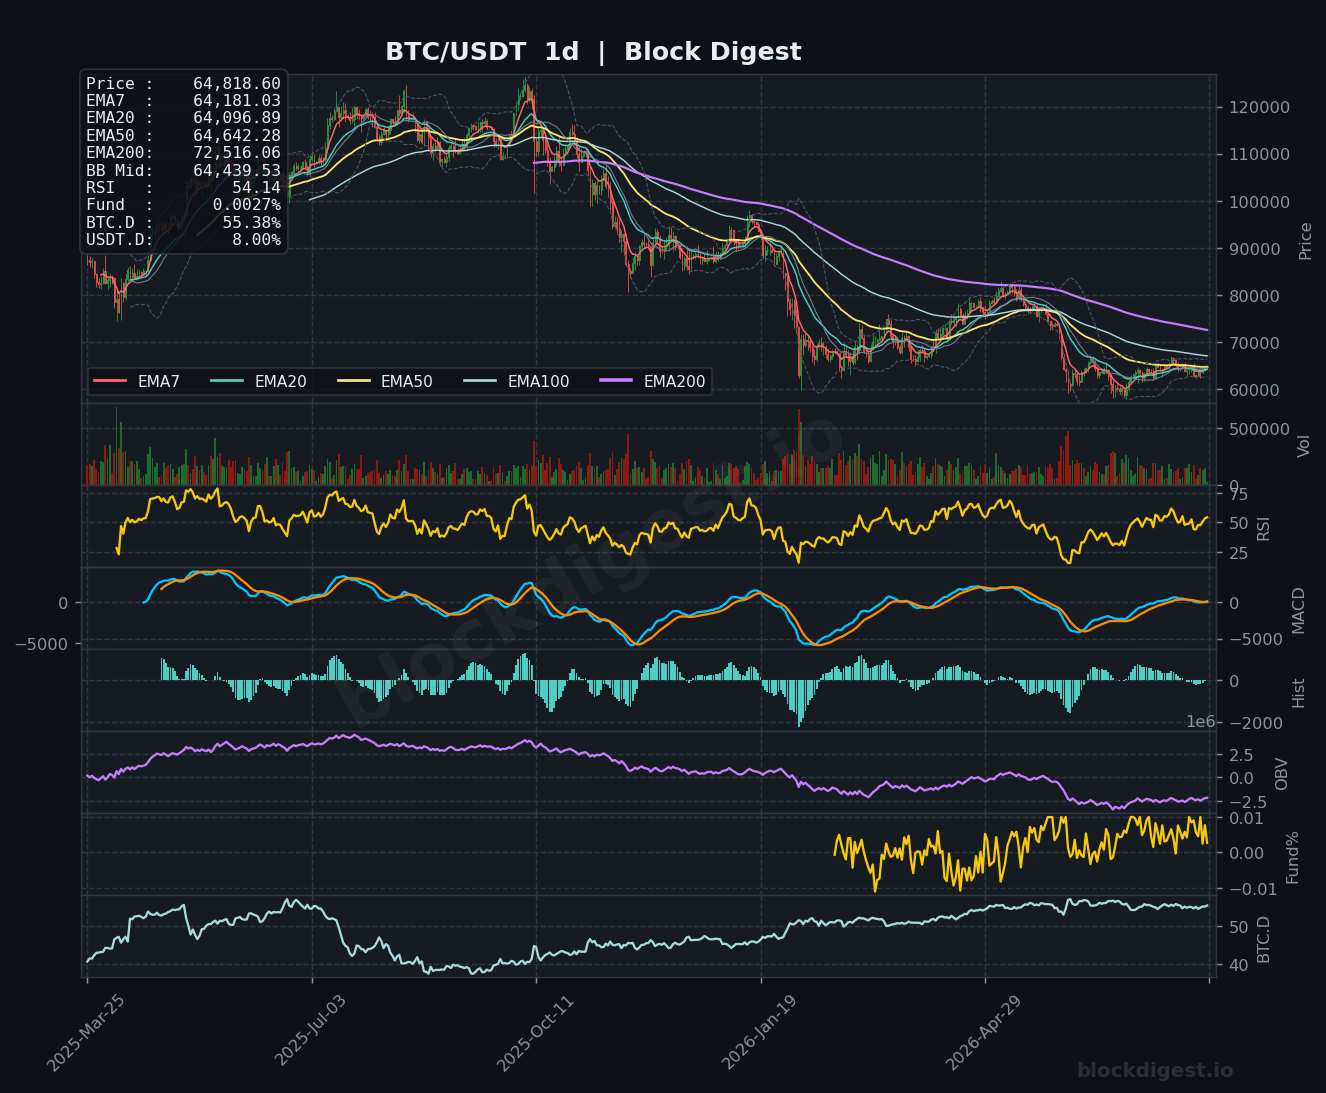
Bitcoin is trading at $64,818 as of August 6, 2026, consolidating in a tight range after bouncing from recent lows near $62,800–$63,000. On the daily timeframe, price is navigating a critical cluster of EMAs, with the EMA7 ($64,181), EMA20 ($64,097), and EMA50 ($64,642) all compressed within a narrow $500 band — a configuration that typically precedes a directional resolution. The daily Bollinger Band midline sits at $64,439, and current price is pressing above it, suggesting a tentative short-term bullish lean. However, the daily EMA200 at $72,516 looms as a formidable macro resistance, underscoring that the longer-term structure remains in recovery mode following the significant downtrend that dominated the first half of 2026.
Multi-Timeframe Confluence
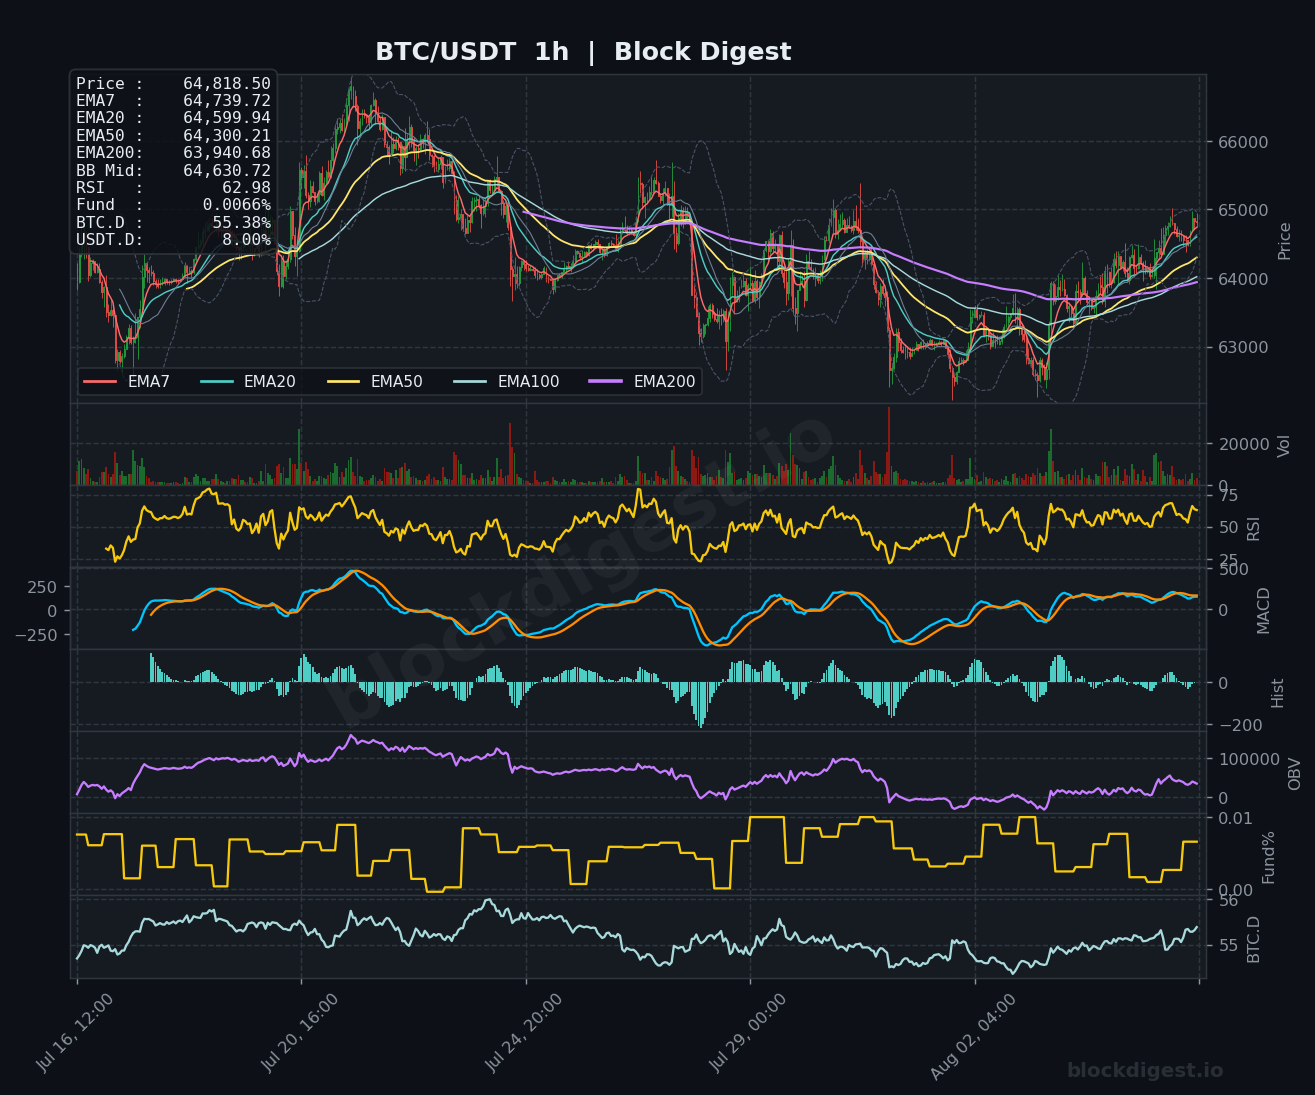
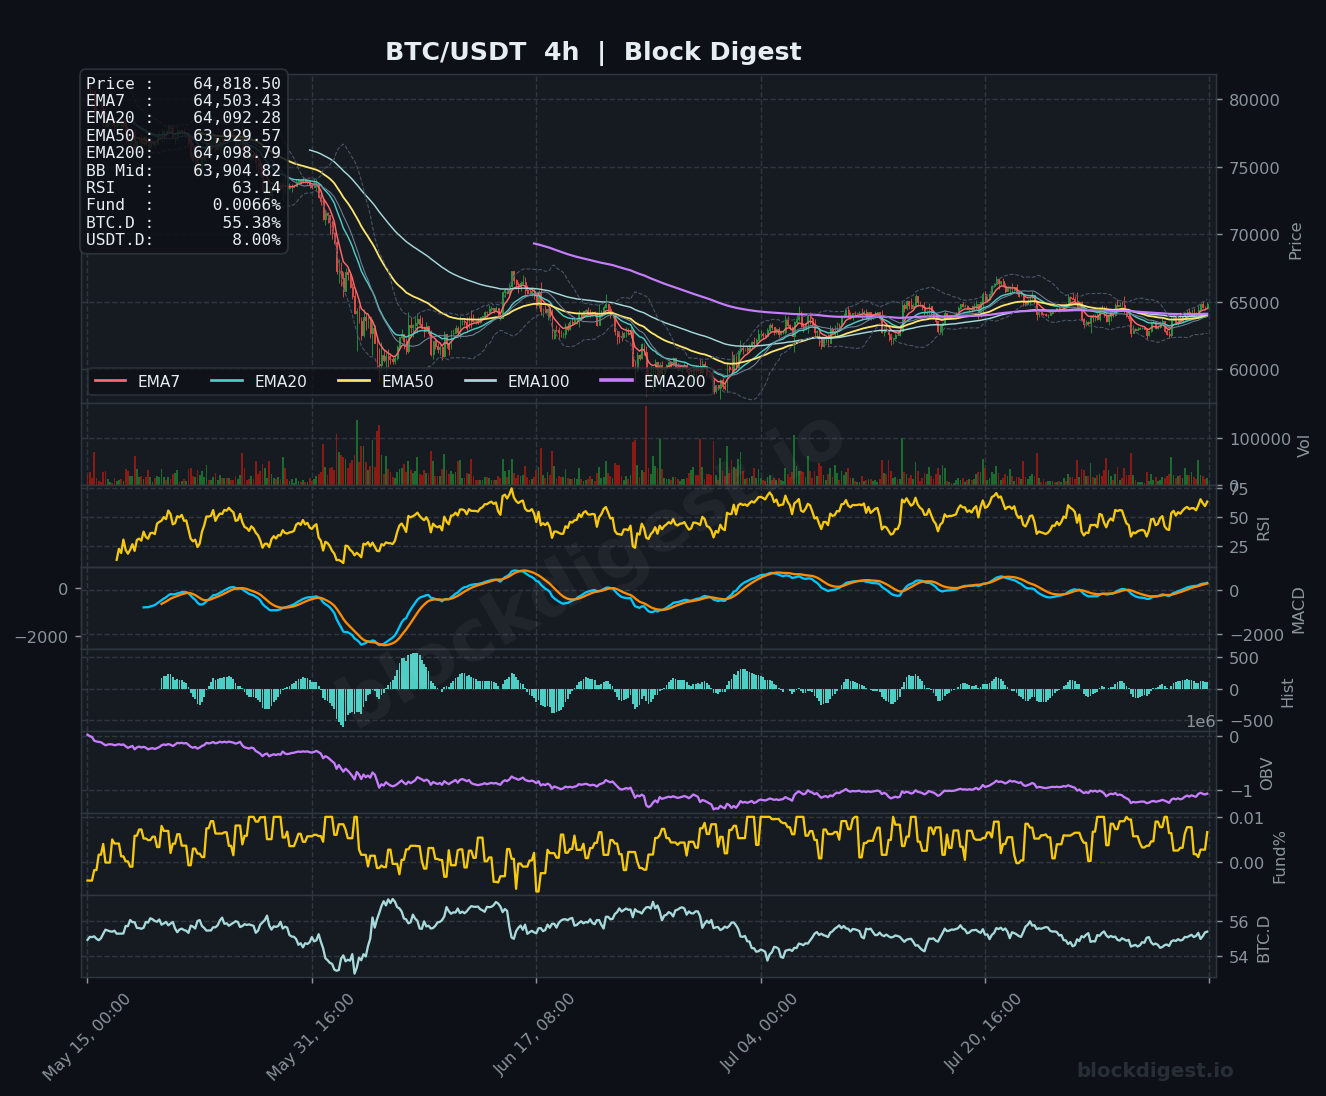
On the 1-hour chart, price has reclaimed all short-term EMAs (EMA7 at $64,739, EMA20 at $64,600, EMA50 at $64,300) with a bullish stack forming, and the 1h RSI sits at a healthy 62.98 — showing momentum without being overextended. The 4-hour chart confirms the constructive near-term picture, with price above its EMA7 ($64,503), EMA20 ($64,092), and EMA50 ($63,930), though the EMA200 on the 4h at $64,099 has been reclaimed and now serves as support. Critically, all three timeframes align around the $63,900–$64,100 zone as a confluence support area, making that band particularly significant for bulls to defend. The one divergence worth noting is that the daily timeframe’s broader structure still reflects a market in recovery rather than a confirmed uptrend, tempering excessive optimism from the short-term setups.
Key Levels to Watch
- Resistance: $65,200–$65,500 — this zone capped the most recent 1h recovery rally and aligns with the upper portion of the recent consolidation range; $66,000 — psychological round number and a prior swing high visible on the 1h chart that price failed to sustain; $72,516 — the daily EMA200, the dominant macro resistance that defines the ceiling of the current bear recovery phase.
- Support: $63,900–$64,100 — confluence of the 4h EMA50, 4h EMA200, and daily BB midline, making this the primary near-term support shelf; $63,000 — the recent swing low and lower Bollinger Band boundary on the 1h chart, a critical structural level; $61,500–$62,000 — broader demand zone visible on the daily chart, representing the last meaningful defense before deeper drawdown risk increases.
Momentum & On-Chain Signals
Block Digest’s proprietary BD Pulse Score sits at 48/100 — firmly neutral — which is consistent with the indecisive EMA compression visible across timeframes. The 1h MACD is in a modest bullish crossover with the histogram printing positive ticks, and the 4h MACD, after an extended bearish period, has crawled back toward the zero line, suggesting the selling pressure from the prior correction is waning. The daily RSI at 54.14 (close to our BD Pulse RSI reading of 53.99) reflects mid-range momentum with room to move in either direction before reaching extremes. OBV on both the 1h and 4h frames has leveled off rather than declining, consistent with our BD Pulse OBV Trend reading of +1, indicating quiet accumulation rather than active distribution.
BTC Dominance & Market Sentiment
BTC dominance holds at 55.37% — a reading that reflects continued rotation preference toward Bitcoin over altcoins, a trend that has been building through 2026 as macro uncertainty keeps risk appetite measured. USDT dominance at 8.00% remains elevated relative to historical bull market levels, signaling that a meaningful portion of capital remains on the sidelines rather than deployed into risk assets. Together, these readings suggest the broader crypto market is not in an aggressive risk-on phase, which somewhat limits the ceiling for a near-term BTC breakout but also means dry powder exists if sentiment shifts.
Risk Scenarios
- Bullish case: A clean 4h close above $65,500 with sustained volume would confirm a breakout from the current consolidation range, opening a path toward the $66,000–$67,500 region in the near term. Sustained funding rates remaining low and positive — as the current +0.0034% reading suggests — would support a healthier, less leverage-driven continuation rally.
- Bearish case: A loss of the $63,900–$64,100 confluence support on a 4h closing basis would shift the immediate structure bearish, targeting a retest of $63,000 and potentially $61,500 if selling accelerates. Given the BD Extreme Index reading of +0.95σ — still within normal range — a breakdown here would not require an extreme sentiment catalyst, making it a plausible risk.
Outlook
The near-term setup for BTC is cautiously constructive but not yet conclusive. Price is holding above key short- and medium-term EMAs, momentum indicators are recovering without being overheated, and the funding environment remains balanced — all ingredients for a measured continuation higher if buyers can sustain pressure above $64,800. The critical trigger to watch in the next 24–48 hours is whether price can convincingly clear and hold $65,500; a failure at that level followed by a slide under $64,100 would flip the short-term bias back to neutral-to-bearish. The macro backdrop — including Bitcoin’s $1.296 trillion market cap and mixed sentiment around AI-driven finance narratives — adds a layer of external unpredictability. Overall, this reads as a market in a tightly coiled consolidation, awaiting a catalyst to define the next directional leg.
—
Disclaimer: This analysis is for informational purposes only and does not constitute financial advice. Cryptocurrency markets are highly volatile and unpredictable. All trading decisions should be made based on your own research and risk tolerance. Block Digest is not responsible for any financial losses incurred as a result of acting on this content.
Stay Ahead of the Market
Follow BlockDigest for crypto market intelligence, research and real-time updates.


