
Market Overview
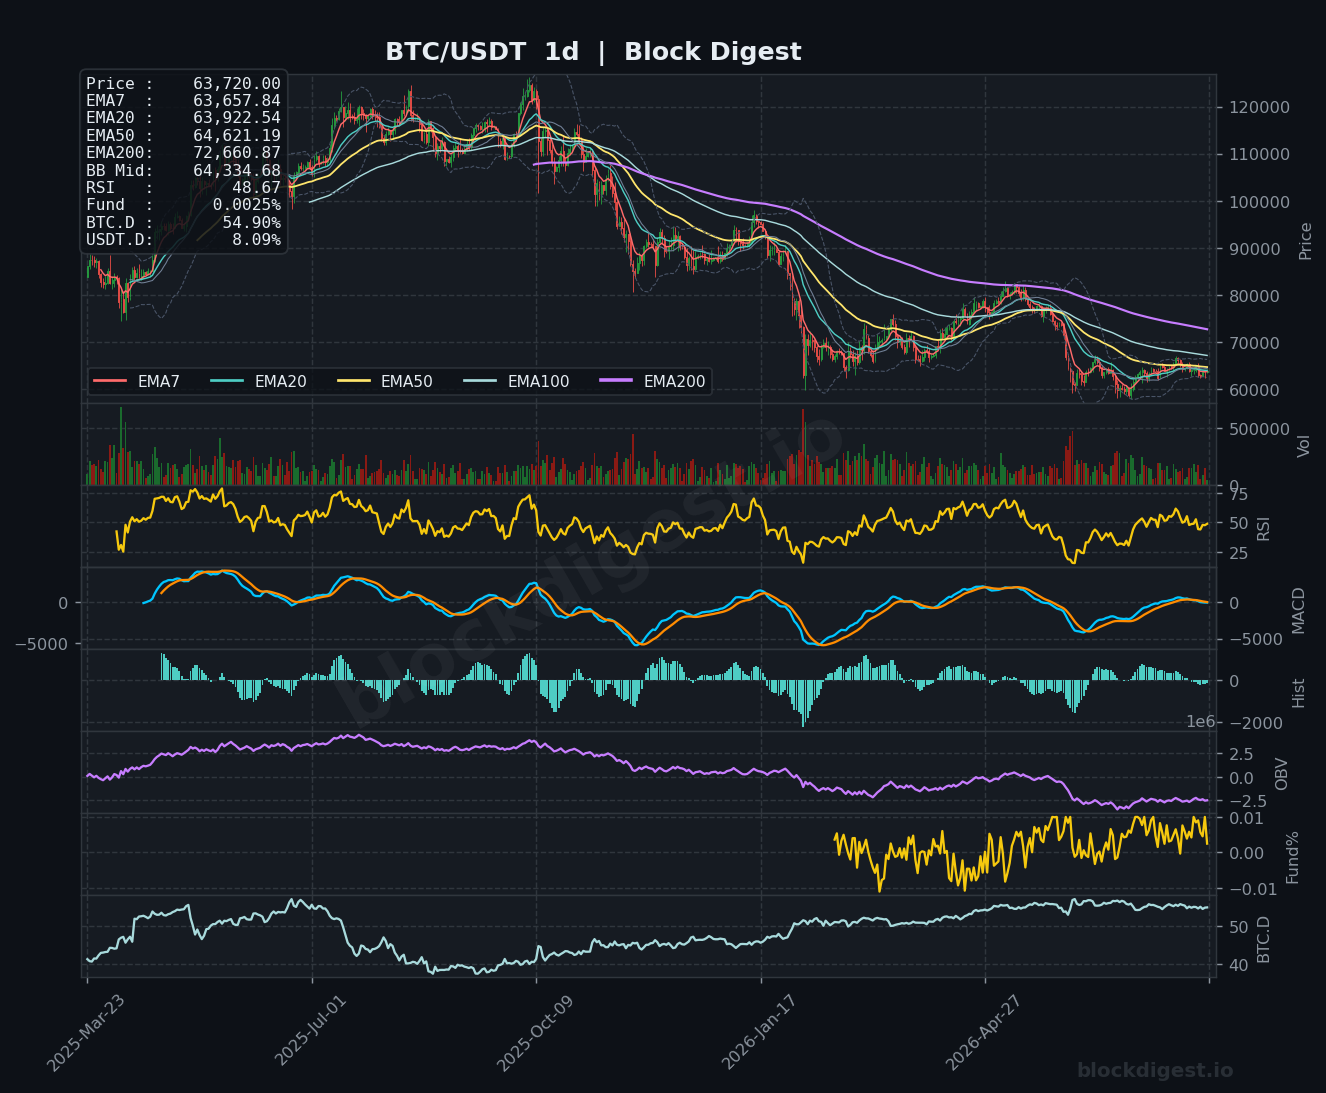
Bitcoin is trading at $63,720 against a backdrop of compressed, indecisive price action, with the daily chart revealing a sustained bearish structure following the significant breakdown from highs above $100,000 earlier this cycle. Price is currently sandwiched beneath the daily EMA50 ($64,621) and EMA20 ($63,922), both of which are sloping downward and acting as dynamic resistance. The daily Bollinger Band midline sits at $64,334, further reinforcing the overhead supply zone between $63,900 and $64,600. Most critically, the daily EMA200 at $72,660 remains a distant ceiling, underscoring how far BTC has fallen from its structural peak and how much work bulls would need to do to reclaim a genuinely constructive posture.
Multi-Timeframe Confluence
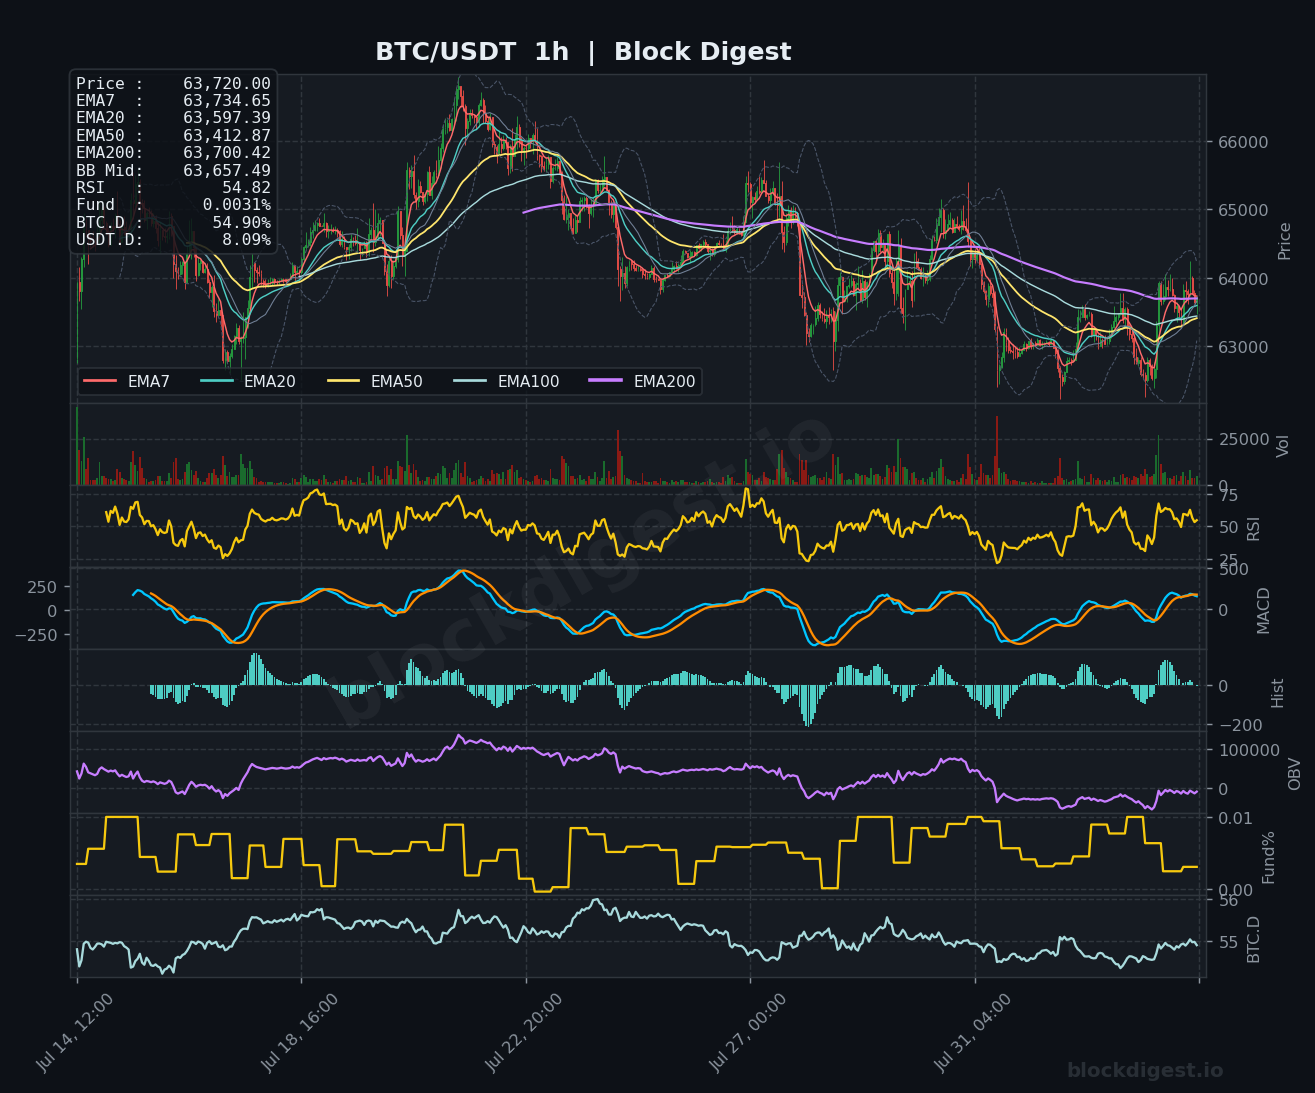
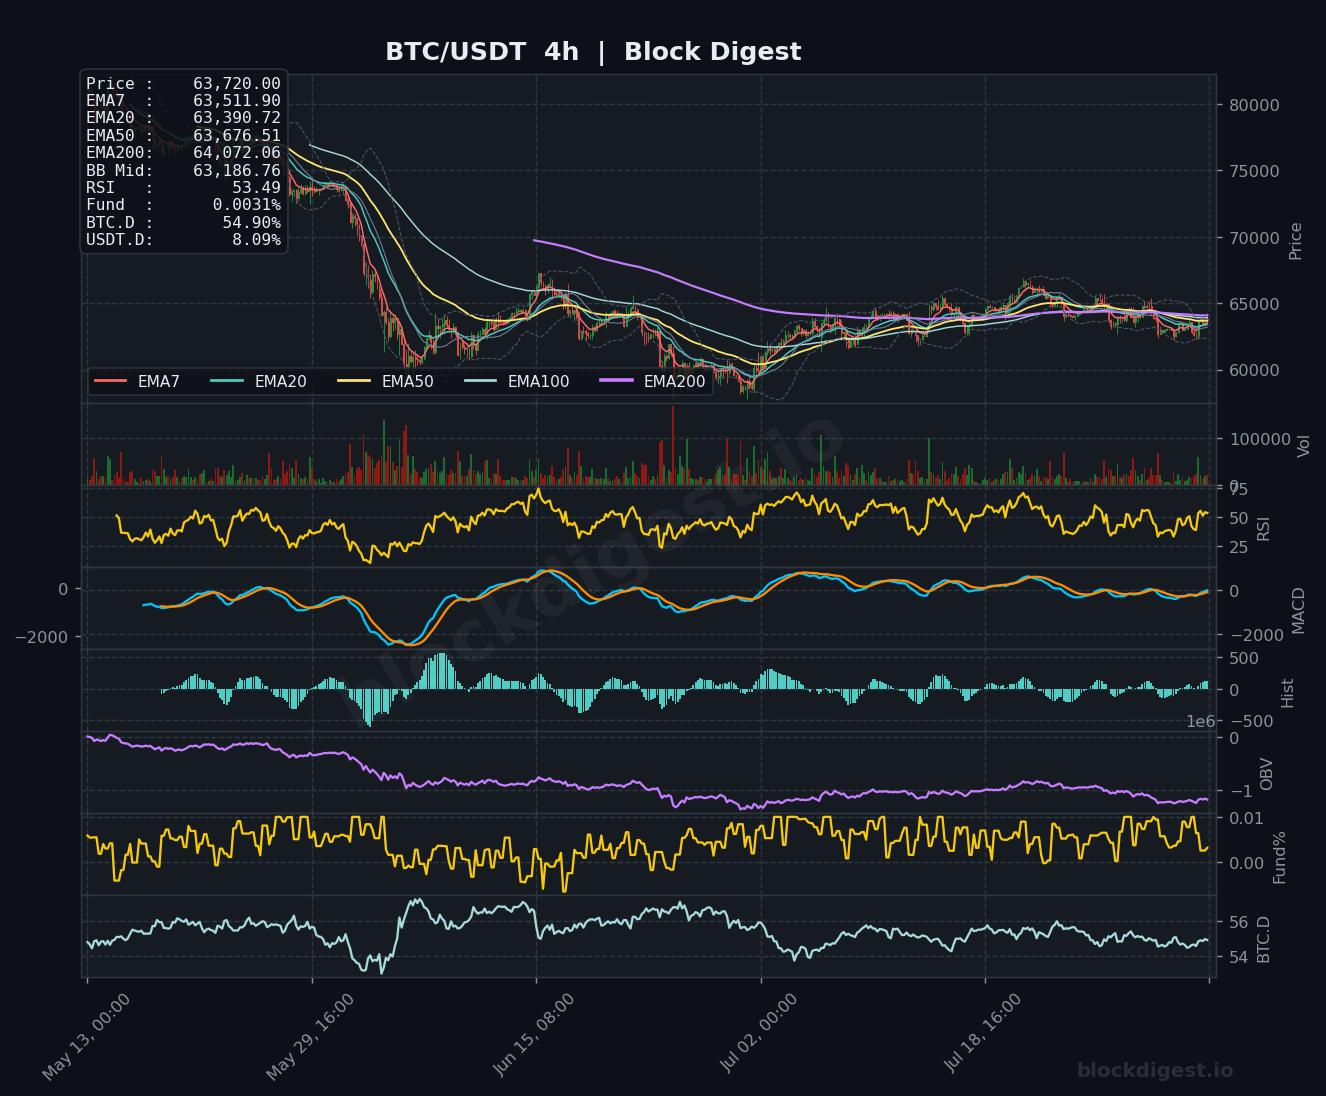
Across all three timeframes, the EMA stack tells a consistent bearish story: price is trading below or barely at the shorter-term moving averages, with no clean bullish alignment in sight. On the 1-hour chart, price at $63,720 is hovering just below the EMA200 ($63,700) and EMA7 ($63,734), suggesting the market is in a tight consolidation but has not broken out with conviction. The 4-hour chart shows a notable resistance cluster where the EMA50 ($63,676) and EMA200 ($64,072) compress price from above, with the Bollinger Band midline at $63,186 offering a near-term floor reference. Short-term momentum on the 1h is mildly constructive with RSI at 54.82, but this conflicts with the broader daily downtrend, making any bounce suspect without a decisive close above $64,600.
Key Levels to Watch
- Resistance: $64,072 — the 4h EMA200, a key dynamic level that has repeatedly capped recovery attempts and aligns closely with the upper bound of the current consolidation range
- Resistance: $64,621 — the daily EMA50, a macro resistance level where the prevailing downtrend is likely to attract fresh selling pressure
- Resistance: $65,000–$65,200 — a prior structural breakdown zone visible on the 4h chart that has transitioned into resistance, coinciding with where the upper Bollinger Band compression begins
- Support: $63,186 — the 4h Bollinger Band midline, serving as a short-term equilibrium; a loss of this level would expose lower demand zones
- Support: $62,800–$63,000 — a visible demand cluster on the 1h chart where buyers stepped in during the most recent leg down, representing the near-term line in the sand
- Support: $60,000–$60,500 — a broader psychological and structural support zone from the daily chart; a break here would materially shift the medium-term outlook
Momentum & On-Chain Signals
Our proprietary BD Pulse Score sits at 32/100 — firmly in bearish territory — which aligns with the daily RSI reading of 48.67, itself hovering just below the neutral 50 threshold and reflecting a market that has yet to generate meaningful buying pressure after its prolonged decline. The 4h MACD shows both lines hugging the zero axis with minimal separation, indicating a lack of directional momentum rather than a clean trend, while the histogram has flattened after brief bullish bars — a tentative sign of stabilization that has not yet confirmed a reversal. On the OBV front, the 4h and daily both show a persistent downward trajectory, consistent with ongoing distribution, and the BD Pulse OBV trend reading of +1 suggests only a marginal tilt toward accumulation at current levels — insufficient to call a bottom. The funding rate at +0.0031% to +0.0040% is positive but negligible, indicating the market is not overextended to the long side despite the Long/Short ratio sitting at 1.46, meaning longs modestly dominate positioning without the froth that typically precedes sharp corrections.
BTC Dominance & Market Sentiment
BTC dominance is holding at 54.90%, a level that has been relatively stable in recent sessions and suggests capital is not rotating aggressively into altcoins — a mild positive for BTC as a relative store of value within crypto. However, with USDT dominance elevated at 8.09%, a meaningful portion of market participants remain parked in stablecoins, reflecting broader risk aversion rather than active deployment into either BTC or altcoins. This combination points to a market in a holding pattern, waiting for a macro catalyst or clearer directional signal before committing.
Risk Scenarios
- Bullish case: A decisive 4h close above $64,072 (4h EMA200) followed by reclaiming $64,621 (daily EMA50) would signal a genuine shift in short-term structure, opening a path toward the $66,500–$67,400 range that analysts have identified as the August base-case target.
- Bearish case: Failure to hold the $63,000 support zone on a daily closing basis would expose the $60,000–$60,500 structural floor; a breach there with sustained ETF outflows and deteriorating macro sentiment could accelerate a move toward the $58,000 region.
Outlook
Bitcoin’s setup as of August 4, 2026 is best described as cautiously bearish with a fragile stabilization attempt underway. The weight of evidence — a BD Pulse Score of 32, price below key daily EMAs, persistent OBV distribution on higher timeframes, and ETF outflows — favors the bears unless bulls can engineer a definitive reclaim of the $64,072–$64,621 resistance corridor in the next 24–48 hours. The most critical trigger to watch is whether price can sustain above the $63,700–$63,900 area on an hourly closing basis, as repeated failure there would confirm the zone has flipped to resistance. Until the daily EMA50 is reclaimed and held, any intraday bounces should be treated as relief rallies within a broader downtrend rather than trend reversals.
—
Disclaimer: This analysis is for informational purposes only and does not constitute financial advice. Cryptocurrency markets are highly volatile and unpredictable. All trading decisions should be made based on your own research and risk tolerance. Block Digest is not responsible for any financial losses incurred as a result of acting on this content.
Stay Ahead of the Market
Follow BlockDigest for crypto market intelligence, research and real-time updates.


