
ETH Daily Analysis — 2026-07-26 (Full Archive)
Market Overview
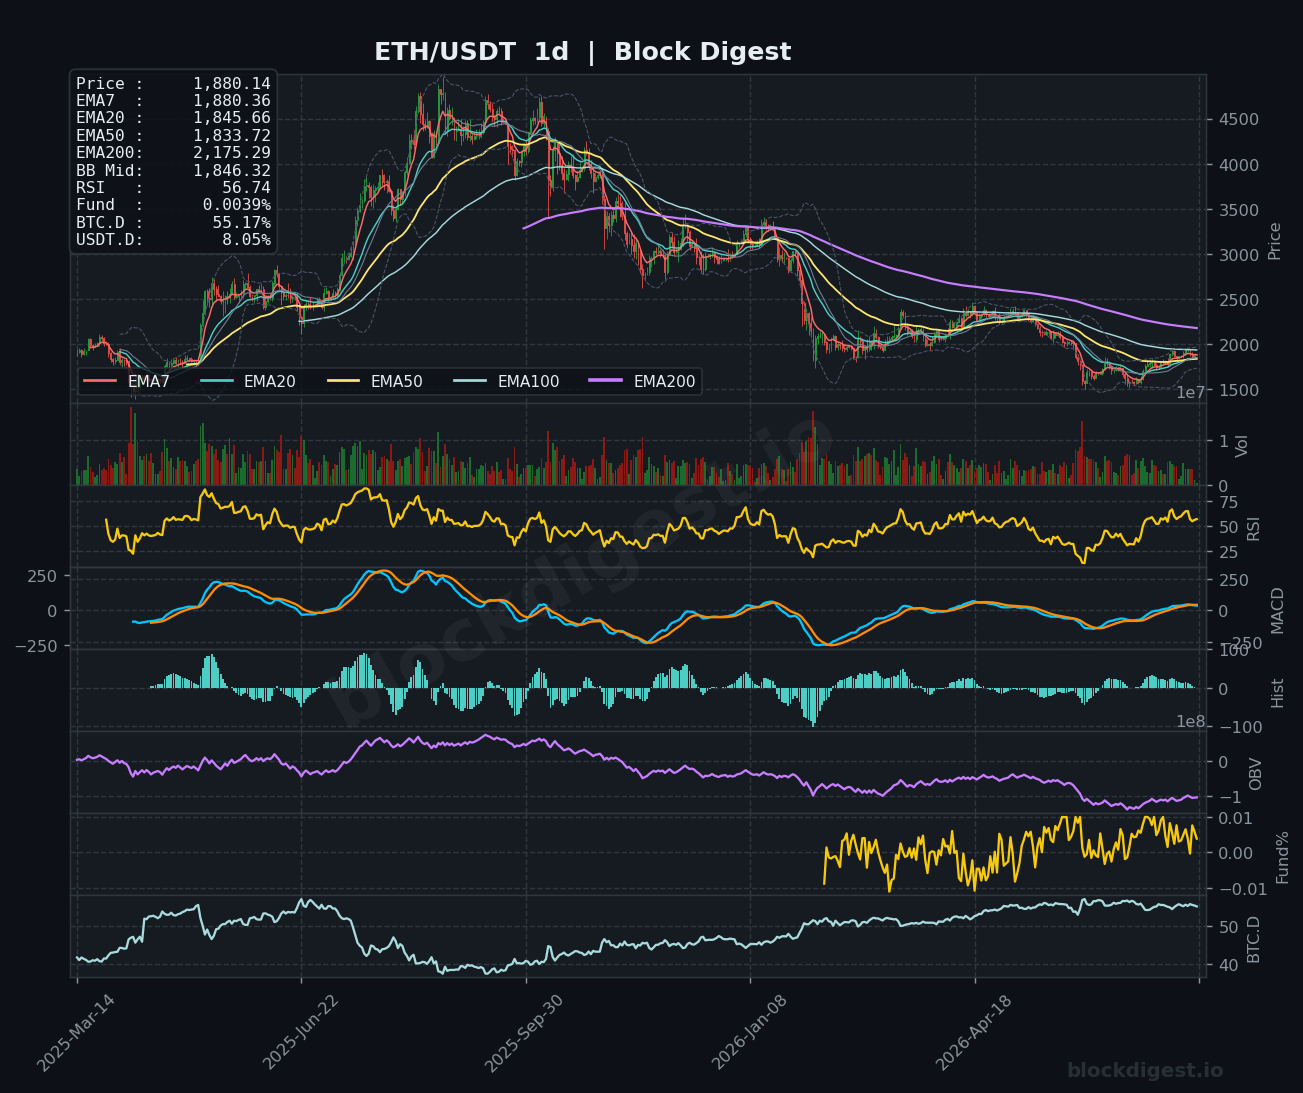
Ethereum is trading at $1,880.14, down approximately 2.87% on the day, sitting in a contested zone as bulls and bears wrestle for control near the cluster of short-term moving averages. On the daily timeframe, price remains well beneath the EMA200 ($2,175.29), confirming that the macro trend is still bearish despite the recovery attempt off multi-month lows near $1,550. The daily Bollinger Band midline sits at $1,846.32, and ETH has recently reclaimed that level, which is an encouraging short-term development. However, the EMA50 ($1,833.72) and EMA20 ($1,845.66) on the daily chart are bunched together just below current price, meaning any meaningful pullback could quickly erode this fragile progress.
Multi-Timeframe Confluence
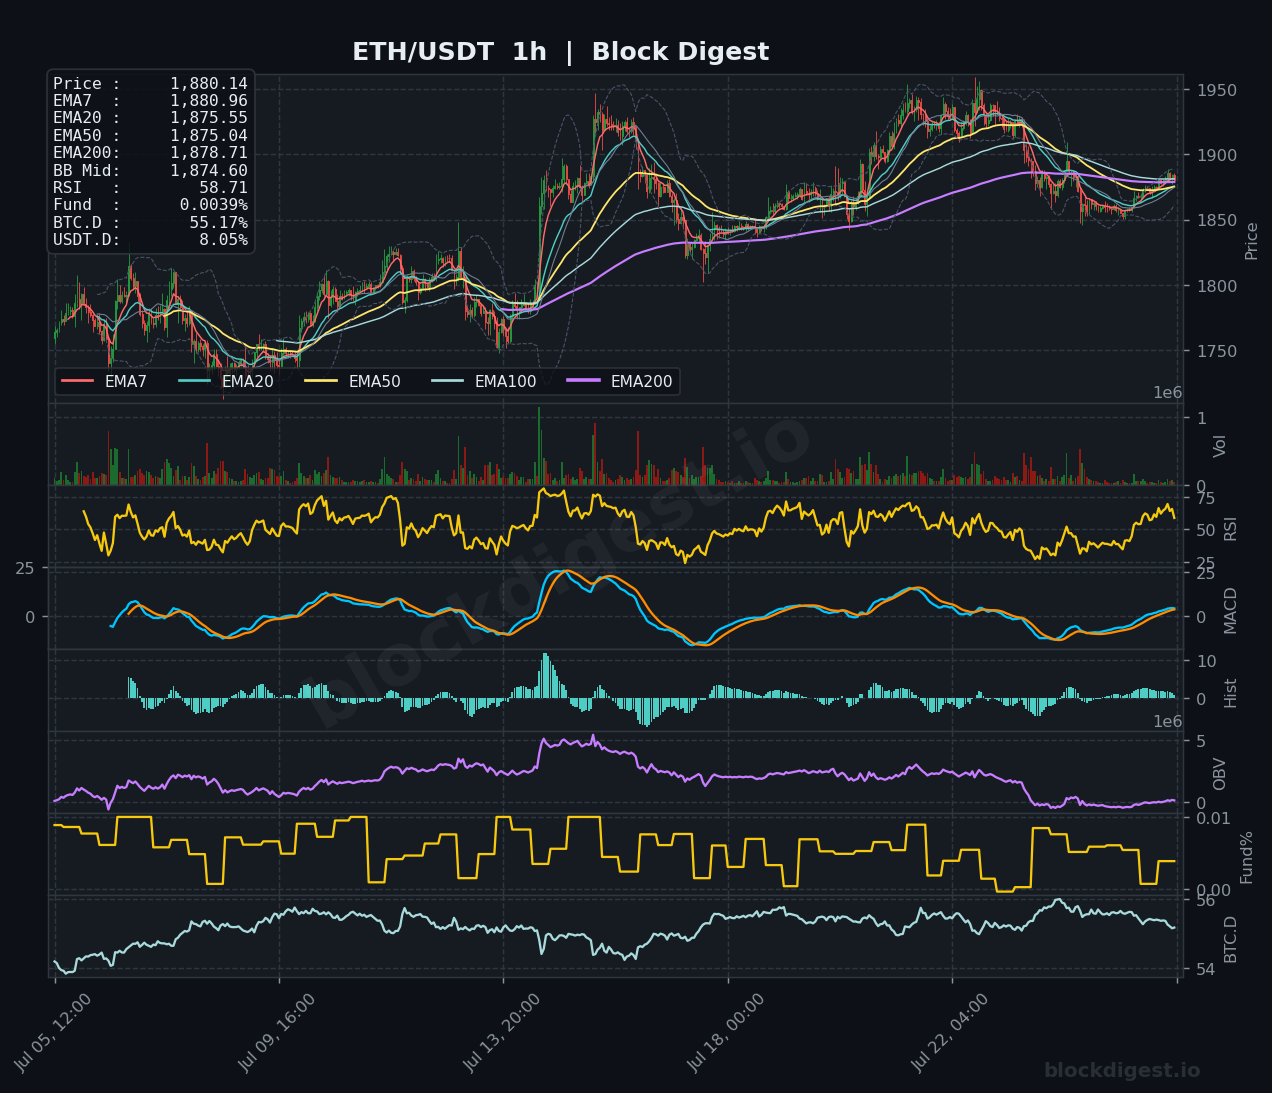
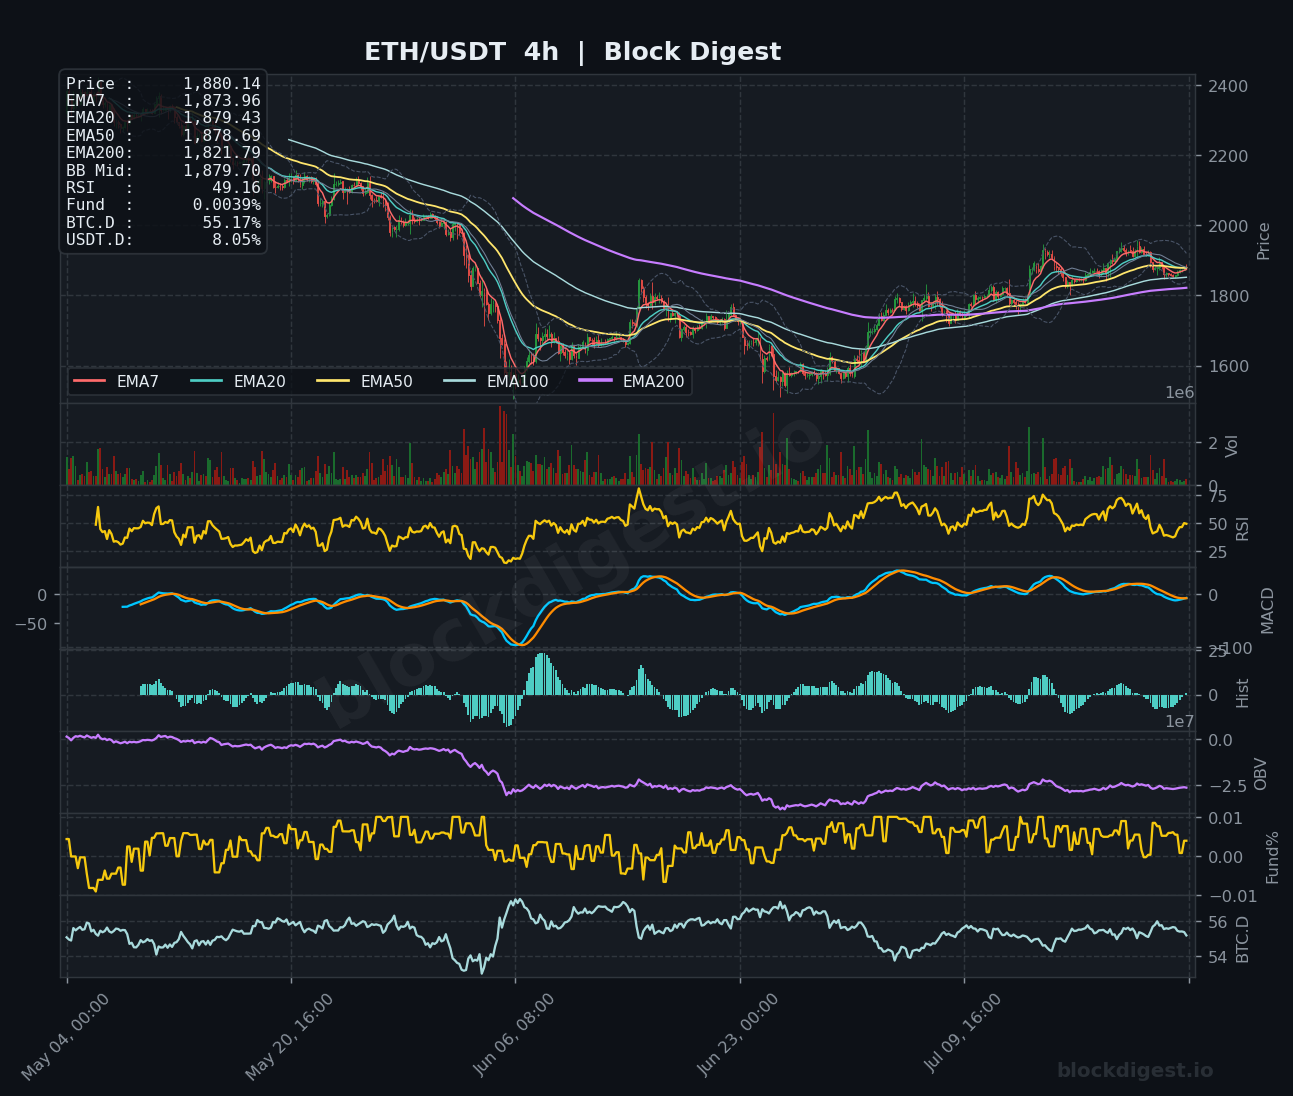
On the 1-hour chart, price at $1,880.14 is threading through a tight EMA cluster — EMA7 ($1,880.96), EMA20 ($1,875.55), EMA50 ($1,875.04), and EMA200 ($1,878.71) — all compressed within roughly a $6 range, a classic indecision pattern that typically precedes a directional move. The 4-hour chart tells a similar story: price is hugging the BB midline at $1,879.70, with short-term EMAs (EMA7 at $1,873.96, EMA20 at $1,879.43, EMA50 at $1,878.69) converging tightly, while the 4H EMA200 at $1,821.79 provides broader structural support below. Across all three timeframes, ETH is essentially range-bound between $1,850 and $1,950, with no clear breakout signal yet. The daily and 4-hour timeframes both suggest a tentative recovery structure, but the 1-hour momentum is fading after a recent push toward the $1,950 area, indicating short-term sellers are regaining some footing.
Key Levels to Watch
- Resistance: $1,920–$1,930 — recent swing high on the 1H chart where selling pressure emerged and price reversed; $1,950 — the upper boundary of the current consolidation range and a visible ceiling from prior 4H candles; $2,000 — a major psychological round number that also aligns with prior 4H supply and the declining EMA100 on the daily chart.
- Support: $1,875–$1,878 — the immediate confluence zone of four 1H EMAs and the 4H BB midline; $1,846–$1,850 — the daily BB midline and EMA20, a critical level that needs to hold on any pullback to maintain the short-term bullish structure; $1,821 — the 4H EMA200, which proved meaningful during the recent recovery and would represent a significant breakdown if lost.
Momentum & On-Chain Signals
The RSI picture is nuanced across timeframes: the 1-hour RSI is at 58.71, reflecting mild bullish momentum but well short of overbought, while the 4-hour RSI sits at 49.16 — essentially neutral and at risk of dipping below 50, which would signal a shift toward bearish pressure on that timeframe. The daily RSI at 56.74 is the most constructive reading, suggesting the broader recovery still has room to run before exhaustion. Block Digest’s BD Pulse Score of 47/100 aligns closely with this neutral-to-cautious posture — the market isn’t showing strong conviction in either direction. The 4H MACD is hovering just above the zero line with both lines nearly crossed, and the histogram has been compressing, consistent with the tight price consolidation. On the OBV front, the 1H OBV has been declining recently even as price held elevated levels, a mild bearish divergence worth monitoring, though our BD Pulse OBV Trend reading of +1 on a broader basis suggests the selling pressure hasn’t been overwhelming.
BTC Dominance & Market Sentiment
BTC dominance is holding at 55.16%–55.17% across timeframes, a level that has been trending higher over the longer-term daily chart, which generally continues to work against altcoins like ETH that need capital rotation to outperform. USDT.D at 8.05% remains elevated, indicating that a notable portion of capital is still sitting on the sidelines in stablecoins rather than deploying aggressively into risk assets. For ETH specifically, this combination — rising BTC dominance and elevated stablecoin dominance — suggests the path to a sustained breakout above $2,000 will require either a catalyst that sparks broad altcoin interest or a clear BTC-led rally that lifts the entire market.
Risk Scenarios
- Bullish case: A clean hourly close above $1,930 on rising volume, with the 4H RSI pushing back above 55, would open the door toward a retest of $1,950 and potentially $2,000. Continued positive ETH ETF inflows and any de-escalation in geopolitical tensions (U.S.-Iran) could serve as the macro catalyst needed to fuel that move.
- Bearish case: A breakdown below the $1,846–$1,850 daily BB midline / EMA20 zone, particularly on elevated selling volume, would invalidate the short-term recovery thesis and expose the $1,821 4H EMA200 and ultimately the $1,780–$1,800 range. A resumption of BTC dominance expansion above 56% would amplify ETH’s downside risk in this scenario.
Outlook
ETH is at a technically pivotal juncture, trading in a tight consolidation zone bounded by approximately $1,850 on the downside and $1,950 on the upside, with the market awaiting a directional trigger. The daily structure is cautiously constructive — price above the EMA20 and EMA50 with RSI at 56.74 — but the macro bearish trend (price far below the daily EMA200 at $2,175) means bulls carry the burden of proof. The key trigger to watch in the next 24–48 hours is whether ETH can hold the $1,875–$1,878 EMA confluence on any dip; a clean bounce from there would reinforce the near-term bullish structure, while a slip below $1,850 would likely invite a swift move toward the $1,820s. With the BD Pulse at a neutral 47/100 and funding rates a modest +0.0033%, the market is not positioned for an explosive move in either direction, making patience and level-by-level confirmation the prudent approach.
—
Disclaimer: This analysis is for informational purposes only and does not constitute financial advice. Cryptocurrency markets are highly volatile and unpredictable. All trading decisions should be made based on your own research and risk tolerance. Block Digest is not responsible for any financial losses incurred as a result of acting on this content.