ETH Weekly Analysis — Week of May 04, 2026
ETH Weekly Analysis – Week of May 04, 2026
Weekly Market Overview
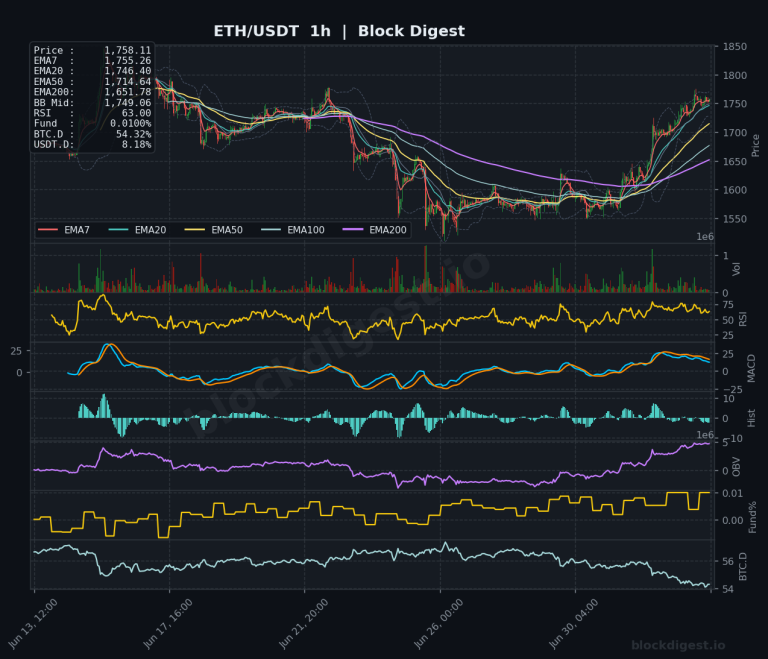
Ethereum has entered a critical inflection point this week, trading at $2,364 as it tests resistance at the weekly EMA7 ($2,271) after weeks of consolidation. The current weekly candle structure shows price attempting to break above the compressed EMA cluster between $2,271-$2,428, signaling a potential shift from the prolonged accumulation phase that has characterized Q1 and early Q2 2026. This week’s price action represents the first meaningful attempt to establish momentum above the mid-$2,300s since the sharp correction from all-time highs, with the weekly candle formation suggesting bulls are defending recent lows around $1,700 while building energy for a directional move.
Higher Timeframe Structure
On the weekly timeframe, ETH remains in a consolidative posture beneath the critical EMA50 ($2,748) and EMA100 ($2,564), though price has successfully reclaimed the EMA7 and is now challenging the EMA20 at $2,428. The Bollinger Bands on the weekly chart show significant compression around the $2,365 midpoint, indicating decreased volatility and an impending expansion phase that typically precedes major directional moves. Price currently sits below the weekly EMA200 at $2,564, which has acted as formidable resistance throughout 2026, but the flattening trajectory of this moving average suggests the macro downtrend may be exhausting. The weekly RSI reading of 45.05 indicates neither overbought nor oversold conditions, leaving room for movement in either direction depending on how this week’s close materializes.
Multi-Timeframe Confluence
The alignment across timeframes shows improving technical structure with the daily chart reflecting price above its EMA7 ($2,319), EMA20 ($2,299), and EMA50 ($2,255), though still below the EMA200 at $2,604. The 4-hour timeframe displays bullish EMA sequencing with price ($2,364) above all shorter-term moving averages (EMA7: $2,343, EMA20: $2,319, EMA50: $2,309), suggesting intraweek momentum supports upward continuation. However, the 1-hour chart reveals price oscillating around its EMA cluster near $2,347, indicating short-term indecision despite the stronger daily and 4h foundations. The confluence of weekly resistance at $2,428 (EMA20) and daily resistance around $2,604 (EMA200) creates a critical battleground zone where bulls must prove conviction to establish a sustainable reversal.
Key Weekly Levels
Weekly Resistance:
- $2,428 – Weekly EMA20 and immediate overhead resistance; breakout above signals continuation toward higher timeframe targets
- $2,564 – Weekly EMA200 and psychological resistance; reclaiming this level would mark a significant trend shift and open path toward $2,750
- $2,748 – Weekly EMA50 and major structural resistance; clearing this zone would confirm macro trend reversal
Weekly Support:
- $2,271 – Weekly EMA7 and near-term support; holding above this level maintains constructive weekly candle structure
- $2,100 – Daily chart confluence zone and previous consolidation area; loss of this level would threaten the recent recovery attempt
- $1,850 – Major weekly support from prior accumulation base; breakdown here would indicate failed recovery and renewed bearish pressure
Momentum & Volume Analysis
The weekly RSI at 45.05 sits in neutral territory with a slight upward slope, showing improving momentum but not yet confirming a bullish trend reversal—historical precedent suggests sustained moves above 50 are needed to validate uptrends on this timeframe. The MACD histogram on both weekly and daily charts displays compression near the zero line with histogram bars beginning to flip positive, suggesting early-stage bullish momentum building but requiring follow-through to confirm. OBV shows gradual accumulation over recent weeks without dramatic spikes, indicating steady buying pressure rather than euphoric speculation. The Funding Rate at 0.0043% remains modestly positive, suggesting slight long bias but not excessive leverage that would indicate overheated positioning—this neutral-to-slightly-bullish funding environment supports the notion that any breakout would have fuel for continuation rather than facing immediate liquidation cascades.
BTC Dominance & Altcoin Implications
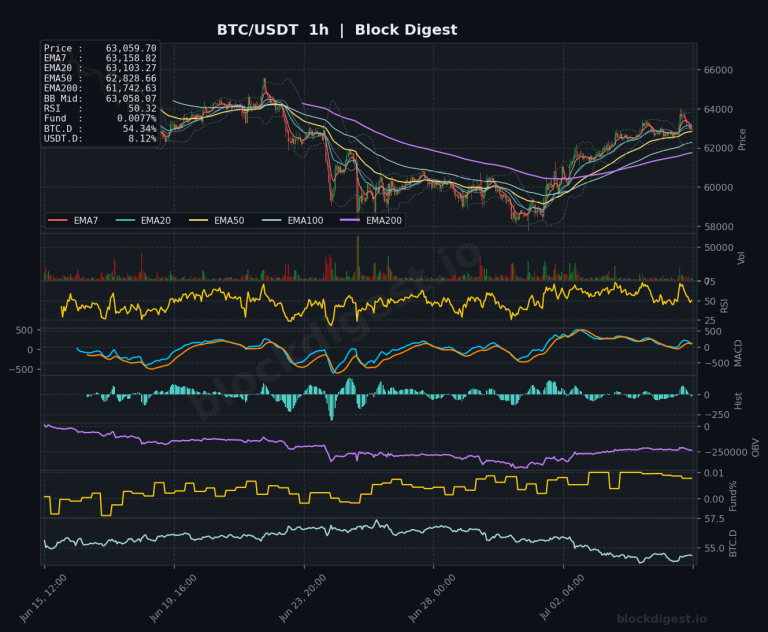
BTC.D currently sits at 54.95%, having risen from its recent lows around 50% during the early 2025 altcoin rally, indicating Bitcoin has been outperforming altcoins including ETH during the recent consolidation phase. The dominance chart shows signs of potential topping formation as BTC.D approaches resistance near 55-56%, which historically has marked inflection points where capital begins rotating back into major altcoins. USDT.D at 6.95% remains elevated compared to bull market periods (typically <5%), suggesting meaningful stablecoin reserves still sit on the sidelines awaiting deployment. The current dominance structure implies that a confirmed Bitcoin continuation above its macro resistance could initially drain liquidity from ETH, but if BTC.D peaks and reverses from current levels while USDT.D declines, it would signal the beginning of alt-season conditions favorable for ETH outperformance in coming weeks.
Risk Scenarios
Bull Case: A decisive weekly close above $2,428 (EMA20) with accompanying volume expansion would confirm breakout and target the weekly EMA100 at $2,564, with extension potential toward $2,748 (EMA50) representing 16% upside. Catalyst-driven momentum from positive regulatory developments, network upgrades, or Bitcoin strength could accelerate the move through compressed resistance levels. Reclaiming and holding the weekly EMA200 would mark the first sustained break above this level in months, likely triggering algorithmic buying and short covering that propels ETH toward $3,000 psychological resistance.
Bear Case: Rejection at the weekly EMA20 ($2,428) coupled with a failed daily close below $2,271 would signal exhaustion of the recent relief rally and expose renewed downside toward $2,100 and potentially $1,850. The compression visible in Bollinger Bands could resolve downward if broader market conditions deteriorate or if Bitcoin fails to hold key support levels, dragging ETH lower in sympathy. A weekly close below $2,100 would create a lower high structure on the weekly timeframe, confirming failed recovery and opening the door to retesting the $1,700 lows with potential extension toward $1,500 if macro conditions worsen significantly.
Weekly Outlook
The week ahead presents a critical juncture for Ethereum as it tests multi-month resistance at the weekly EMA20 near $2,428 with compressed Bollinger Bands suggesting an imminent volatility expansion. Bulls need to secure a weekly close above $2,428 to validate the recovery thesis and target the EMA200 at $2,564, while bears will defend this zone aggressively to maintain the broader consolidation range. Key catalysts to monitor include Bitcoin’s behavior around $67,000-$70,000 resistance, BTC dominance action near 55%, and any macro developments affecting risk sentiment. The setup favors a directional break within 1-2 weeks given the technical compression, with the $2,271-$2,428 zone serving as the pivotal battleground—holding above $2,350 through week’s close would be constructive for bulls, while rejection back below $2,300 would suggest another leg of consolidation or potential downside. Risk/reward currently favors patient positioning with tight stops, as the impending volatility expansion should provide clearer directional signals for swing traders and investors alike.
Disclaimer: This analysis is for informational purposes only and does not constitute financial advice. Cryptocurrency markets are highly volatile and unpredictable. All trading decisions should be made based on your own research and risk tolerance. Block Digest is not responsible for any financial losses incurred as a result of acting on this content.