Ethereum Daily Technical Analysis
Market Overview
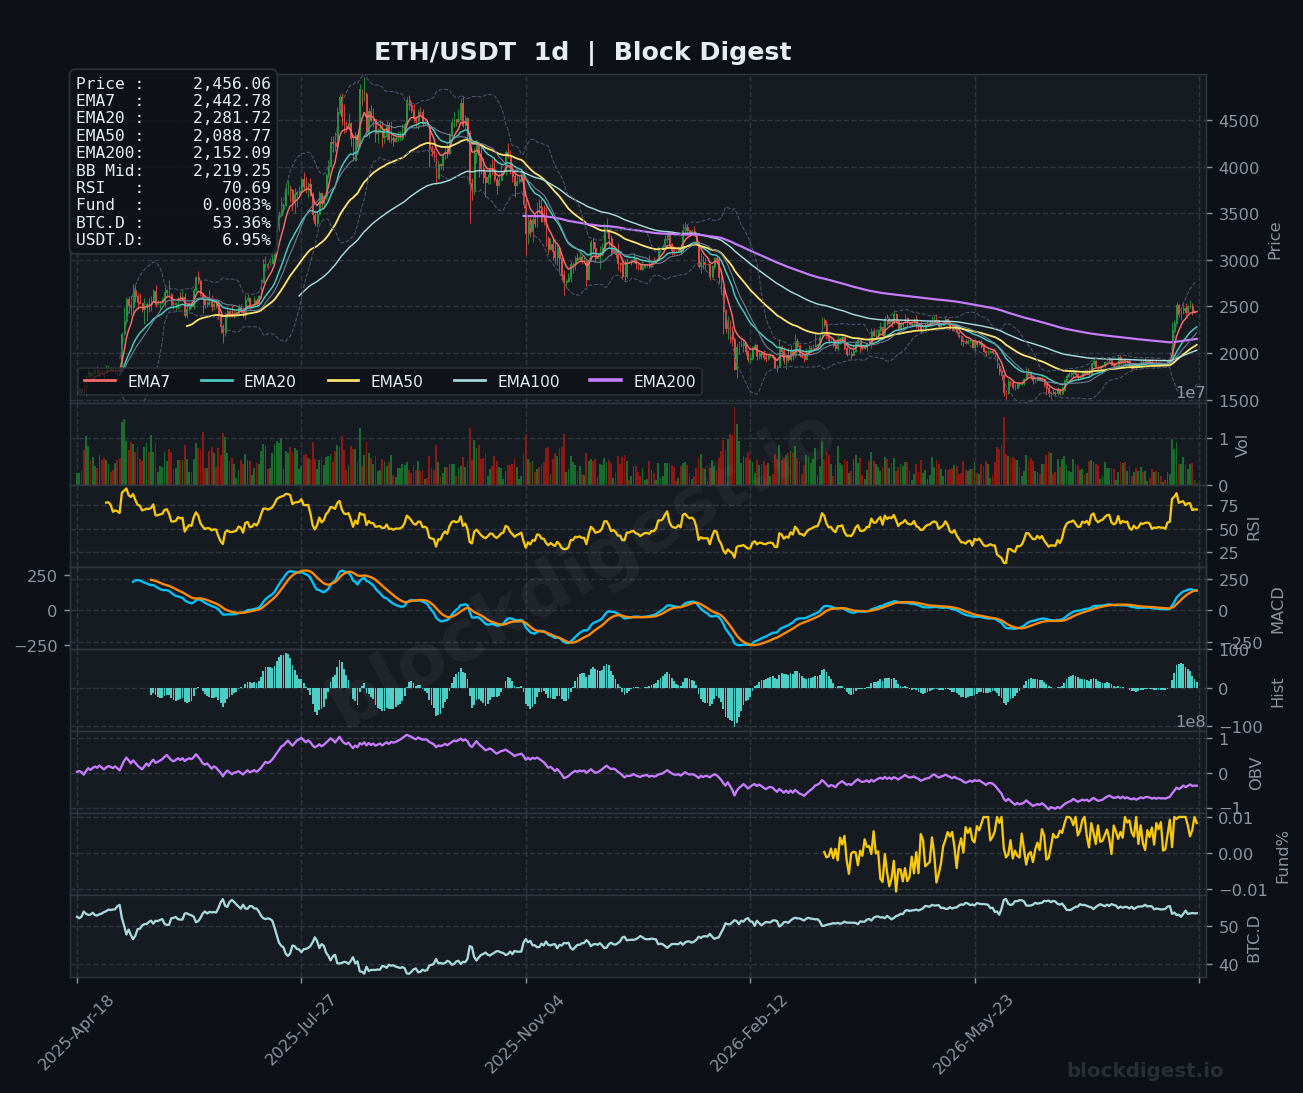
Ethereum is currently navigating a pivotal consolidation phase, trading at $2,456.06, which places it firmly above all major daily EMAs. The price action remains constructive, holding well above the daily Bollinger Band midline of $2,219.25, signaling a sustained bullish structure on the higher timeframe. While the daily trend is clearly defined by the upward slope of the EMA200 at $2,152.09, the price is currently wrestling with short-term resistance near the 1h Bollinger Band upper limit, suggesting a need for a cooling-off period before further expansion.
Multi-Timeframe Confluence
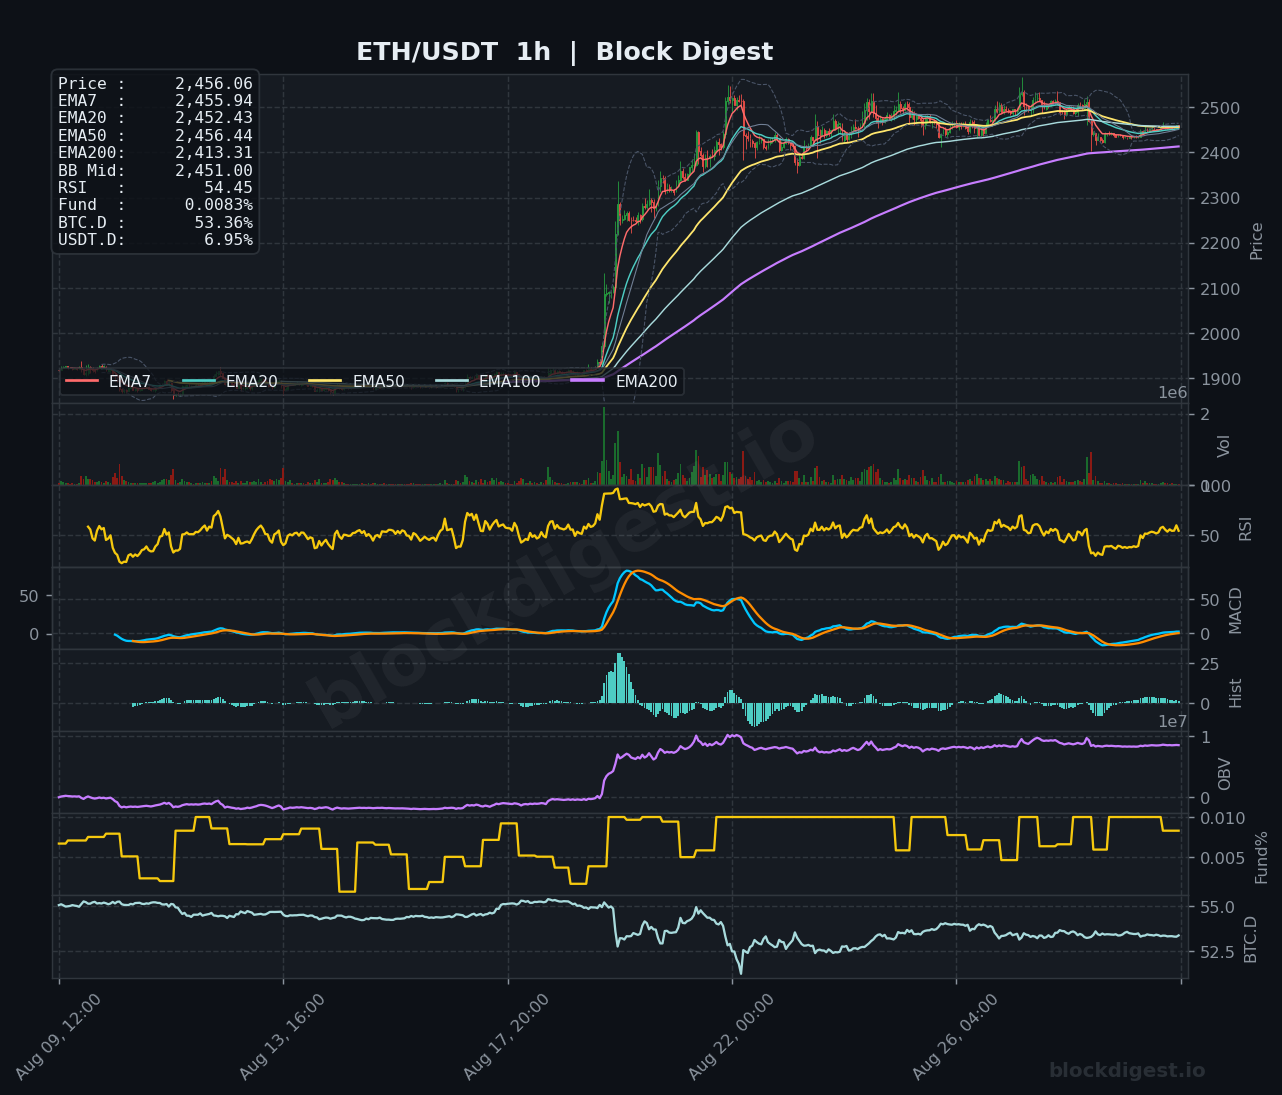
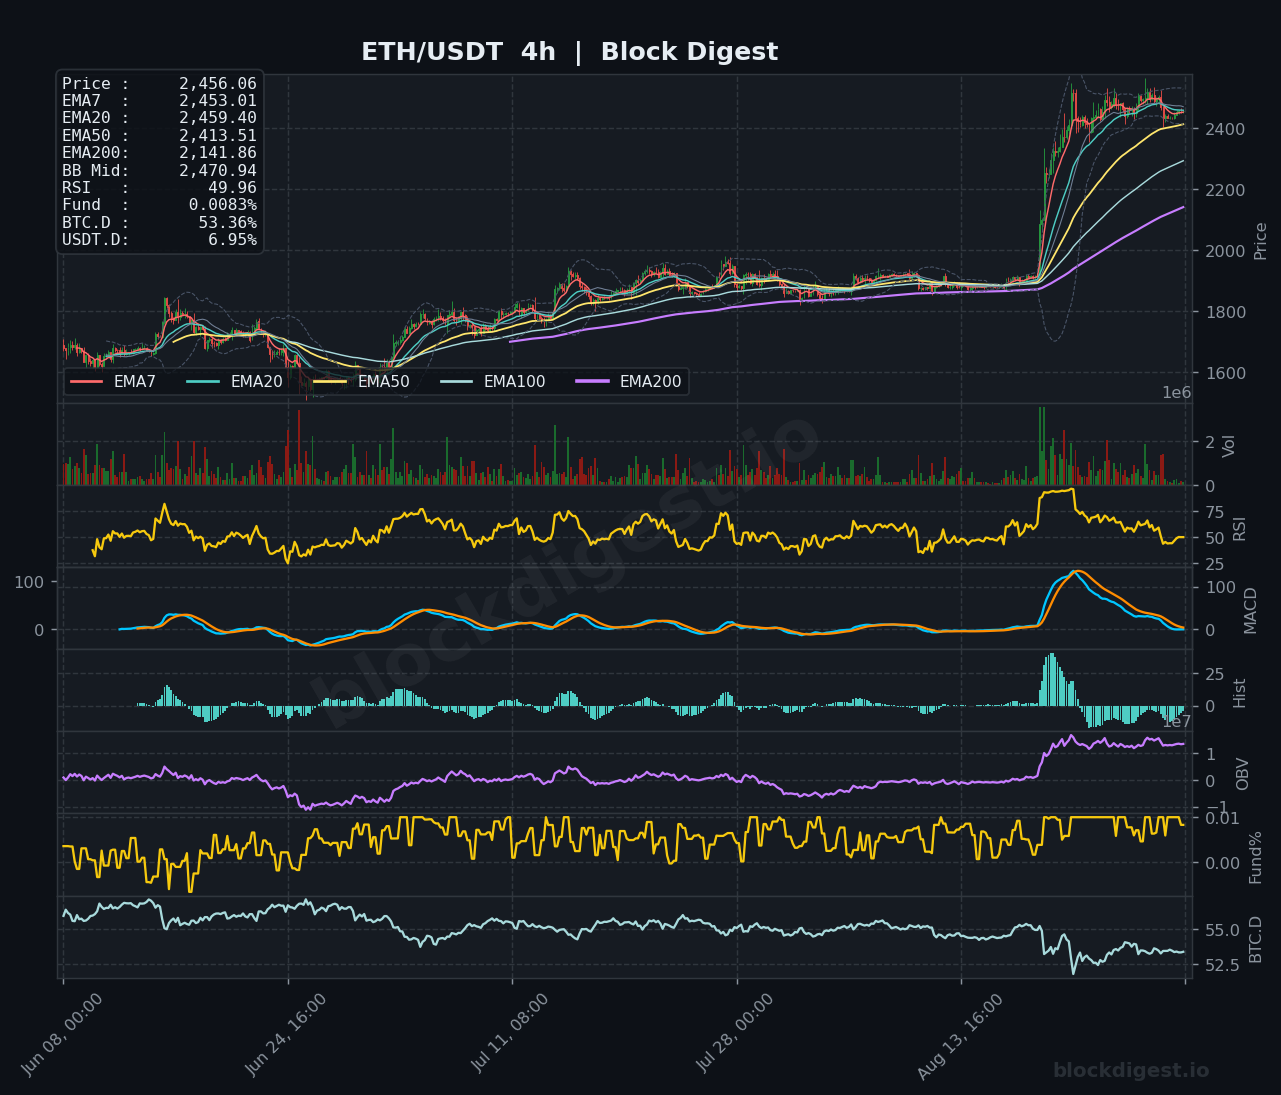
The 1h and 4h timeframes show a slight divergence as the price sits between the 1h EMA7 ($2,455.94) and the 4h EMA20 ($2,459.40), indicating a localized tug-of-war between bulls and bears. However, the 1d timeframe provides a strong foundation, with the price comfortably above the EMA7 ($2,442.78), confirming that the medium-term momentum remains intact despite the short-term noise. Confluence is building around the $2,450 zone, which acts as a pivot point across all three timeframes, serving as the immediate battleground for the next directional move.
Key Levels to Watch
- Resistance:
- $2,528.33: The 4h Bollinger Band upper band, representing the immediate ceiling for a breakout.
- $2,770.60: The daily Bollinger Band upper band, serving as the primary target for a sustained bullish trend.
- $2,500.00: A psychological barrier that has acted as a localized supply zone on the 1h chart.
- Support:
- $2,413.55: The 4h Bollinger Band lower band, providing critical support for the current consolidation.
- $2,281.72: The daily EMA20, which acts as the primary line of defense for the current trend.
- $2,152.09: The daily EMA200, representing the long-term structural support level.
Momentum & On-Chain Signals
Momentum indicators reflect a market in a state of high intensity; our proprietary BD Pulse score of 83/100 confirms an “Extreme Bull” environment. While the daily RSI is elevated at 70.69, suggesting the asset is approaching overbought territory, the OBV trend remains positive, indicating that volume is still flowing into the asset during this consolidation. With a BD Extreme Index of +1.81σ, the market is technically overextended, yet the funding rate of +0.0094% remains remarkably stable, suggesting that the current leverage is not yet reaching a point of extreme speculative froth.
BTC Dominance & Market Sentiment
BTC Dominance at 53.36% suggests that Bitcoin continues to dictate the broader market rhythm, keeping altcoin volatility somewhat tempered. With USDT dominance hovering at 6.95%, there is sufficient liquidity on the sidelines, indicating that the market is waiting for a clear catalyst to rotate capital back into ETH for a potential push toward the upper resistance levels.
Risk Scenarios
- Bullish case: A decisive 4h close above the $2,528 resistance would confirm a breakout, likely targeting the $2,770 daily upper band as the next major liquidity objective.
- Bearish case: A failure to hold the $2,413 support level would signal a breakdown, potentially leading to a retest of the daily EMA20 at $2,281 as buyers attempt to defend the trend.
Outlook
The outlook for ETH remains cautiously bullish, provided the price maintains its position above the $2,413 support level. We expect the next 24-48 hours to be defined by range-bound volatility as the market digests the recent gains and allows the RSI to normalize. Traders should monitor the 1h MACD for a potential bullish crossover, which would serve as a trigger for a move toward the $2,500 psychological level. Overall, the structural setup remains sound, but the high BD Extreme Index suggests that chasing breakouts at these levels carries significant risk.
Disclaimer: This analysis is for informational purposes only and does not constitute financial advice. Cryptocurrency markets are highly volatile and unpredictable. All trading decisions should be made based on your own research and risk tolerance. Block Digest is not responsible for any financial losses incurred as a result of acting on this content.