Ethereum Daily Analysis: Ethereum consolidates at $1,863 near Bollinger midline
Market Overview
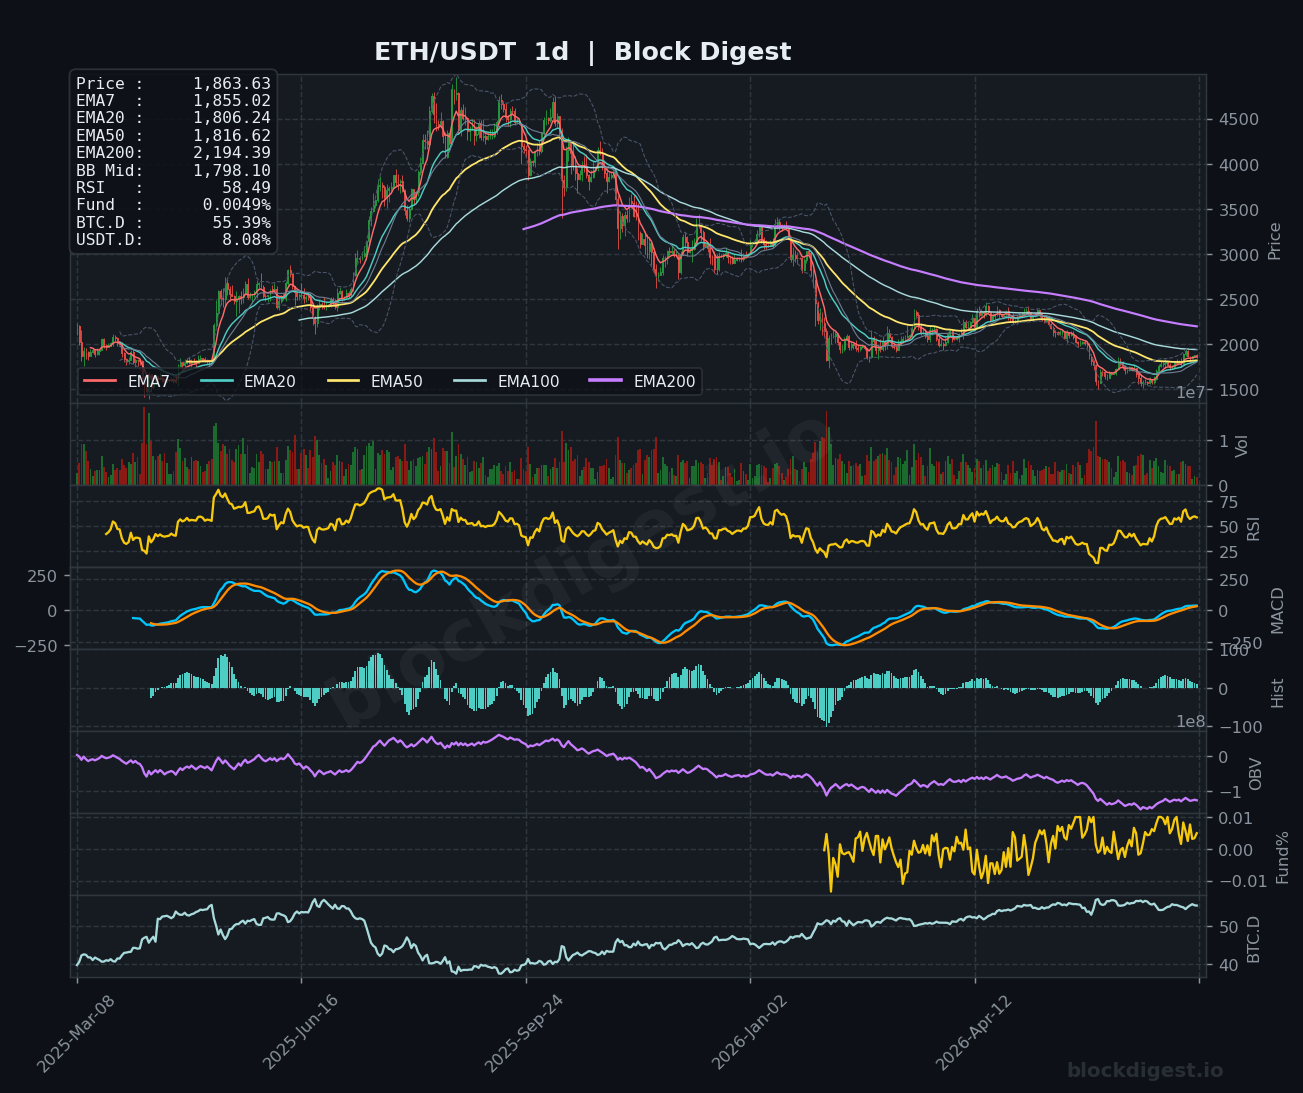
Ethereum is trading at $1,863.63 as of July 20, 2026, consolidating just below the Bollinger Band midline on the daily chart ($1,798.10 BB Mid) after a meaningful recovery from lows near $1,550 seen earlier this quarter. Price has reclaimed all short-term EMAs on the daily timeframe — the EMA7 ($1,855.02), EMA20 ($1,806.24), and EMA50 ($1,816.62) are all now trading below current price, signaling a recovering structure. However, the daily EMA200 remains far overhead at $2,194.39, a sobering reminder that the broader macro trend is still bearish. The recent CPI-driven surge that briefly pushed ETH above $1,900 has faded, with geopolitical headwinds from ongoing Middle East tensions and a closed Strait of Hormuz tempering what had been a promising breakout attempt.
Multi-Timeframe Confluence
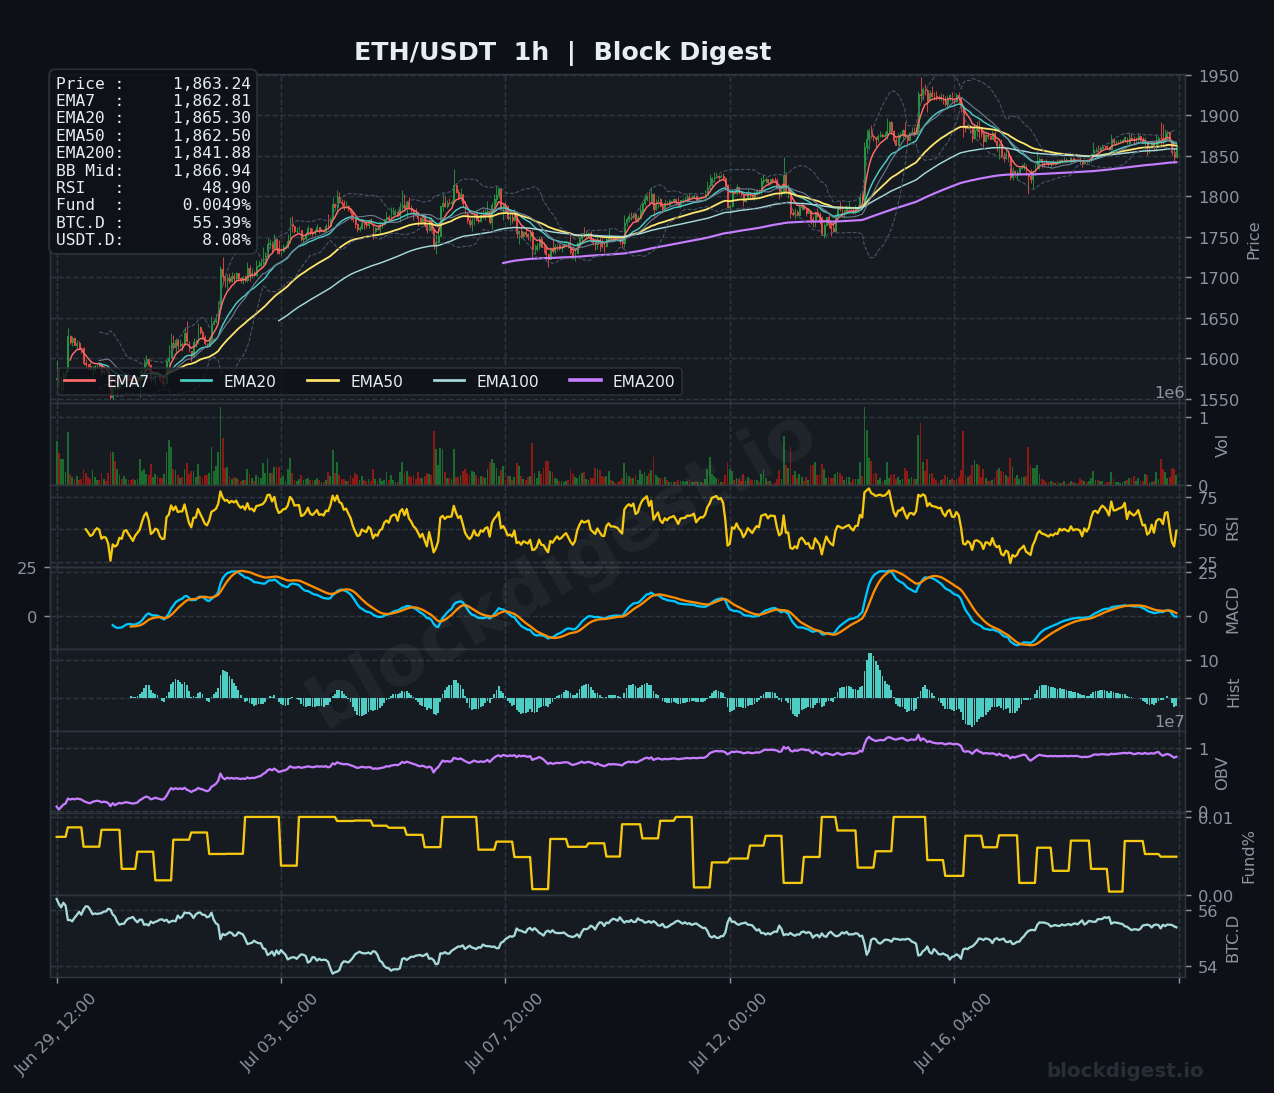
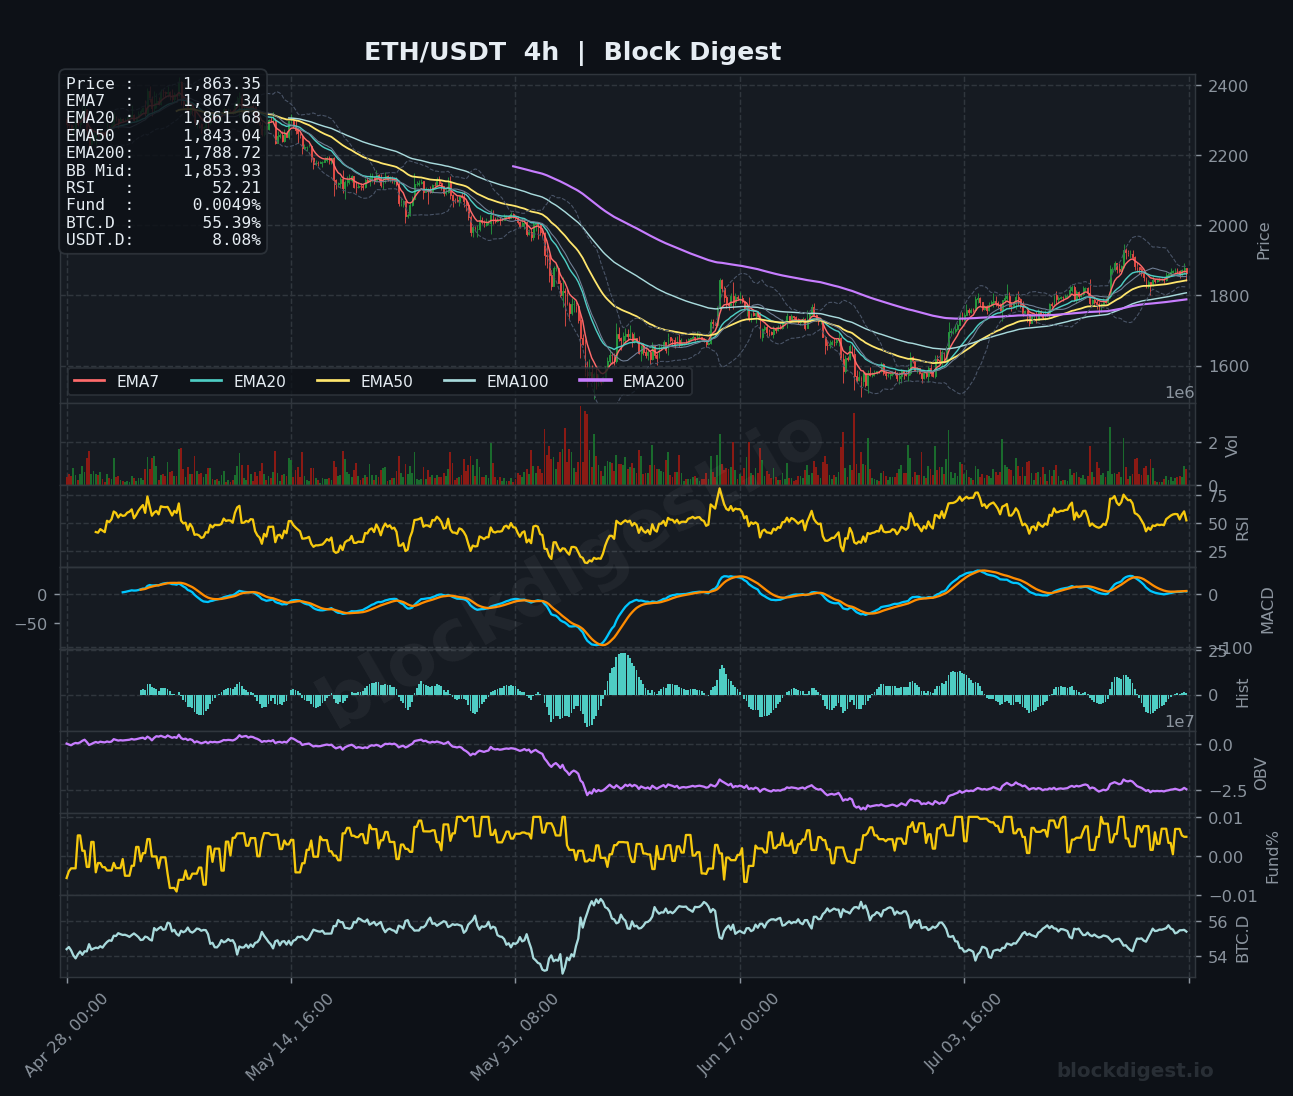
On the 1-hour chart, price at $1,863.24 sits nearly flat across EMA7 ($1,862.81), EMA20 ($1,865.30), and EMA50 ($1,862.50), indicating a tight consolidation zone with no clear near-term directional bias. The 4-hour chart presents a more constructive picture — price has crossed back above both EMA20 ($1,861.68) and EMA50 ($1,843.04) after a prolonged period of trading below them, suggesting the intermediate trend is attempting a genuine recovery. The daily chart confirms that the short-term EMAs are in a bullish stack, though the failure to hold above $1,900 this week has left a visible rejection wick, creating a confluence resistance zone between $1,900 and $1,950 that will require sustained buying pressure to overcome.
Key Levels to Watch
- Resistance: $1,900–$1,910 — This zone marks the recent swing high rejection where ETH briefly broke out post-CPI before reversing; reclaiming this level on a 4h close would be a meaningful technical development.
- Resistance: $1,950 — The upper Bollinger Band on the daily chart and a structural swing level from the prior consolidation range; clearing this would signal a potential shift in the higher timeframe trend.
- Resistance: $2,194 — The daily EMA200, which has acted as the overriding ceiling throughout the bear phase and remains the definitive line separating recovery from full trend reversal.
- Support: $1,843 — The 4h EMA50, which ETH recently reclaimed and which now serves as the first meaningful line of defense on any near-term pullback.
- Support: $1,800–$1,806 — Confluence of the daily Bollinger Band midline ($1,798.10) and the daily EMA20 ($1,806.24); a loss of this zone on a daily close would meaningfully damage the current recovery thesis.
- Support: $1,720–$1,750 — The broader structural demand zone that arrested the prior decline and corresponds with the lower Bollinger Band on the daily timeframe; a test of this area would suggest the recovery has failed.
Momentum & On-Chain Signals
The RSI picture is constructive but far from overbought — the daily RSI sits at 58.49, the 4h at 52.21, and the 1h at 48.90, all clustered in neutral-to-mildly-bullish territory that leaves room to run without immediate mean-reversion risk. Block Digest’s proprietary BD Pulse score corroborates this reading at 57/100 (Bullish), while the BD Extreme Index at +0.79σ confirms the market remains well within a normal range — no signs of euphoria or capitulation. The 4h MACD has crossed into positive territory and the histogram is showing small positive bars, a tentative bullish signal, though the 1h MACD is flattening near zero after the recent pullback from $1,900. The OBV trend, registering a score of -1 in our on-chain data, remains a mild concern — it suggests that volume on down moves has been marginally outpacing accumulation, a dynamic worth monitoring if price stalls at current levels.
BTC Dominance & Market Sentiment
BTC dominance is sitting at 55.38% — a level that has drifted higher over recent months and continues to apply relative pressure on altcoins including ETH. That said, the 1h chart shows BTC.D trending slightly lower from its recent peak near 56%, which, if sustained, could provide a modest tailwind for ETH outperformance in the near term. USDT dominance at 8.08% reflects a still-elevated preference for stable assets, consistent with a market that is cautiously optimistic but not yet willing to commit aggressively to risk — a sentiment that aligns with the push-and-pull between the CPI-driven optimism and the ongoing geopolitical overhang.
Risk Scenarios
- Bullish case: A sustained hold above $1,865 followed by a 4h close above $1,900 — supported by easing Middle East tensions or continued ETF inflows — would open a path toward $1,950 and potentially a retest of the $2,000 psychological level. Passage of the CLARITY Act or additional dovish macro signals could accelerate this move.
- Bearish case: Failure to hold the $1,843 4h EMA50 on a closing basis, particularly if accompanied by an OBV deterioration or a spike in BTC dominance, would likely send ETH retesting the $1,800–$1,806 confluence zone. A confirmed daily close below $1,800 would invalidate the current recovery structure and shift focus back toward the $1,720–$1,750 demand zone.
Outlook
Ethereum is at a technically interesting but genuinely pivotal juncture — the short-term EMA structure is bullish, momentum indicators are neutral-to-constructive, and the macro backdrop offered a clear catalyst earlier this week, yet price failed to hold the $1,900 breakout. The next 24–48 hours are likely to be defined by whether geopolitical pressures continue to suppress risk appetite or whether improving macro sentiment and institutional inflows — evidenced by positive ETF flows — can reassert the upside case. A clean 4h close above $1,900 would be the primary trigger to watch for bullish confirmation, while a breakdown below $1,843 on the 4h timeframe would suggest the path of least resistance has shifted lower. The overall setup leans cautiously constructive, but the failed $1,900 attempt and muted OBV signal demand patience over conviction at these levels.
Disclaimer: This analysis is for informational purposes only and does not constitute financial advice. Cryptocurrency markets are highly volatile and unpredictable. All trading decisions should be made based on your own research and risk tolerance. Block Digest is not responsible for any financial losses incurred as a result of acting on this content.