Ethereum Daily Analysis: ETH consolidates at $1,828 after pullback from $1,950
Market Overview
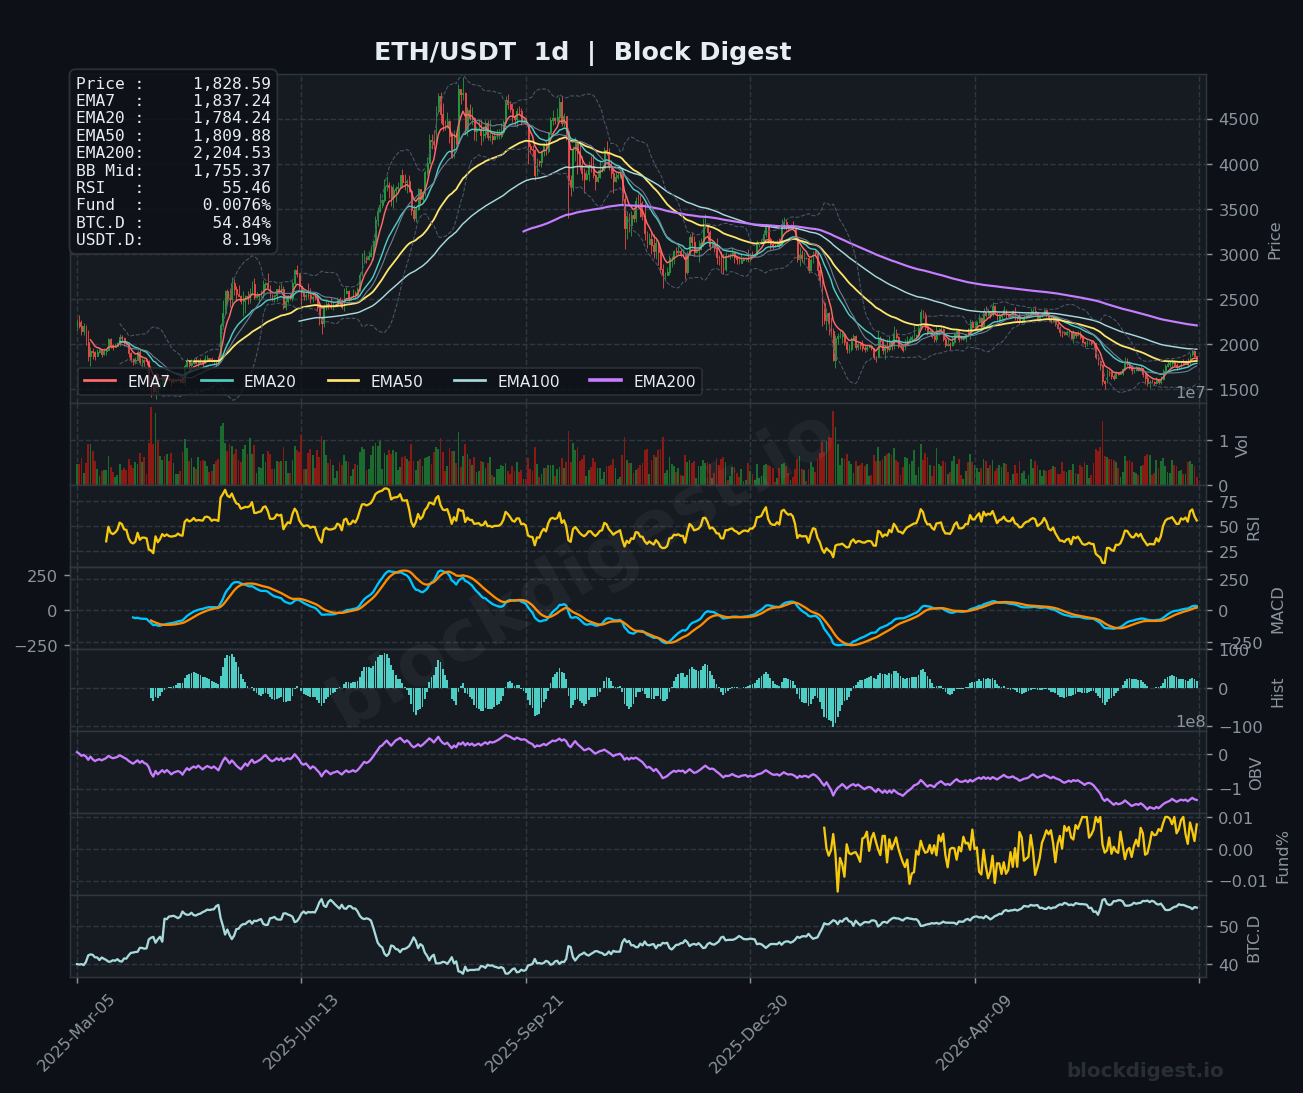
ETH/USDT is trading at approximately $1,828–$1,829 as of July 17, 2026, consolidating after a sharp pullback from a recent local high near $1,950. On the daily timeframe, price has recovered meaningfully from multi-month lows below $1,500 set in early 2026, and is now trading above the daily EMA7 ($1,837), EMA20 ($1,784), and EMA50 ($1,809) — a constructive alignment that signals the intermediate trend is attempting recovery. However, the daily EMA200 remains far overhead at $2,204, confirming that the macro structure is still bearish and ETH has significant ground to reclaim. Price is currently sitting above the daily Bollinger Band midline ($1,755), suggesting a modest bullish lean within the broader downtrend.
Multi-Timeframe Confluence
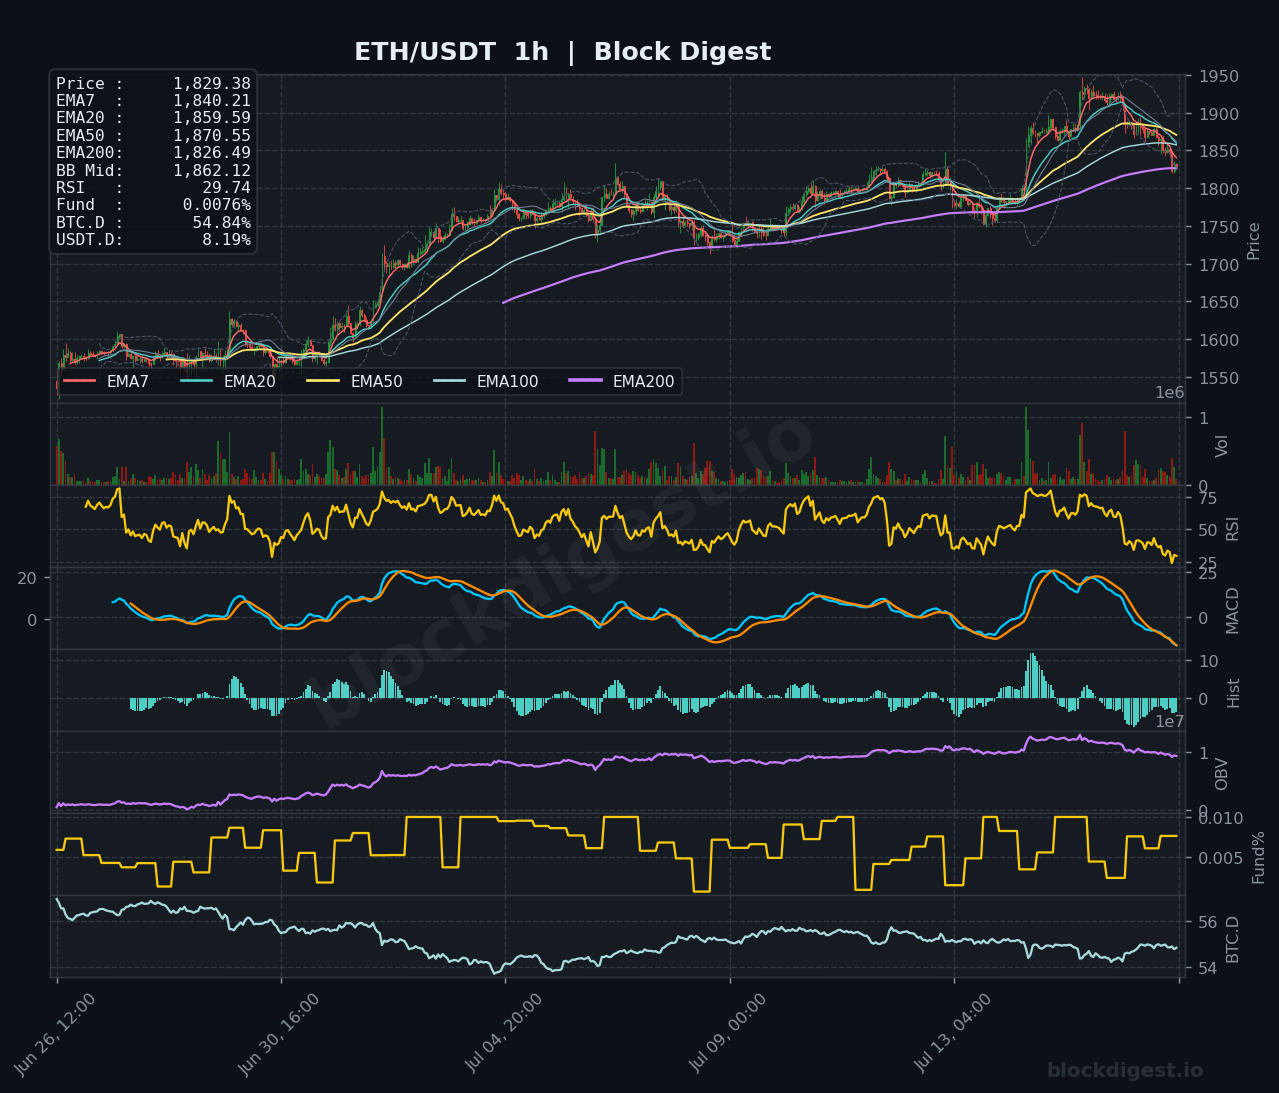
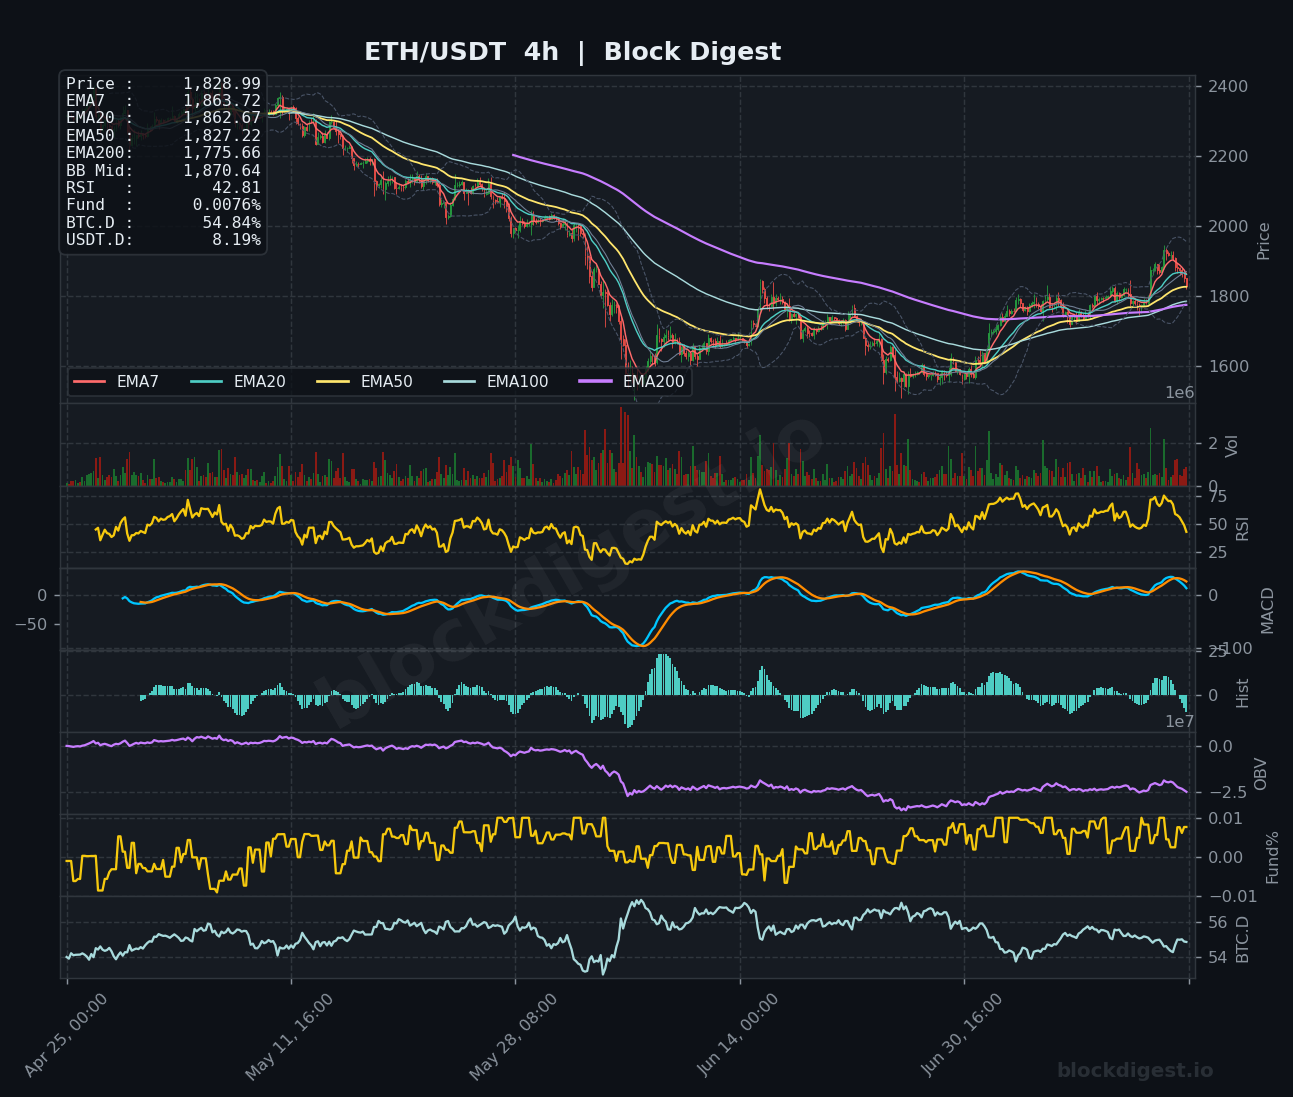
The 1-hour chart presents the most cautious near-term picture: price at $1,829 has broken below the EMA7 ($1,840), EMA20 ($1,859), EMA50 ($1,870), and BB Mid ($1,862), with the RSI collapsing to an oversold 29.74 — indicating intense short-term selling pressure. On the 4-hour chart, price ($1,828) sits right at the EMA50 ($1,827), which is a critical near-term support; the RSI at 42.81 is neutral-to-weak but not yet oversold, and the MACD lines are converging near zero after a gradual bullish cross attempt. The daily chart shows a healthier configuration with EMAs stacked bullishly at shorter lengths, but the 4h and 1h charts warn that the recent correction off $1,950 may have further to go before stabilizing. The confluence of $1,827–$1,830 across multiple timeframes makes this zone a pivotal battleground.
Key Levels to Watch
- Resistance: $1,862–$1,870 — cluster of the 1h EMA20/EMA50 and 4h BB Mid; any recovery must clear this zone convincingly to shift short-term momentum bullish
- Resistance: $1,900–$1,910 — the recent local high rejection zone visible on the 1h chart, where price topped out and selling accelerated; also a psychological round number
- Resistance: $1,950 — the near-term swing high, representing the upper range of the recent rally; a breakout above here would open a path toward the $2,000+ area
- Support: $1,827 — the 4h EMA50 and current price pivot; losing this on a 4h close would be a bearish signal for near-term structure
- Support: $1,784 — daily EMA20, the next meaningful structural support and the level that has capped downside during the recovery phase
- Support: $1,755 — daily Bollinger Band midline; a breakdown below this would shift the daily bias back to bearish and expose the $1,650–$1,600 range
Momentum & On-Chain Signals
The 1-hour RSI at 29.74 is deeply oversold, historically a zone where short-covering bounces emerge — however, oversold conditions can persist in strong downtrends, so confirmation of a reversal candle is required before acting. The 4-hour MACD shows lines lingering just above zero with a mildly positive histogram, suggesting the broader recovery remains intact even as the current pullback weighs on shorter timeframes. On the daily chart, the RSI at 55.46 is the most constructive reading — holding above the 50 midline signals that bulls retain control of the medium-term momentum cycle. The 1-hour OBV continues its steady upward trajectory across the broader recovery period, suggesting net accumulation has not reversed despite the recent price weakness, which is a mildly bullish divergence worth monitoring.
BTC Dominance & Market Sentiment
BTC dominance (BTC.D) sits at 54.84%, a level that has been gradually declining from its recent peak above 56%, suggesting capital is beginning to rotate modestly toward altcoins — a mild tailwind for ETH. USDT.D at 8.19% reflects that a meaningful portion of capital remains sidelined in stablecoins, indicating investors are not yet deploying risk capital aggressively; until USDT.D trends meaningfully lower, sustained altcoin rallies will likely face headwinds. The combination of moderately elevated BTC dominance and stubborn USDT.D suggests the broader market remains cautious, consistent with the geopolitical uncertainty (Iranian strikes on U.S. bases) and profit-taking that has weighed on crypto this week.
Risk Scenarios
- Bullish case: If the $1,827–$1,830 zone holds as support on the 4h timeframe and the 1h RSI bounces from oversold territory, ETH could stage a recovery toward $1,862–$1,870 initially, with a stronger bid targeting the $1,900–$1,950 range if macro risk appetite improves on the back of the softer CPI narrative.
- Bearish case: A confirmed 4h close below $1,827 (EMA50) followed by a daily close under $1,784 (EMA20) would invalidate the current recovery structure, opening a retest of the $1,755 BB midline and potentially the $1,650 range where prior consolidation occurred.
Outlook
The near-term setup for ETH is cautiously neutral with a short-term bearish lean, as the 1-hour chart deterioration and macro headwinds from geopolitical stress weigh on price action. However, the daily timeframe remains constructively positioned above key EMAs, and the oversold 1-hour RSI suggests a relief bounce could materialize in the next 12–24 hours. The critical level to watch over the next 48 hours is $1,827 on a 4-hour closing basis — holding here keeps the recovery narrative alive, while losing it shifts the immediate risk toward $1,784 and below. Bulls need a decisive reclaim of $1,862–$1,870 to neutralize the current selling pressure and reestablish upward momentum.
Disclaimer: This analysis is for informational purposes only and does not constitute financial advice. Cryptocurrency markets are highly volatile and unpredictable. All trading decisions should be made based on your own research and risk tolerance. Block Digest is not responsible for any financial losses incurred as a result of acting on this content.