Altcoin Daily Analysis: Altcoins Under Pressure as BTC Dominance Rises
Market Context
The broader altcoin market is under modest but persistent selling pressure as of July 17, 2026, with the global crypto market cap shedding 2.70% over the past 24 hours to sit at $2.16 trillion. BTC dominance remains elevated at approximately 54.84%, signaling that capital continues to rotate defensively toward Bitcoin rather than flowing into altcoins. USDT dominance holding at 8.19% confirms a cautious risk-off posture, with sidelined liquidity not yet re-entering speculative positions in force.
Solana (SOL)
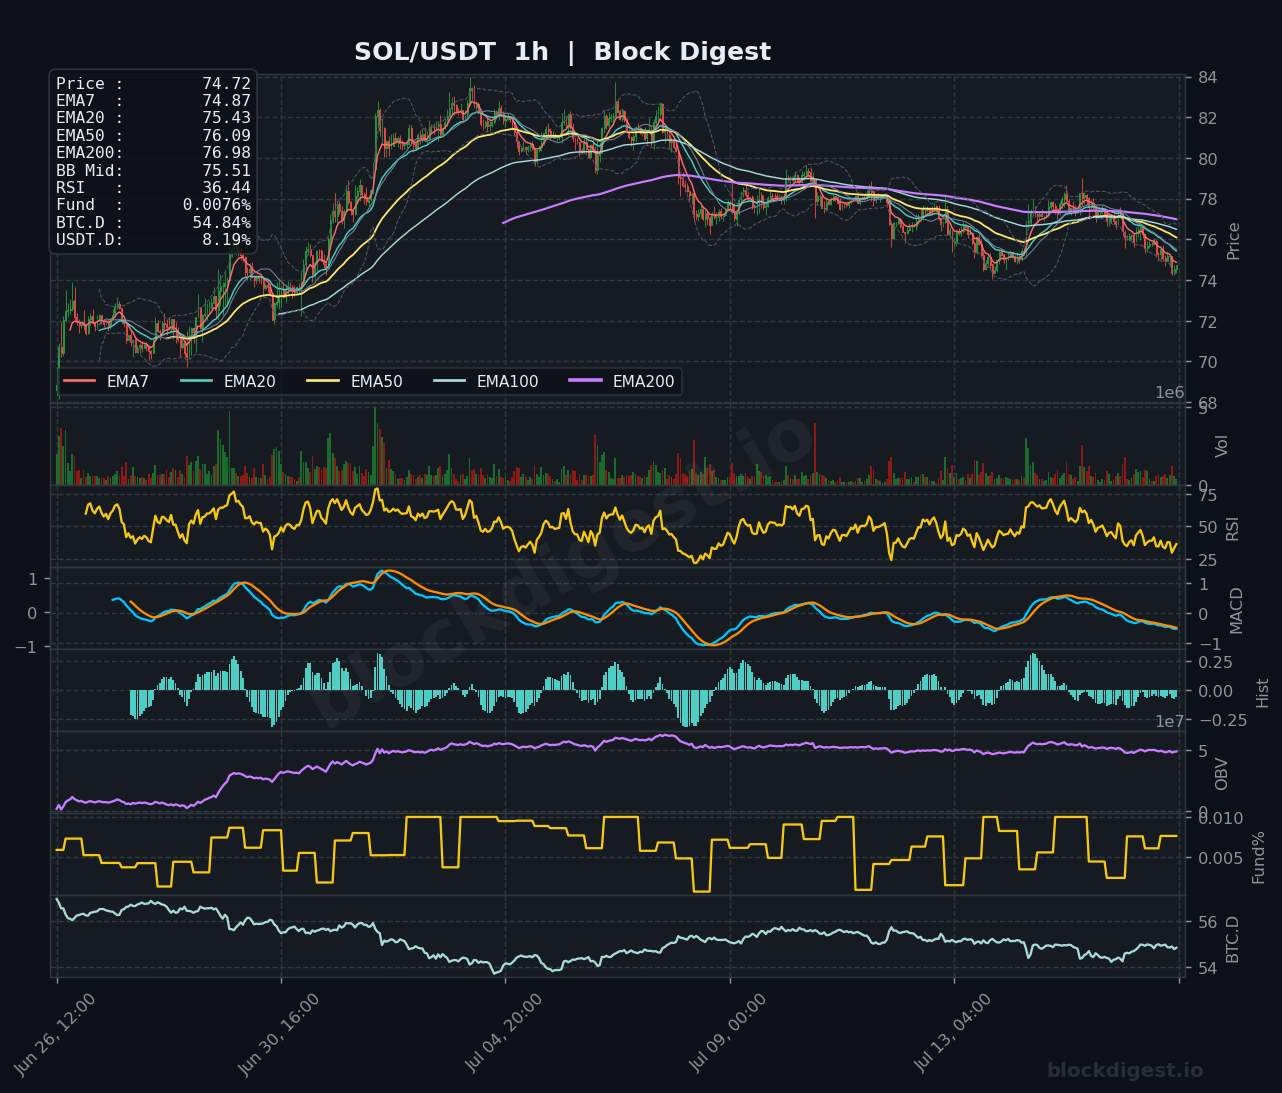
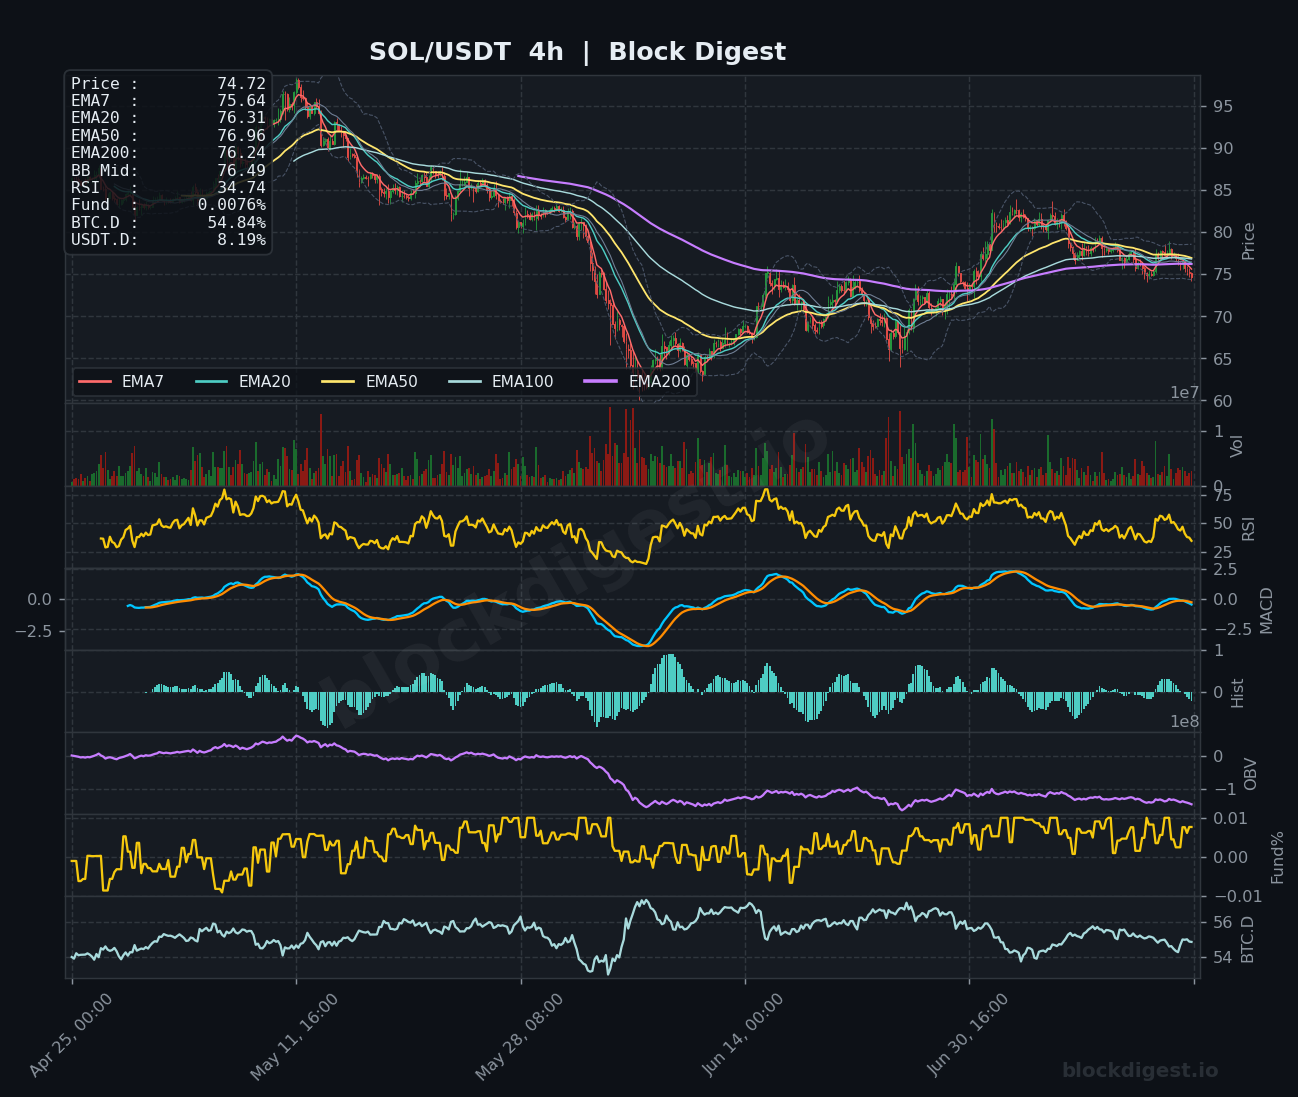
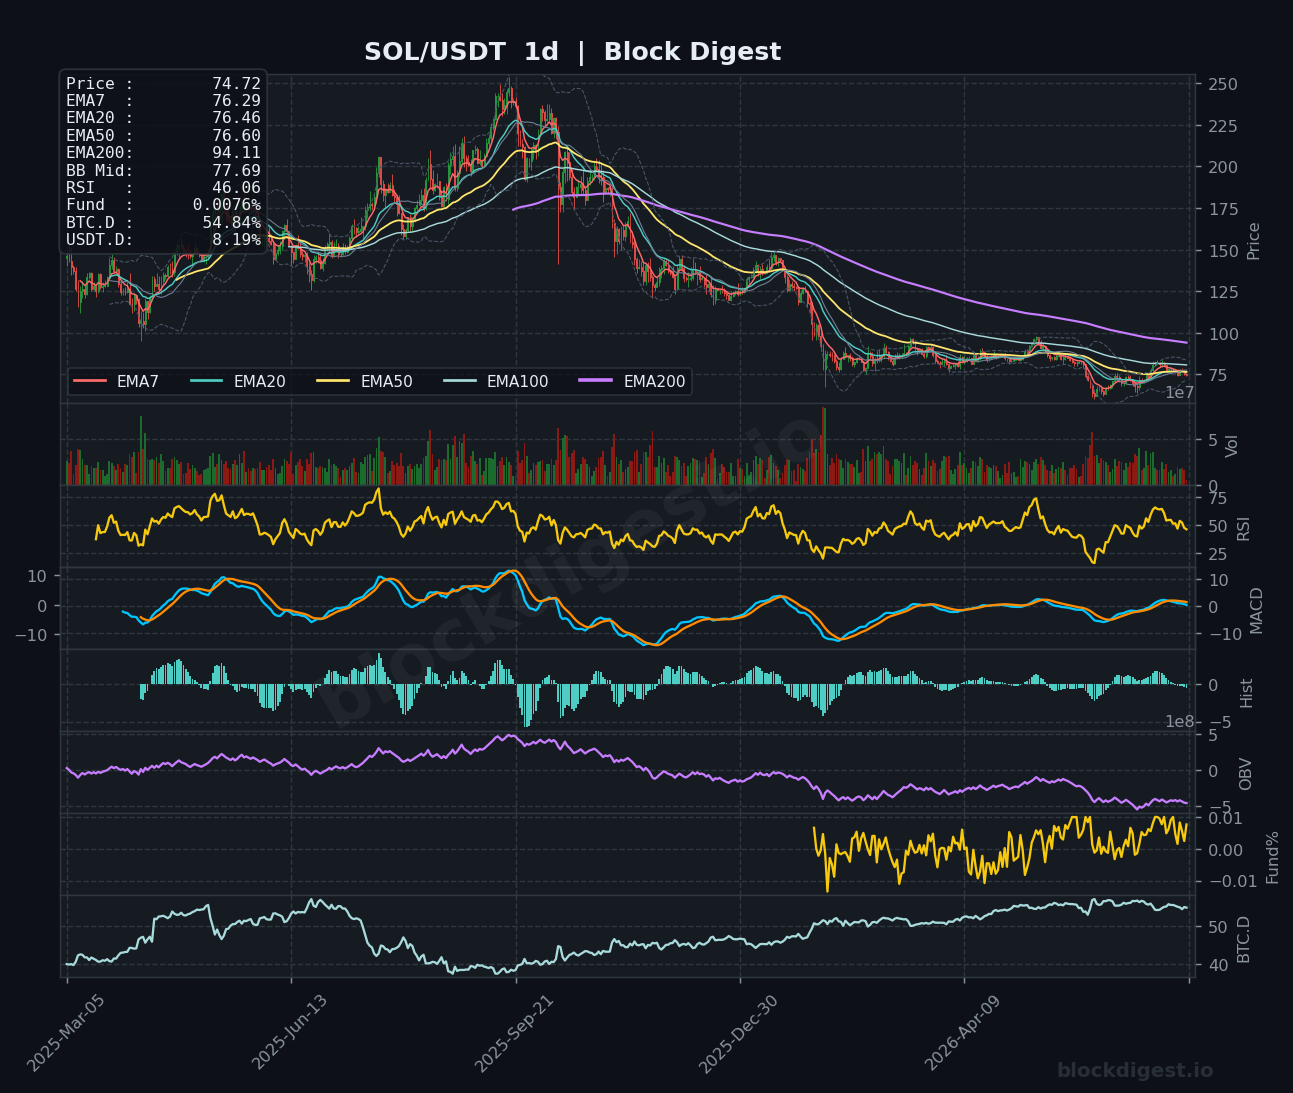
SOL is trading at $74.72, sitting beneath all key EMAs on the 1h chart — with the EMA7 at $74.87, EMA20 at $75.43, EMA50 at $76.09, and EMA200 at $76.98 — painting a clearly bearish short-term structure. The 1h RSI of 36.44 and the 4h RSI of 34.74 both reflect deteriorating momentum without yet reaching oversold extremes that would typically attract dip buyers. On the daily chart, the RSI sits at a more neutral 46.06, but price remains well below the EMA200 at $94.11, underscoring the severity of the longer-term downtrend that has been in place since last year’s highs. With analysts flagging a critical support zone near $67 should the $76–$76.50 EMA cluster fail to recapture as resistance, the short-term bias for SOL is bearish, though the bullish narrative around Solana’s RWA leadership and the pending spot ETF filing could provide a fundamental floor near current levels.
XRP (XRP)
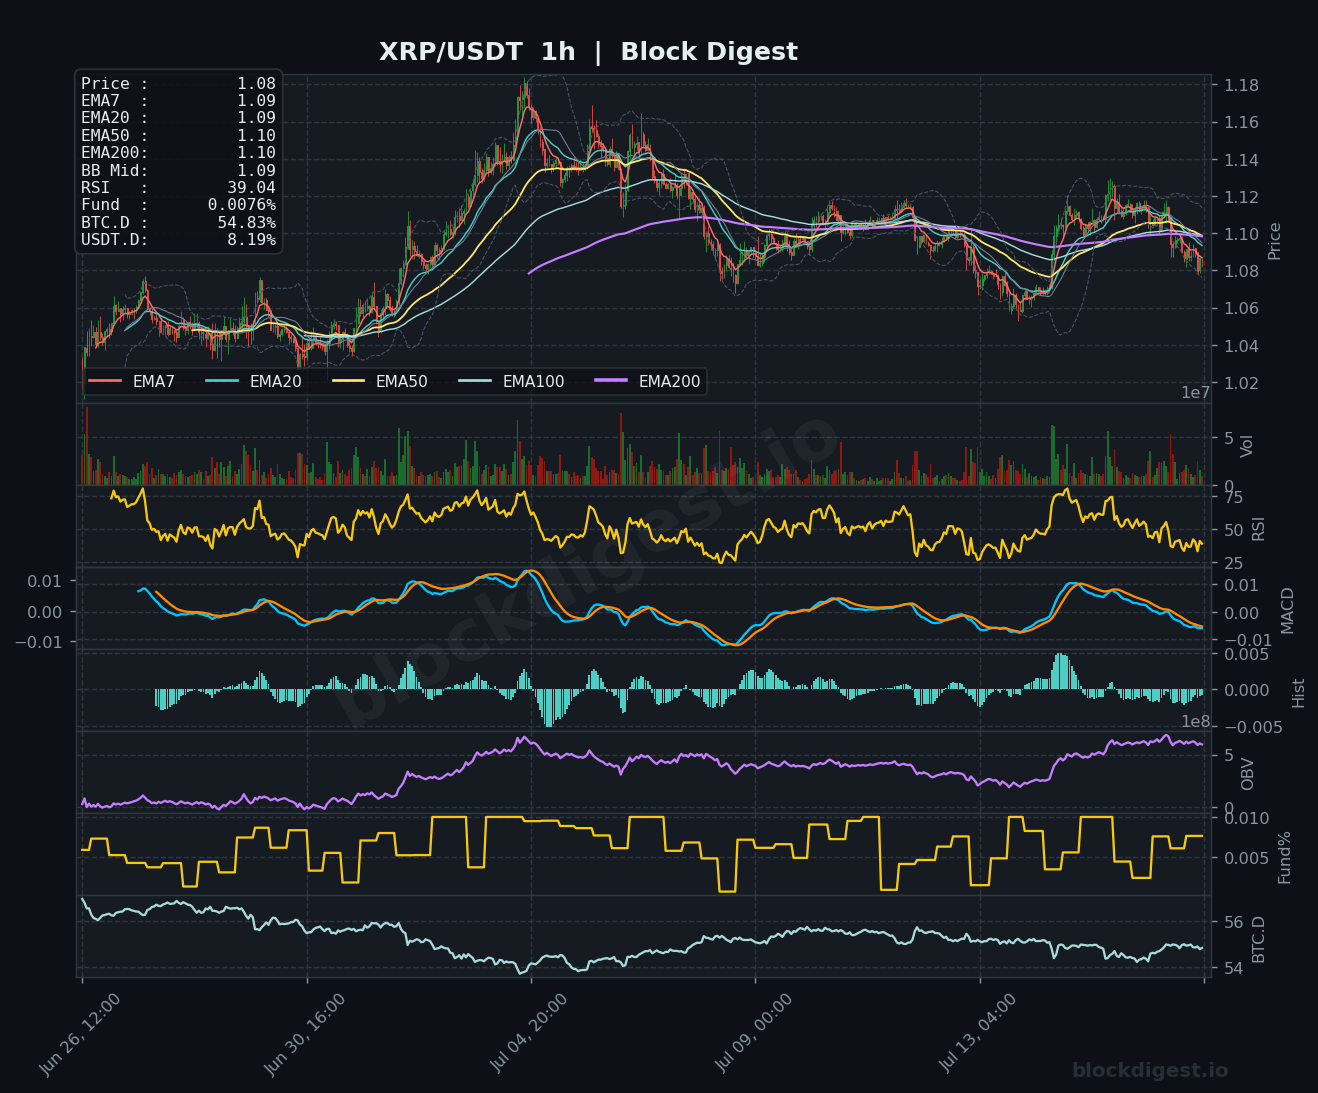
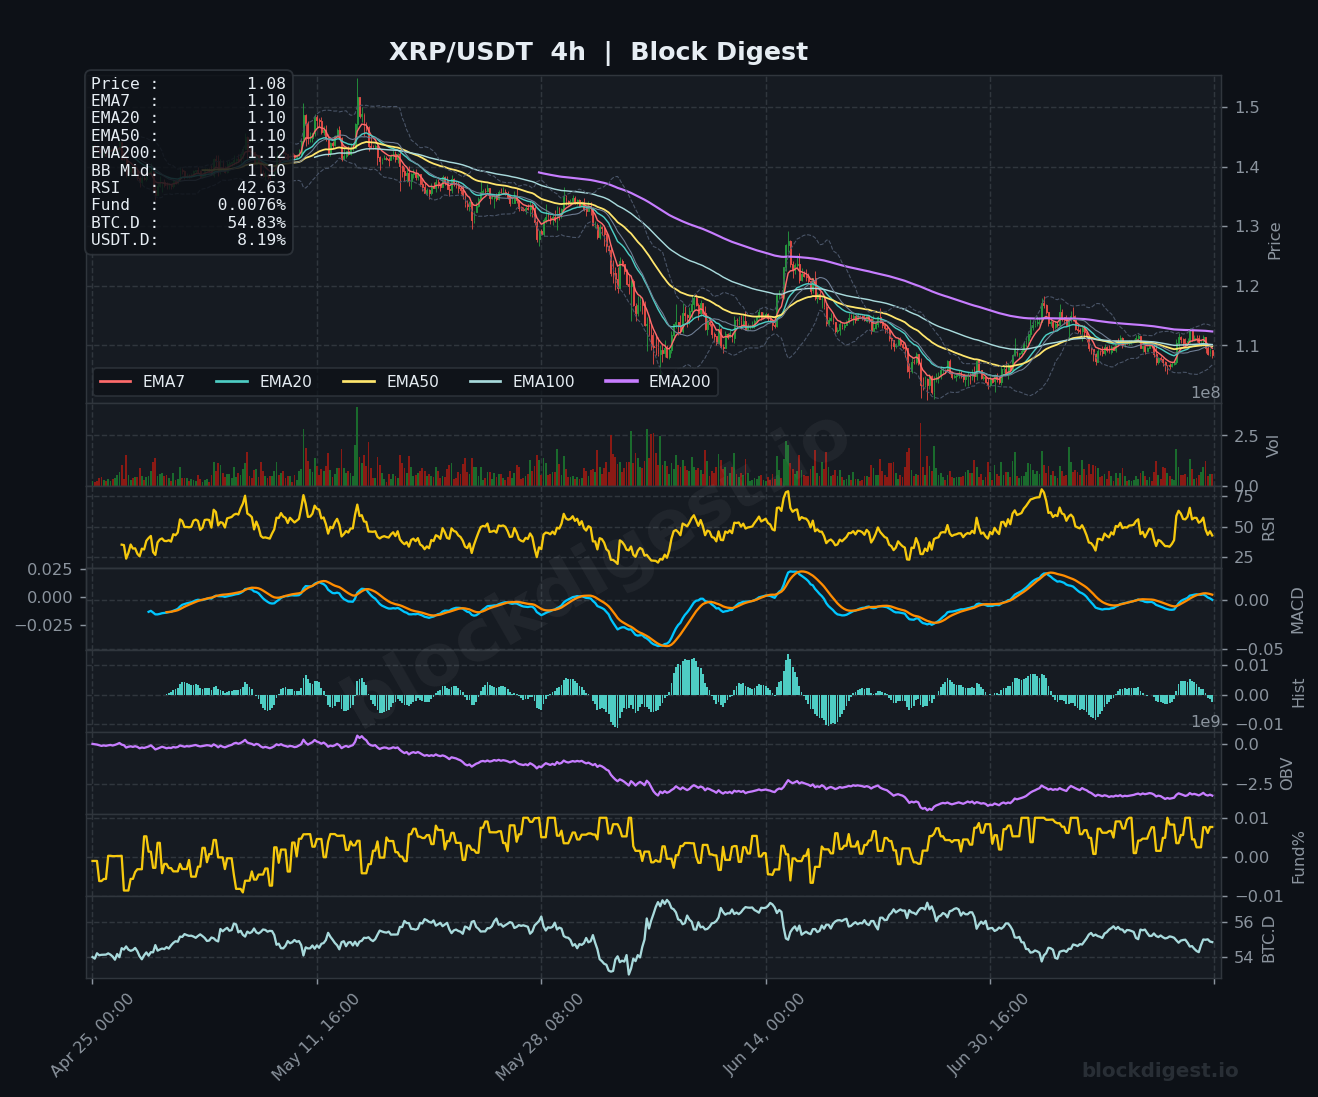
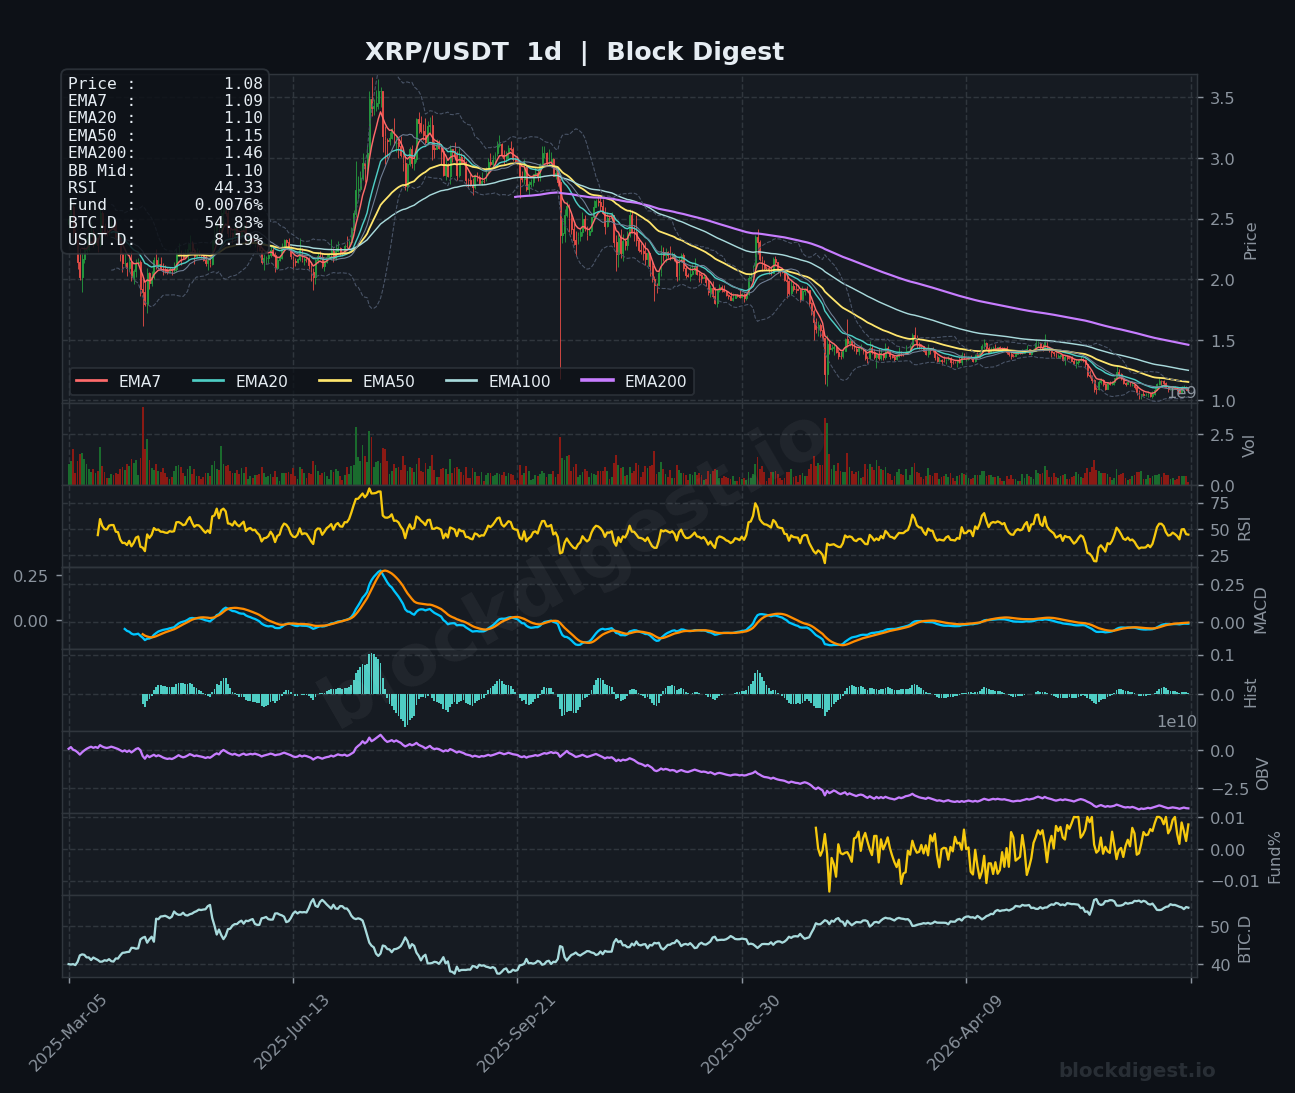
XRP is trading at $1.08, slipping below all short-term EMAs on the 1h chart, where the EMA7 and EMA20 both sit at $1.09 and the EMA50 at $1.10, with the 1h RSI printing a weak 39.04. The 4h chart tells a more cautious story: RSI at 42.63 and MACD lines converging just below zero, indicating the mild recovery attempt from recent lows has stalled. On the daily timeframe, price has been compressing in a narrow band around the $1.08–$1.15 zone, with the EMA50 at $1.15 acting as overhead resistance and the EMA200 at $1.46 a distant structural barrier; the daily RSI at 44.33 offers no clear directional edge. Binance’s $800,000 XRP airdrop campaign may generate short-term sentiment tailwinds, but technically XRP needs a decisive close above $1.12 to shift near-term bias from neutral-to-bearish toward neutral-to-bullish.
BNB (BNB)
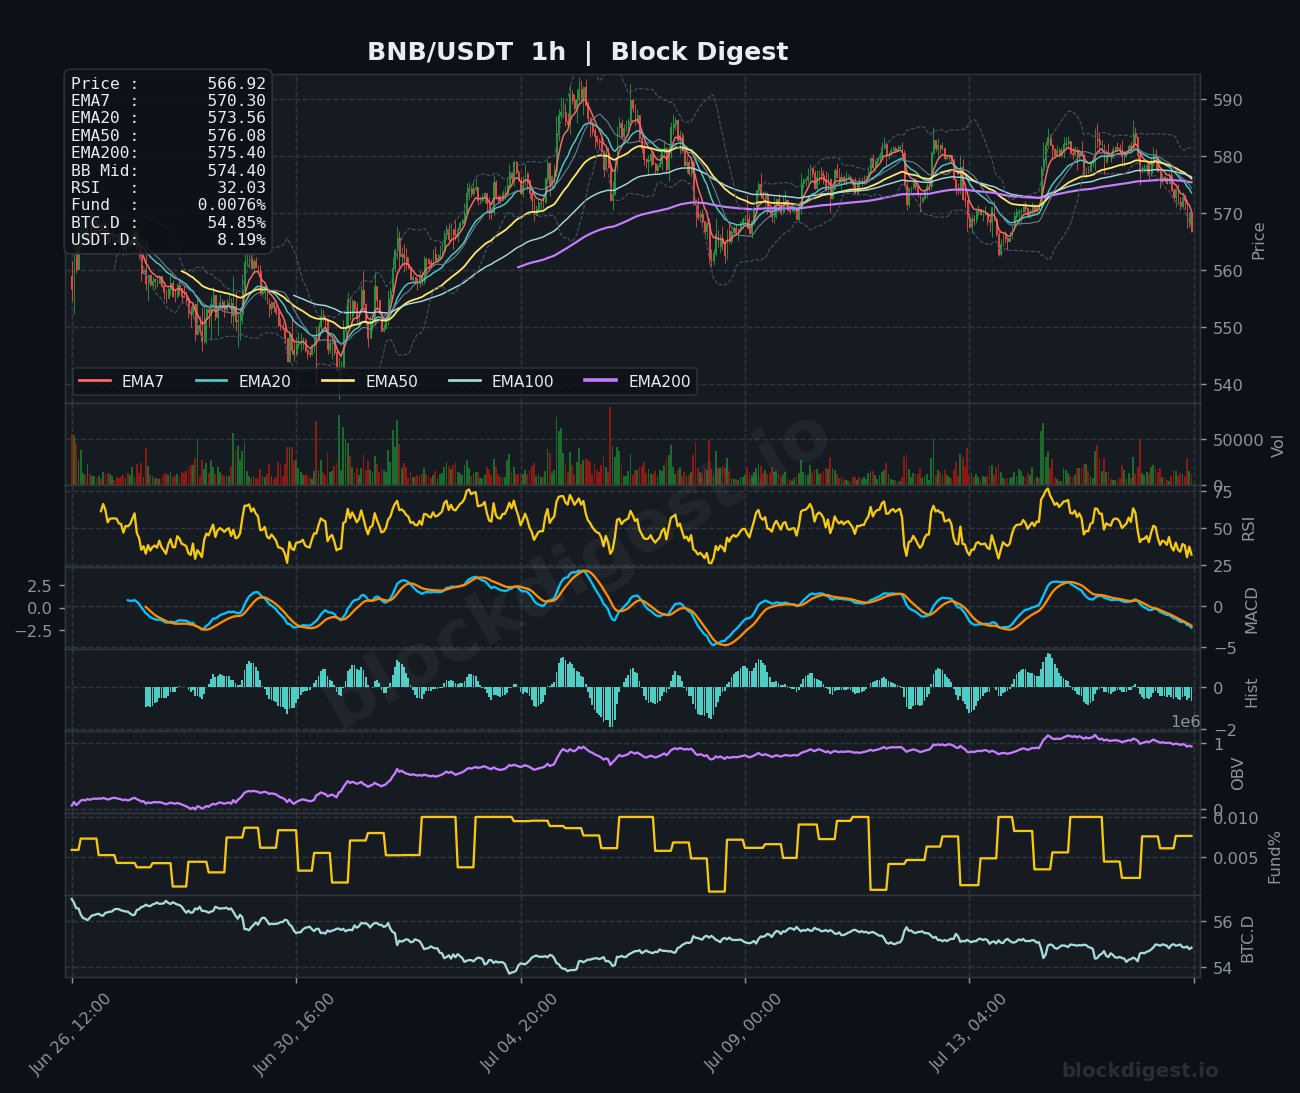
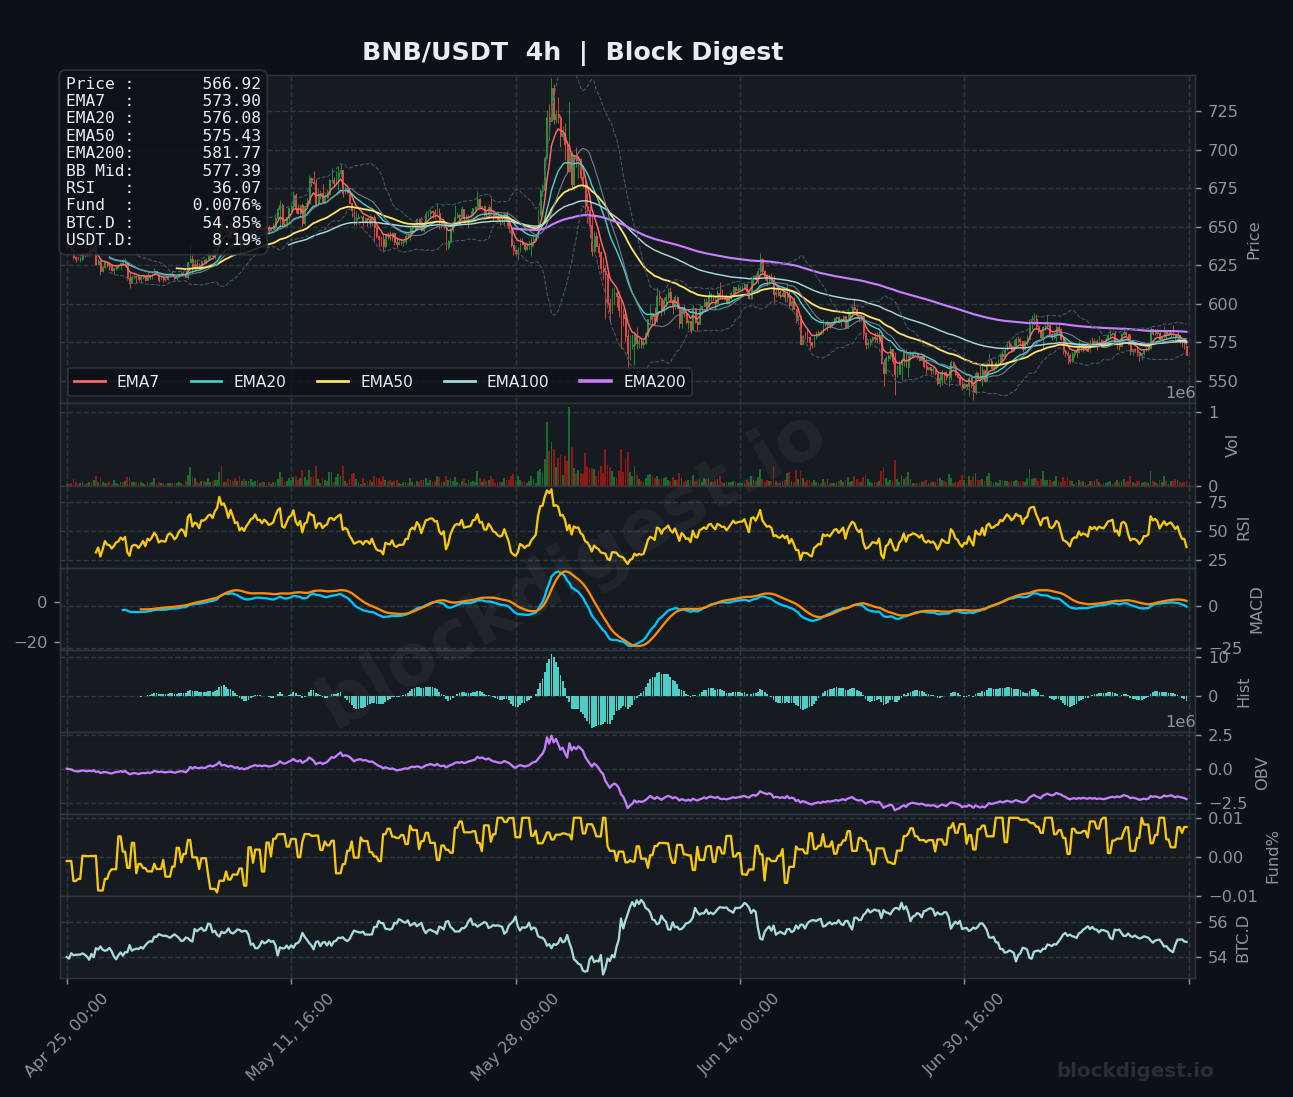
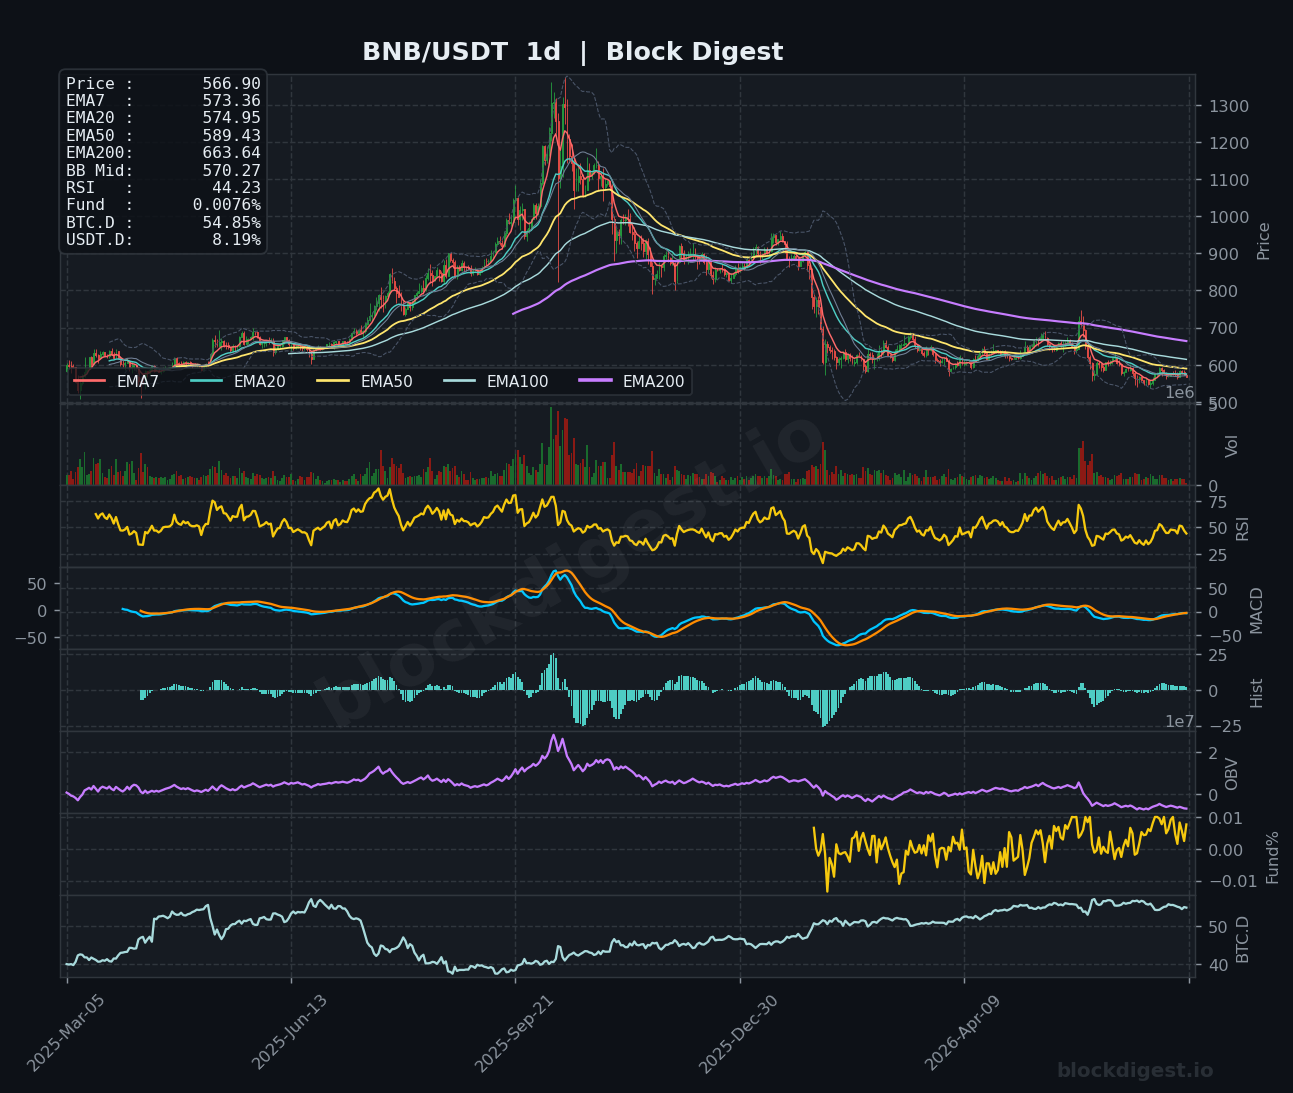
BNB is trading at $566.90–$566.92, pressured beneath the EMA7 ($570.30), EMA20 ($573.56), EMA50 ($576.08), and EMA200 ($575.40) on the 1h chart, with a deeply oversold 1h RSI of 32.03 suggesting a short-term bounce is possible but not yet confirmed. The 4h RSI of 36.07 and a MACD that has rolled over from recent highs indicate the intermediate trend is weakening after a failed attempt to hold above $580. On the daily chart, BNB’s RSI at 44.23 is mid-range and non-committal, while the daily EMA200 at $663.64 remains a towering obstacle, and the OBV trend on the daily has been steadily declining since the prior cycle highs, reflecting persistent net selling. Key support to watch is the $555–$560 zone; a breakdown there could accelerate losses toward the $530–$540 band.
Dogecoin (DOGE)
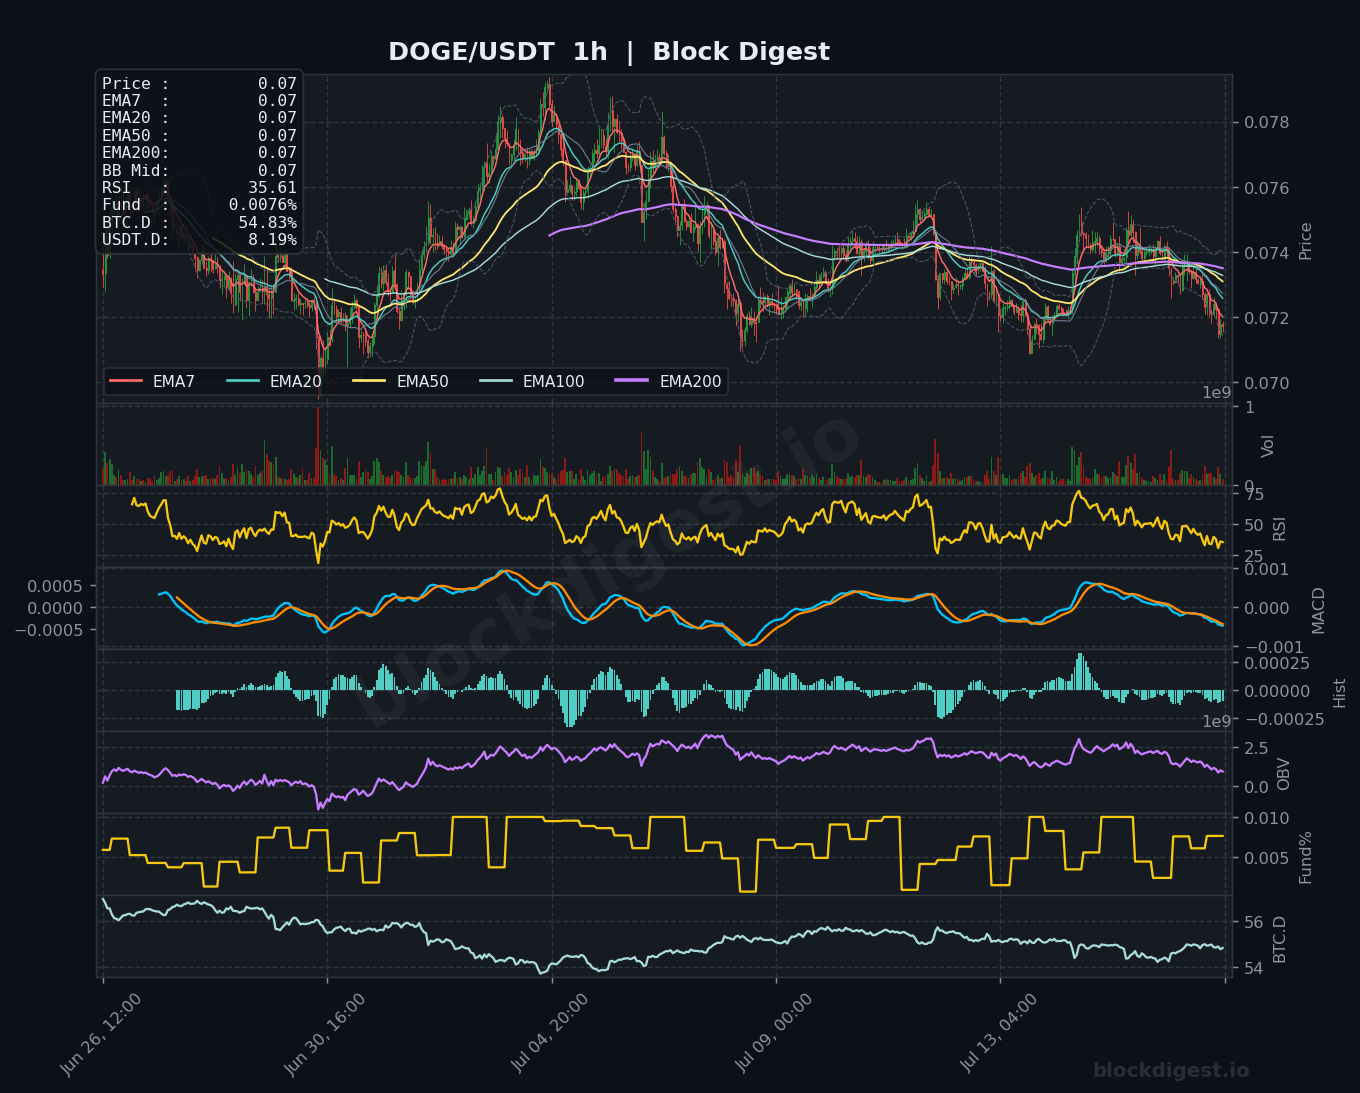
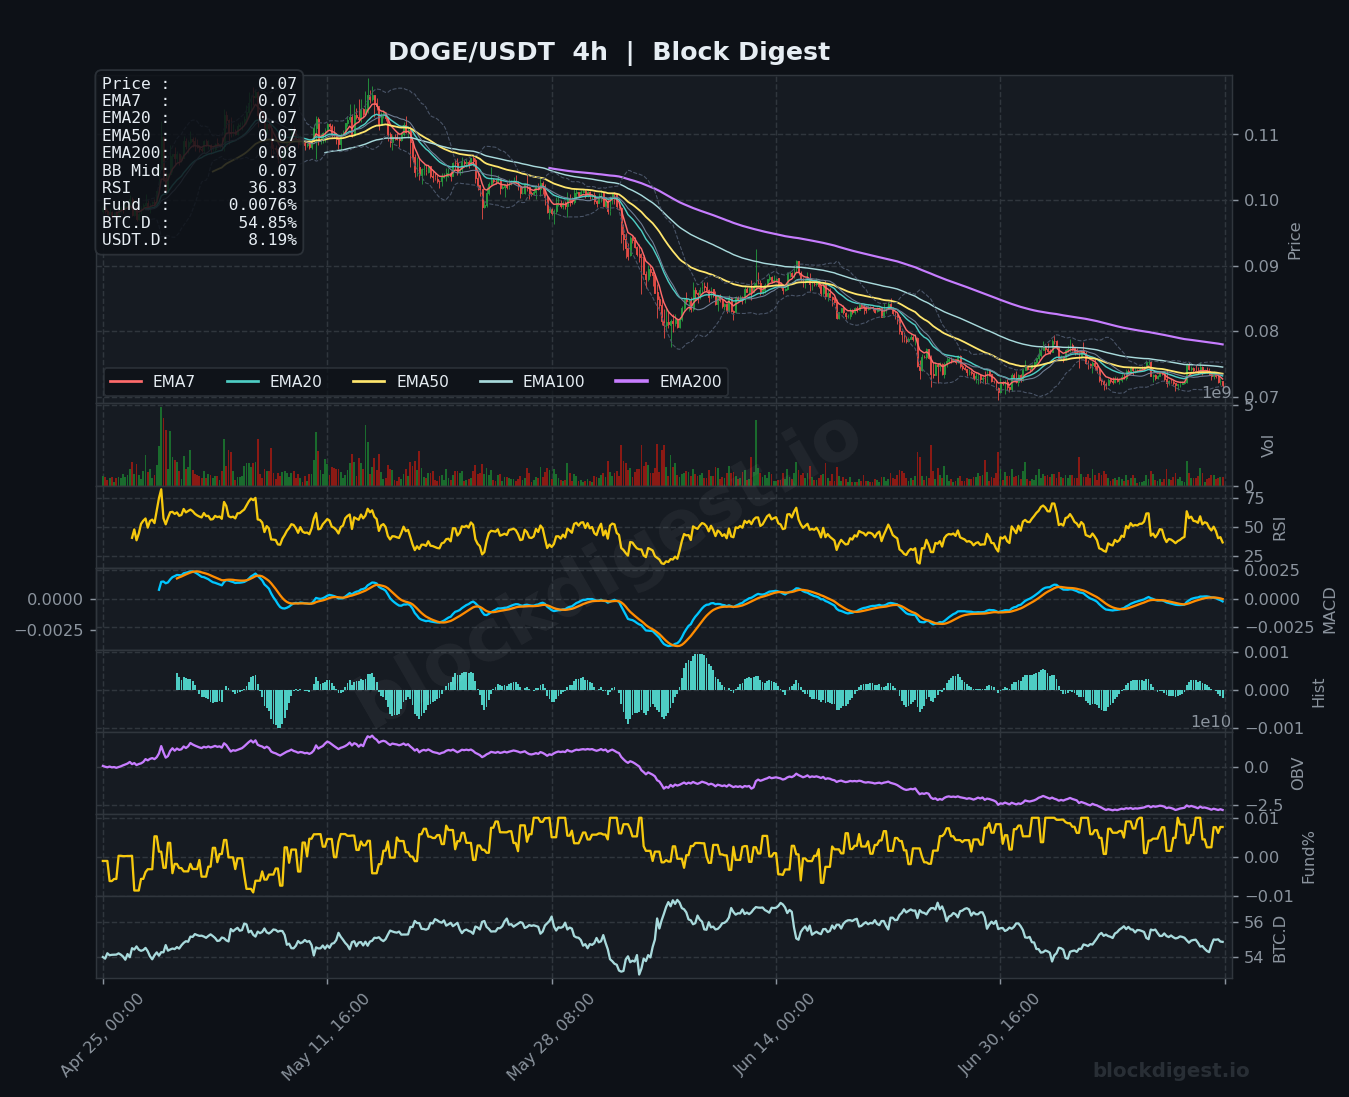
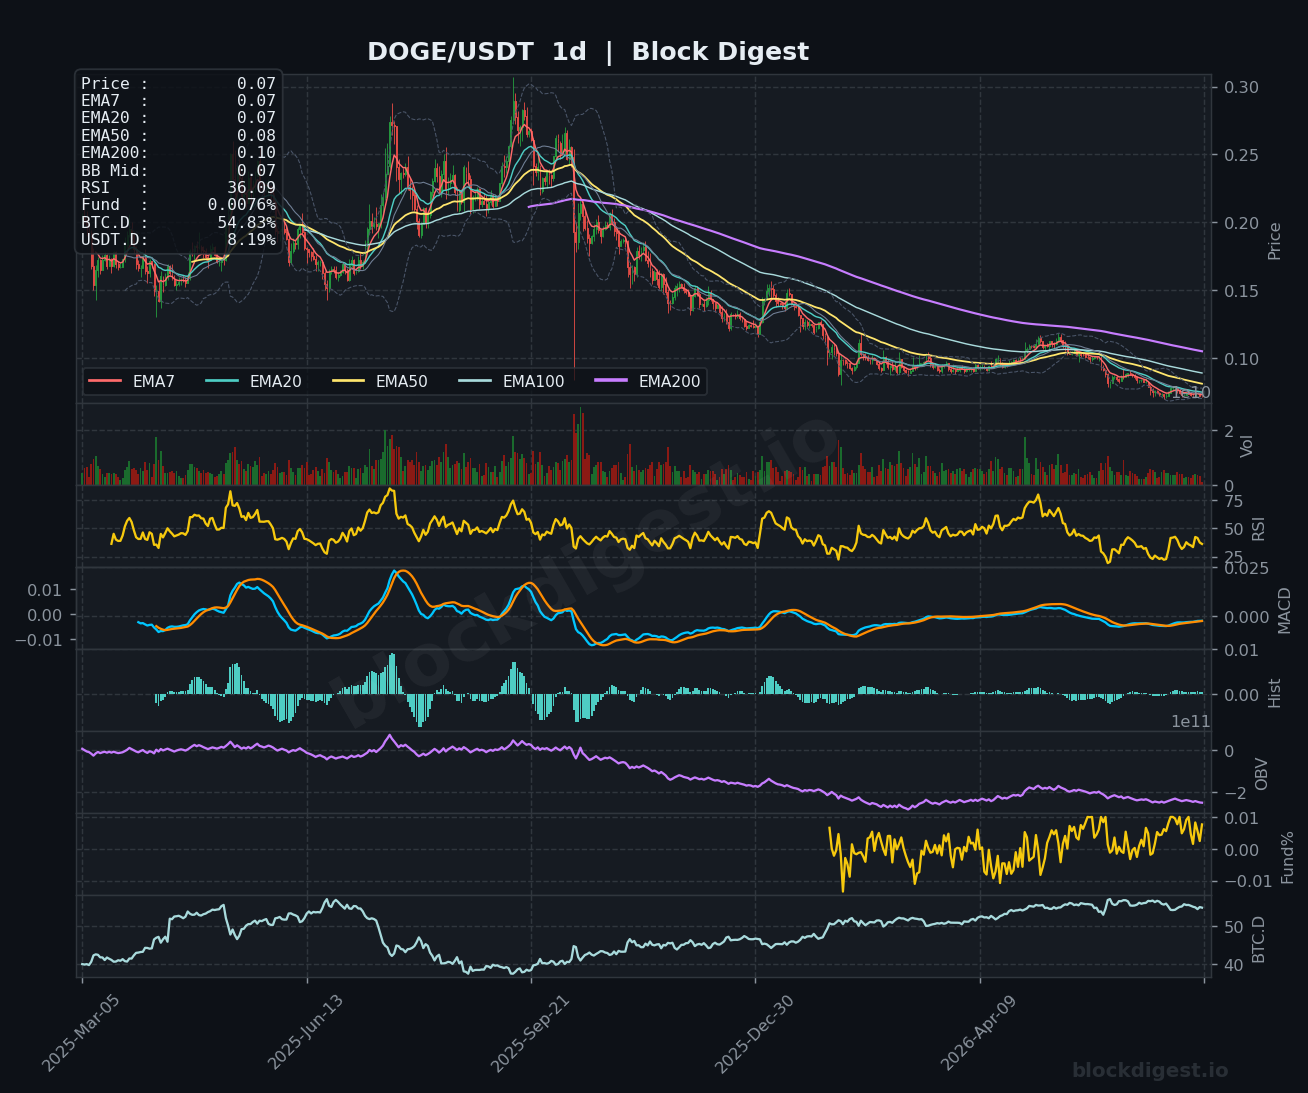
DOGE is trading at $0.0732, with the 1h chart showing all EMAs compressed tightly around the $0.07 level and an RSI of 35.61 indicating soft but not extreme selling momentum. The 4h chart is the most concerning for bulls: RSI at 36.83 and price in a persistent downtrend from the $0.11 highs, with all major EMAs — including the EMA200 at $0.08 — stacked above current price acting as resistance. On the daily timeframe, RSI at 36.09 places DOGE in technically weak territory, with the OBV in a clear declining trend and price hugging the lower Bollinger Band, suggesting distribution rather than accumulation. The $0.070 level is an immediate line in the sand; a break below opens the door to $0.065, while a recovery above $0.075 would be the first meaningful sign of stabilization.
Litecoin (LTC)
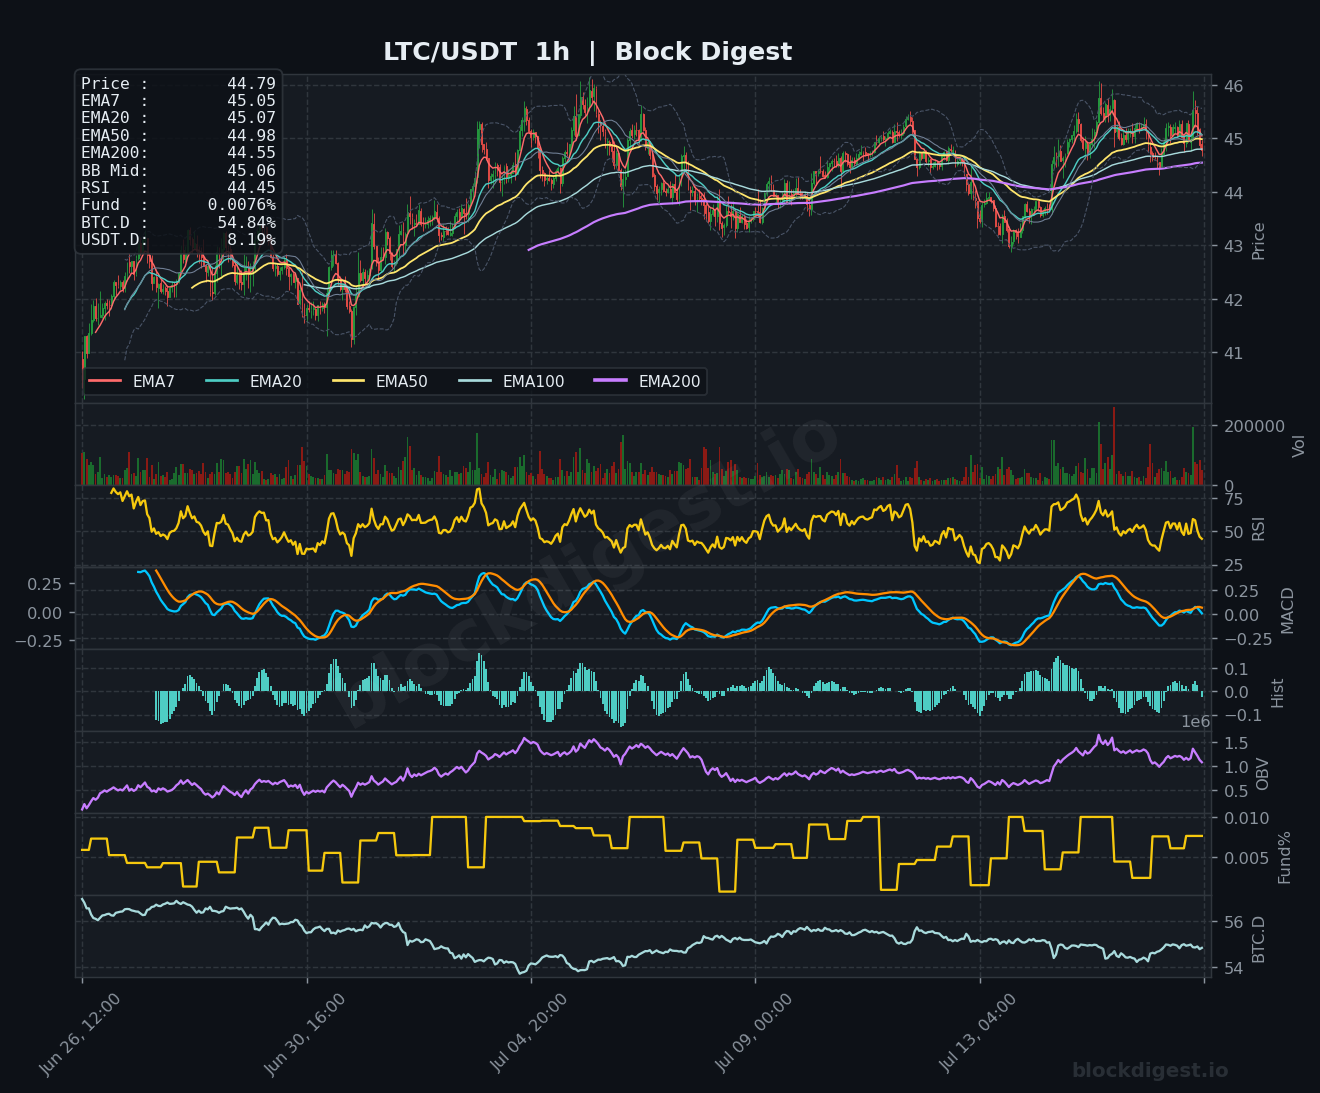
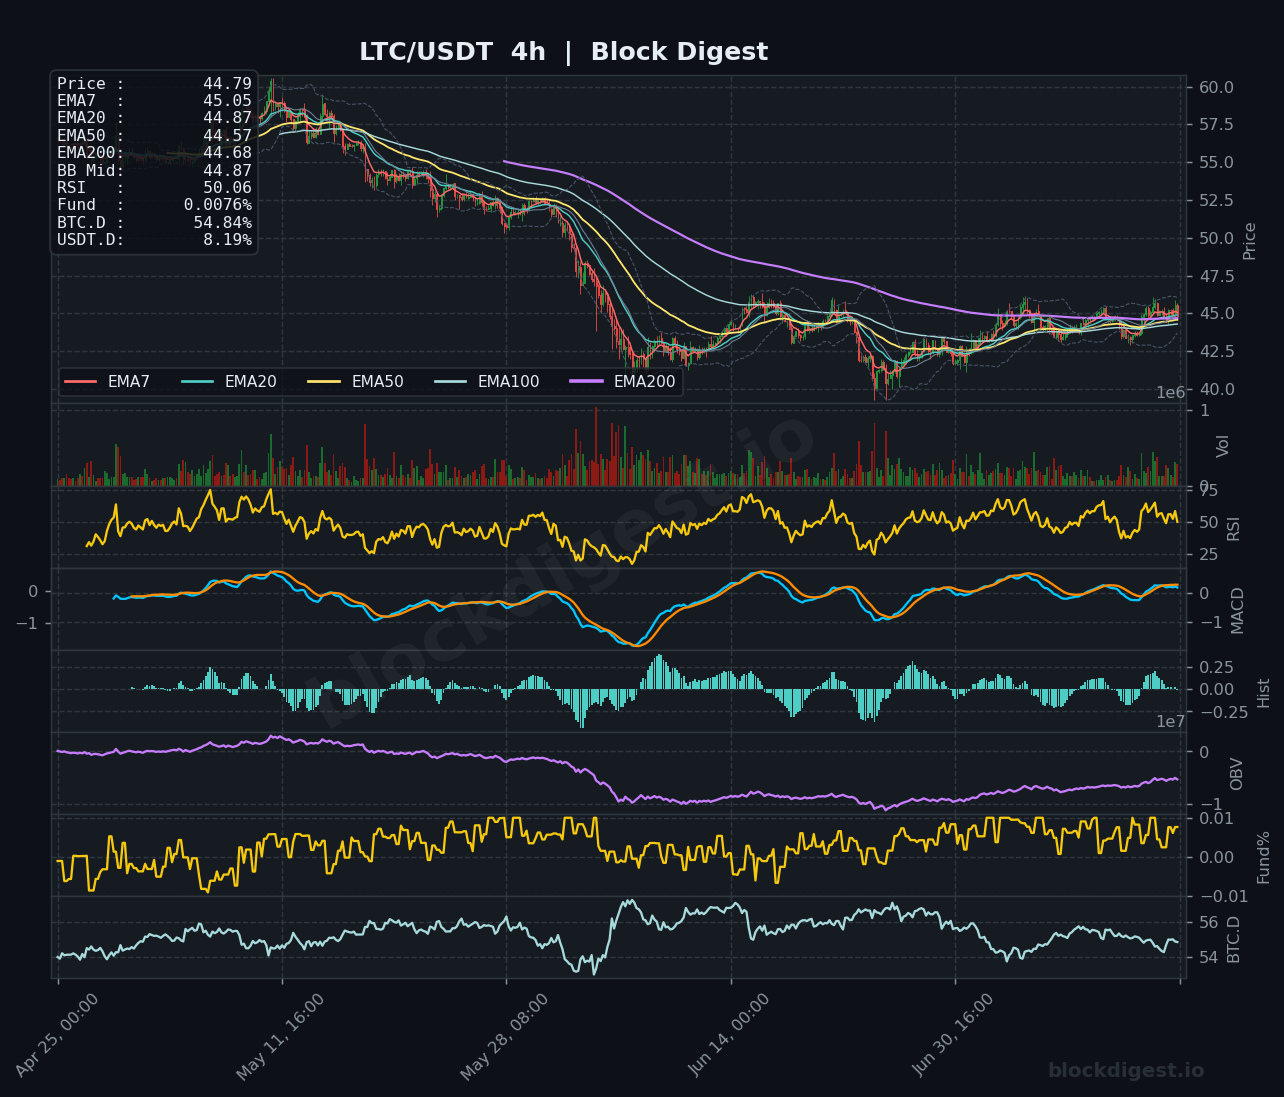
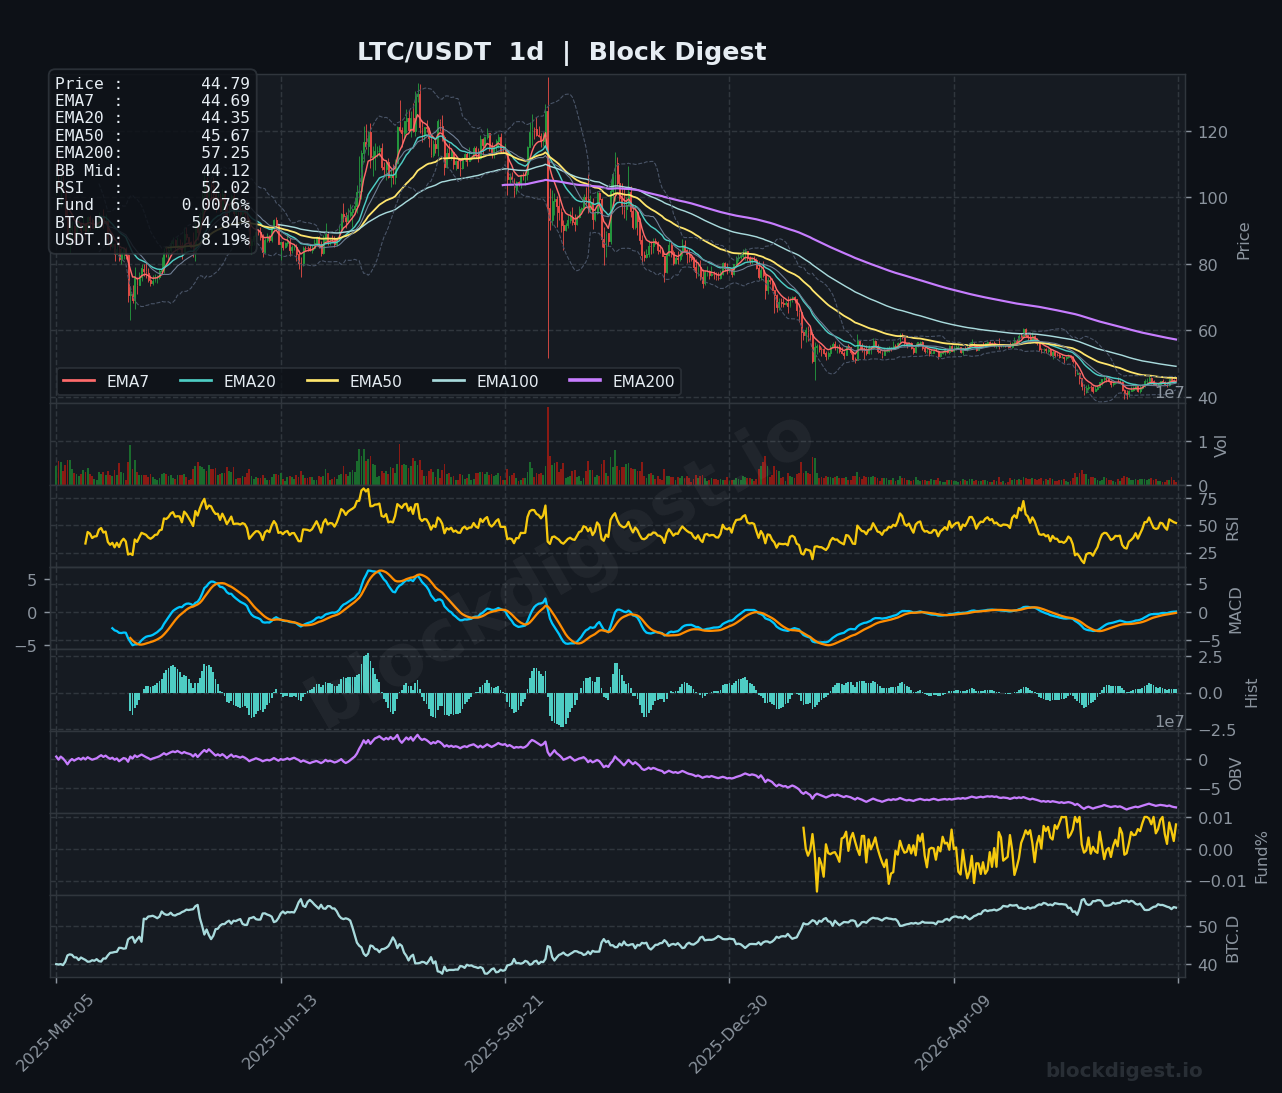
LTC at $44.79 is one of the more structurally interesting setups in today’s review, as the 4h RSI has recovered to a neutral 50.06 and price has been consolidating in a tightening range around the $43–$46 zone after a sharp multi-month decline from above $57. On the 1h chart, the EMAs are tightly clustered between $44.55 and $45.07, with RSI at 44.45 — reflecting indecision rather than directional conviction — while the MACD has recently turned slightly negative after a brief bullish cross. The daily chart shows the RSI stabilizing around 52, a modest positive signal relative to peers, with the EMA7 ($44.69) having recently crossed above the EMA20 ($44.35), though the EMA50 at $45.67 and the distant EMA200 at $57.25 remain formidable barriers. LTC’s relatively neutral daily RSI and the tightening consolidation pattern give it a marginally less bearish near-term outlook compared to most altcoins in this review, with $43 as the key support and $46–$47 as the immediate upside target.
TRON (TRX)
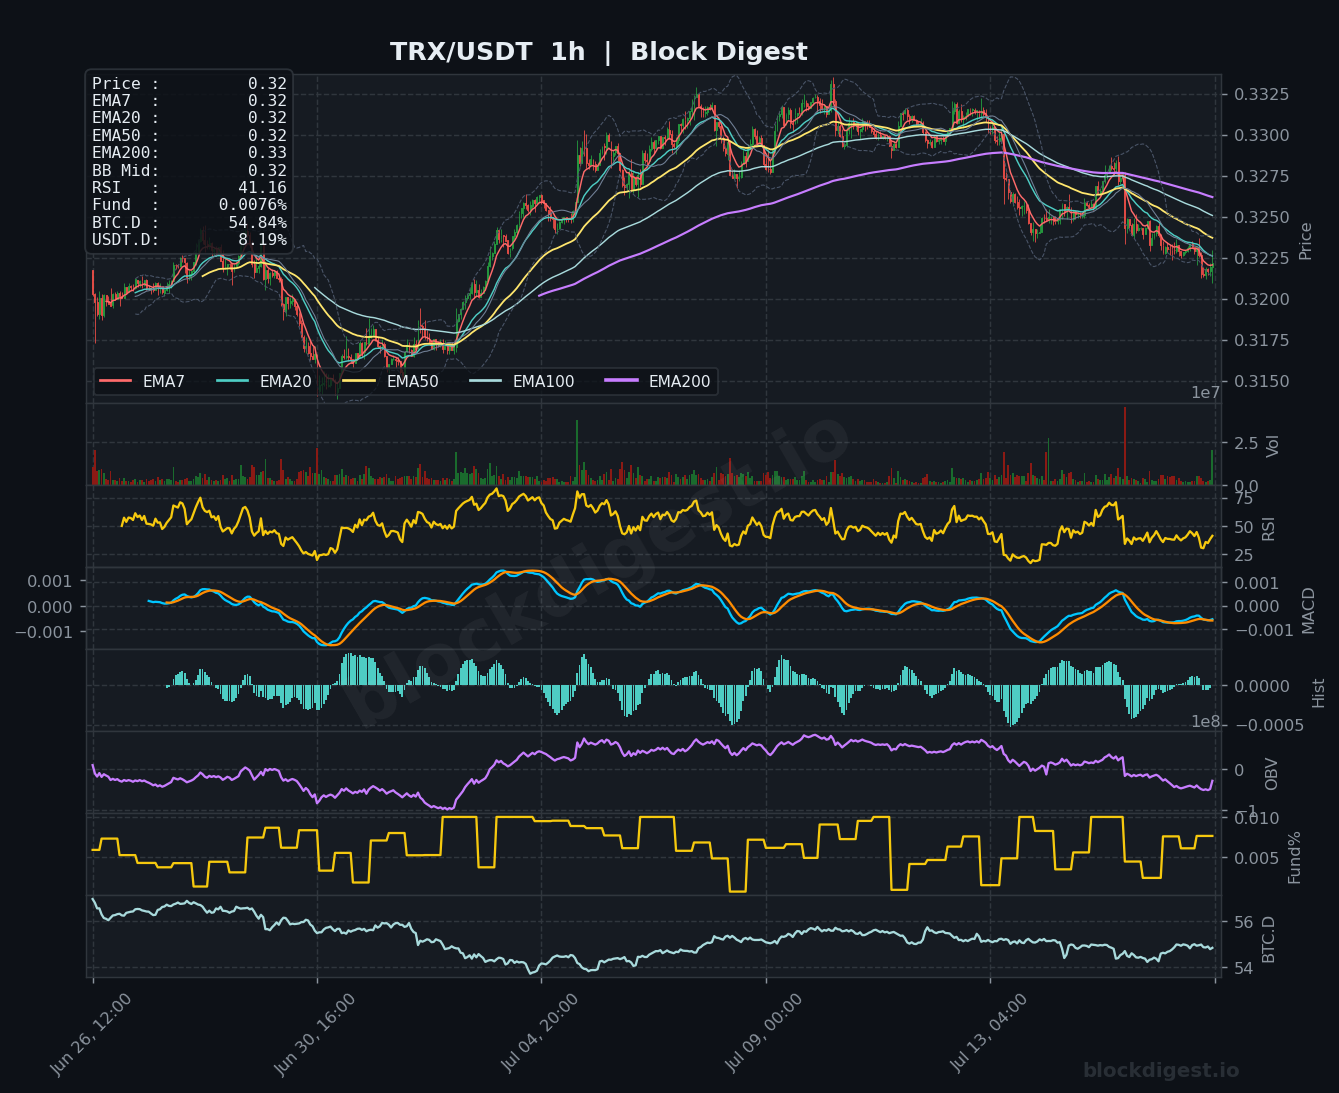
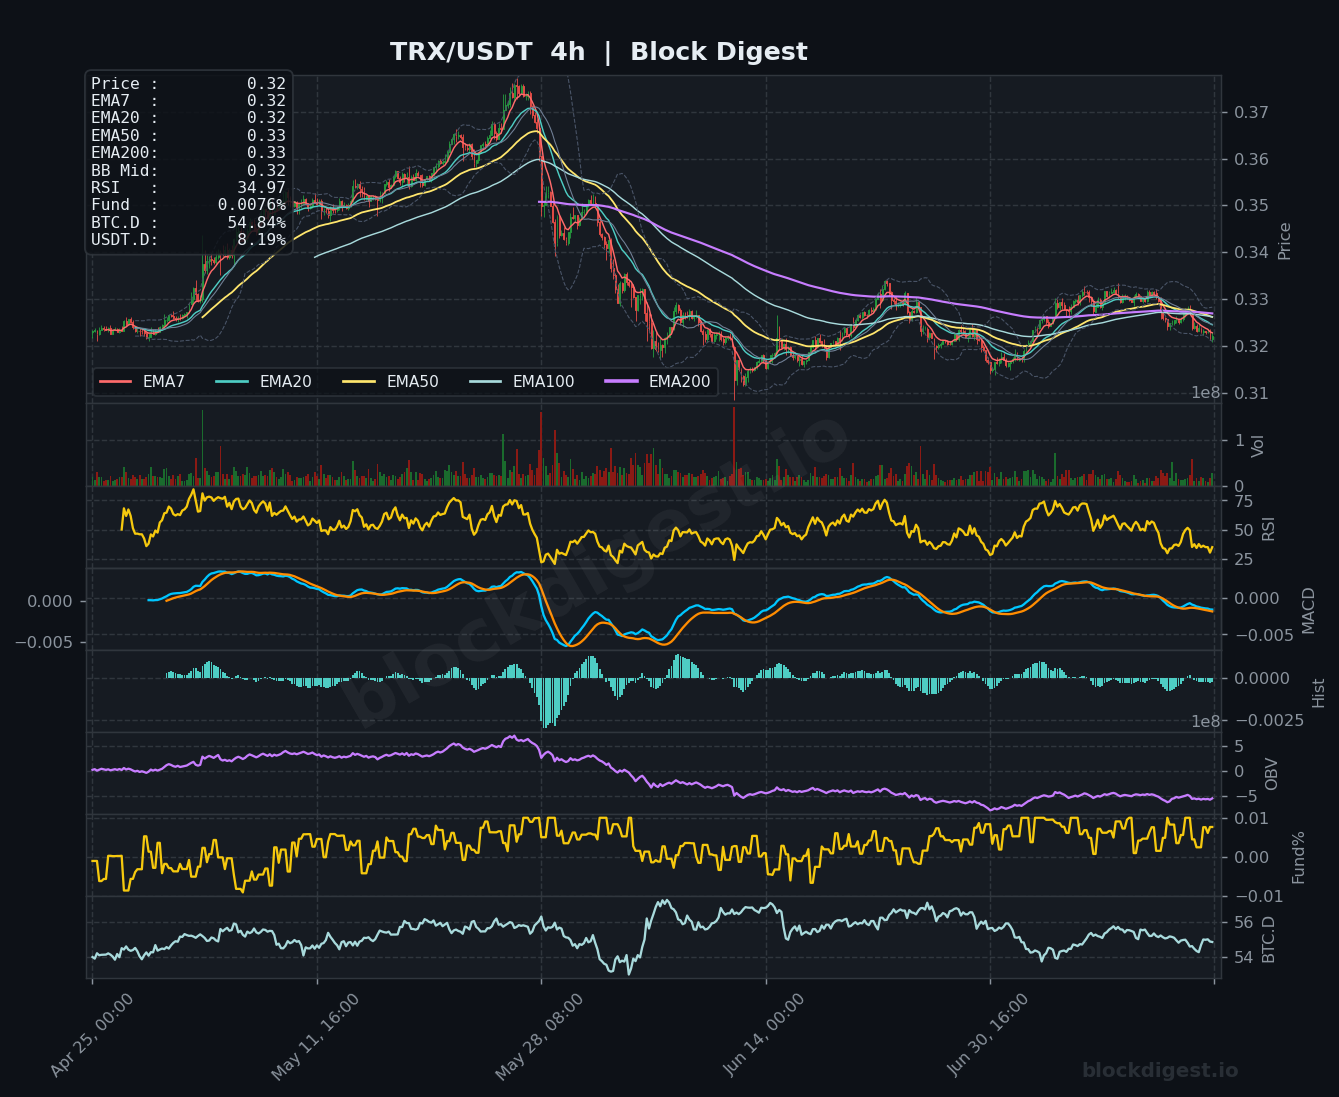
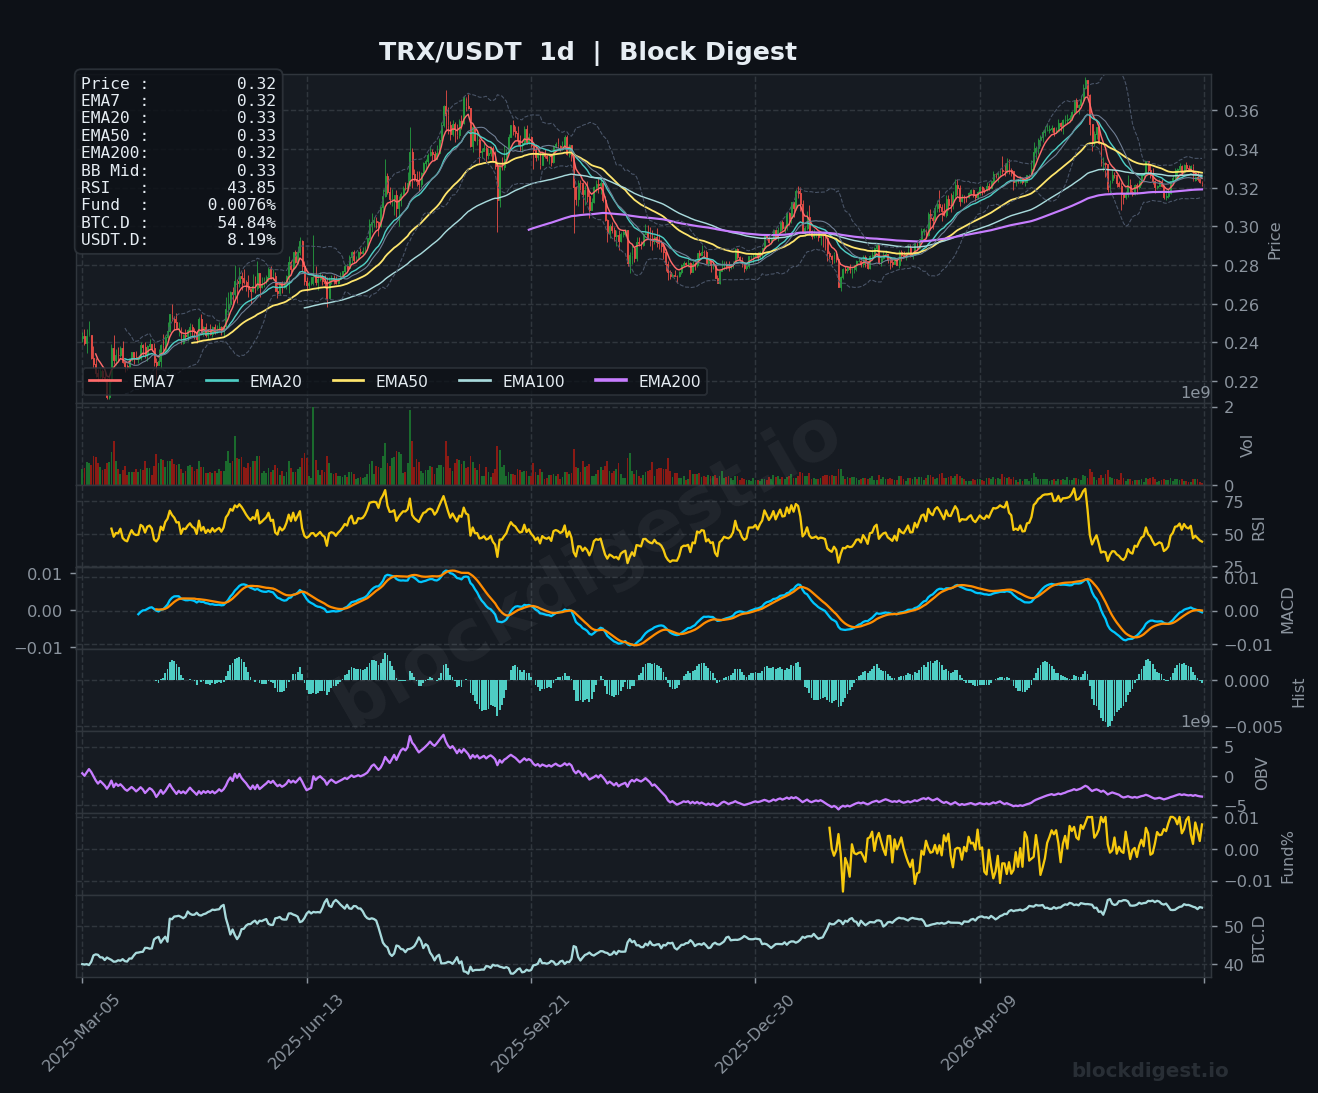
TRX is trading at $0.32, having pulled back from recent highs near $0.333 as all short-term EMAs on the 1h chart converge tightly at $0.32, with the 1h RSI at 41.16 indicating softening momentum. The 4h chart shows RSI at 34.97 — notably weak — and the MACD has crossed into negative territory, confirming that the intermediate downswing that began from the $0.37 peak has not yet found a firm base. On the daily chart, TRX presents a somewhat unique picture relative to other altcoins: the EMA200 at $0.32 is very close to current price, meaning TRX is testing a significant long-term dynamic support level, and the daily RSI at 43.85 is approaching but not yet at oversold conditions. A daily close below $0.318 would constitute a meaningful technical breakdown, while the $0.325–$0.330 zone is the immediate resistance cluster bulls need to reclaim.
Altcoin Outlook
The overall altcoin market setup as of July 17, 2026 is predominantly bearish-to-neutral, with most major altcoins trading beneath their key moving average clusters on both short and intermediate timeframes and RSI readings broadly in the 35–46 range — weak enough to suppress rallies but not yet uniformly oversold in a way that historically precedes sharp relief bounces. Litecoin presents the most constructive technical setup of the group, with a neutral daily RSI and price stabilizing after a prolonged downtrend, while DOGE and TRX carry the weakest near-term structure given ongoing EMA resistance and declining OBV trends. For the altcoin space to mount a meaningful recovery, a sustained drop in BTC dominance from its current 54.84% level and a reversal in USDT.D would be prerequisite conditions to watch, alongside a reclaim of key resistance clusters — approximately $76.50 for SOL, $1.12 for XRP, $580 for BNB, and $0.075 for DOGE — on meaningful volume.
Disclaimer: This analysis is for informational purposes only and does not constitute financial advice. Cryptocurrency markets are highly volatile and unpredictable. All trading decisions should be made based on your own research and risk tolerance. Block Digest is not responsible for any financial losses incurred as a result of acting on this content.