ETH Daily Analysis — May 03, 2026
ETH Daily Analysis – May 03, 2026
Market Overview
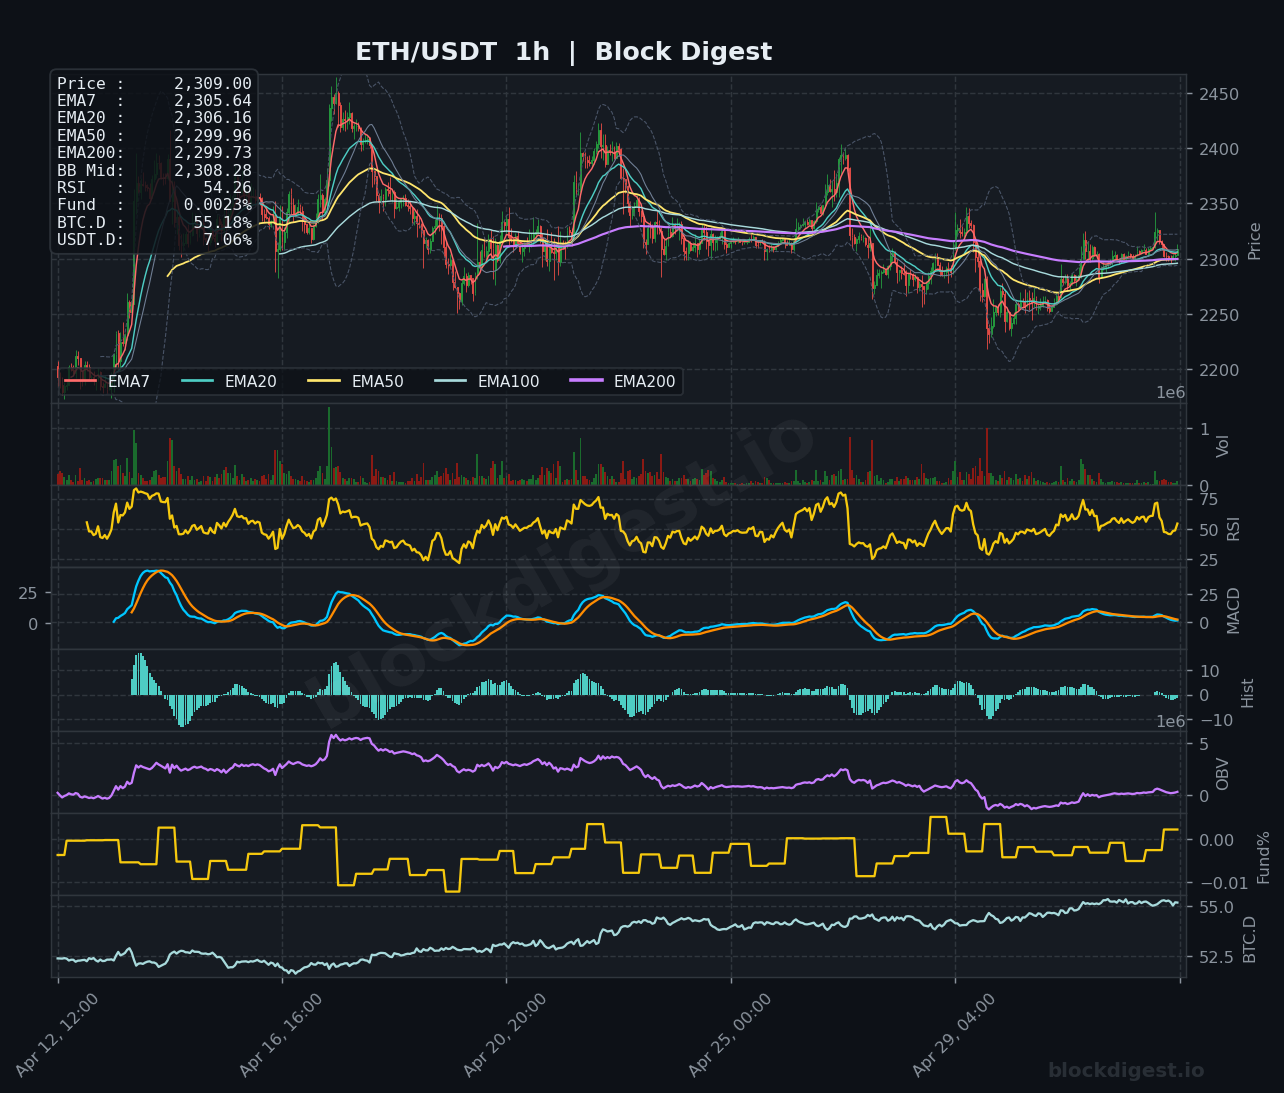
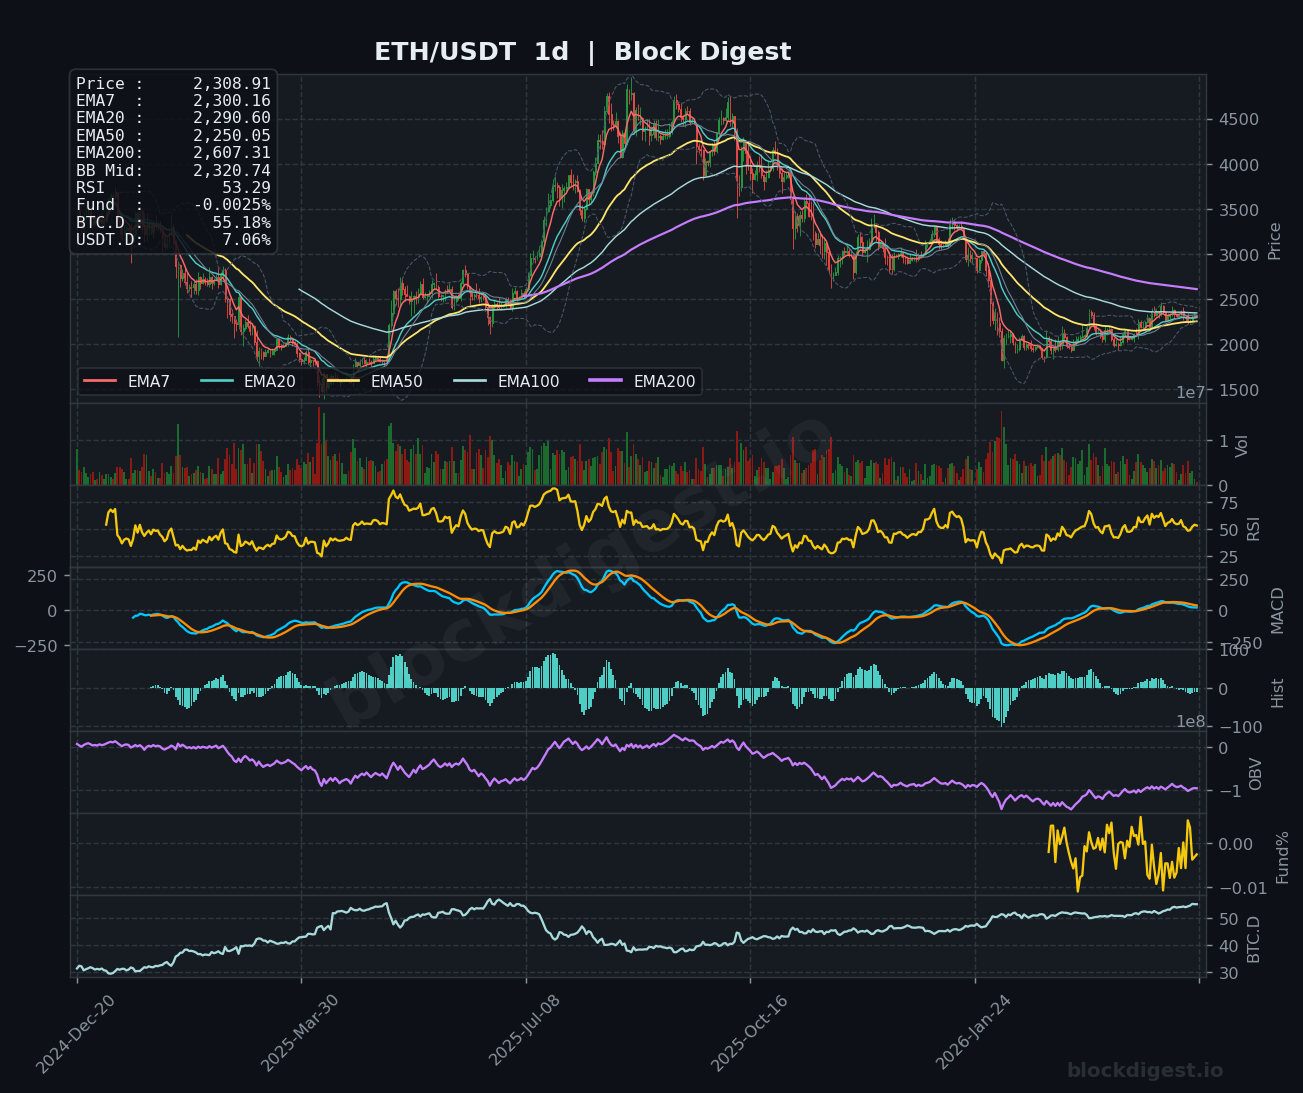
ETH is currently trading at $2,309.00, positioned in a compressed range just above the key EMA cluster on the 1-hour timeframe. Price sits marginally above the EMA7 ($2,305.64) and EMA20 ($2,306.16), suggesting short-term consolidation after recent volatility. On the daily chart, ETH remains below all major EMAs with price at $2,308.91 versus EMA50 at $2,250.05, indicating ongoing resistance from higher timeframe moving averages. The Bollinger Band middle ($2,308.28 on 1h) aligns almost perfectly with current price, signaling neutral volatility conditions and potential for a directional break in either direction.
Multi-Timeframe Confluence
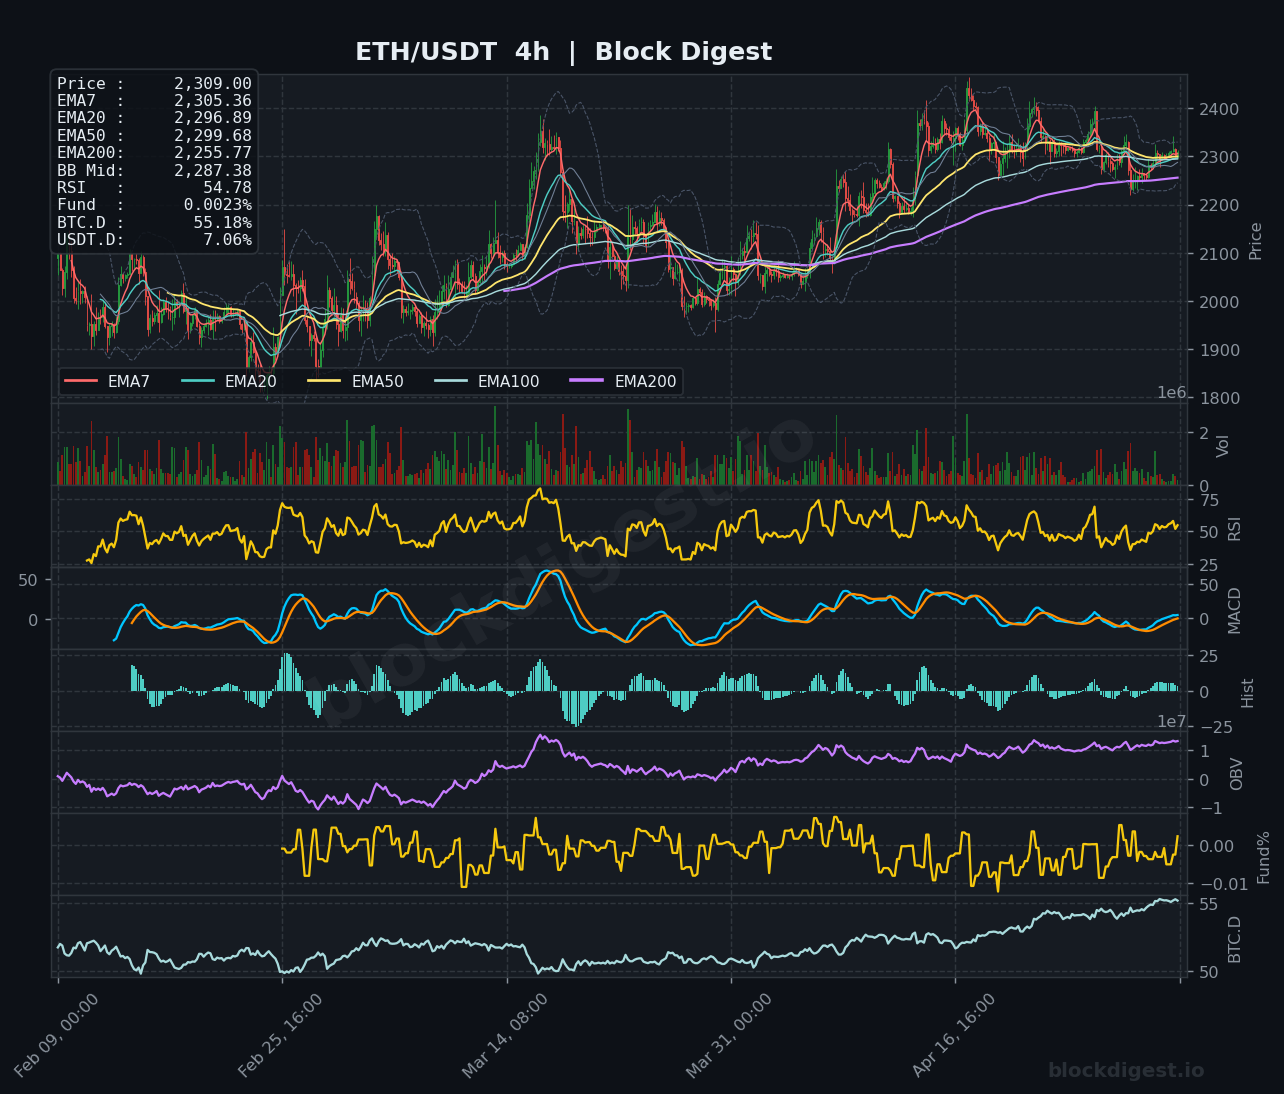
The timeframes present a mixed picture with conflicting signals across different horizons. The 1-hour chart shows price hovering near short-term EMAs with neutral momentum, while the 4-hour timeframe displays price at $2,309.00 positioned above EMA7 ($2,305.36) and near EMA20 ($2,296.89), suggesting short-term bullish structure. However, the daily chart reveals a more concerning picture with price trading below the EMA20 ($2,290.60) and significantly beneath the EMA50 ($2,250.05), indicating persistent downtrend pressure on higher timeframes. Key confluence zones emerge around $2,300-$2,310 where multiple timeframe EMAs converge, creating a critical pivot zone that could determine near-term direction.
Key Levels to Watch
Resistance:
- $2,350-$2,360: Previous rejection zone visible on the 1-hour chart and corresponds to local swing highs; reclaiming this area would signal short-term momentum shift
- $2,400-$2,420: Major resistance cluster on the 4-hour timeframe where price faced multiple rejections; aligns with daily EMA structure and represents a significant supply zone
- $2,500: Psychological resistance and daily chart rejection area that would require substantial volume and momentum to breach
Support:
- $2,287-$2,295: Immediate support zone corresponding to the 4h Bollinger Band middle ($2,287.38) and EMA20 confluence area
- $2,250: Critical support aligned with the daily EMA50 ($2,250.05); a breakdown below this level would signal continuation of the broader downtrend
- $2,200-$2,220: Major support zone visible on multiple timeframes where price found buying interest during recent declines; represents a key demand area
Momentum & On-Chain Signals
RSI readings across timeframes indicate neutral to slightly oversold conditions, with the 1h RSI at 54.26, 4h RSI at 54.78, and daily RSI at 53.29—all hovering near the midpoint and suggesting neither overbought nor oversold extremes. The MACD on the 1-hour and 4-hour charts shows flattening with histogram bars near zero, indicating diminishing momentum and potential indecision. The daily MACD remains in neutral territory with both lines converging, suggesting a lack of strong directional conviction. OBV trends show gradual accumulation on lower timeframes but remain relatively flat on the daily chart, indicating neither strong distribution nor aggressive buying pressure. Funding rates at 0.0023% reflect neutral sentiment with no significant long or short bias from leveraged traders.
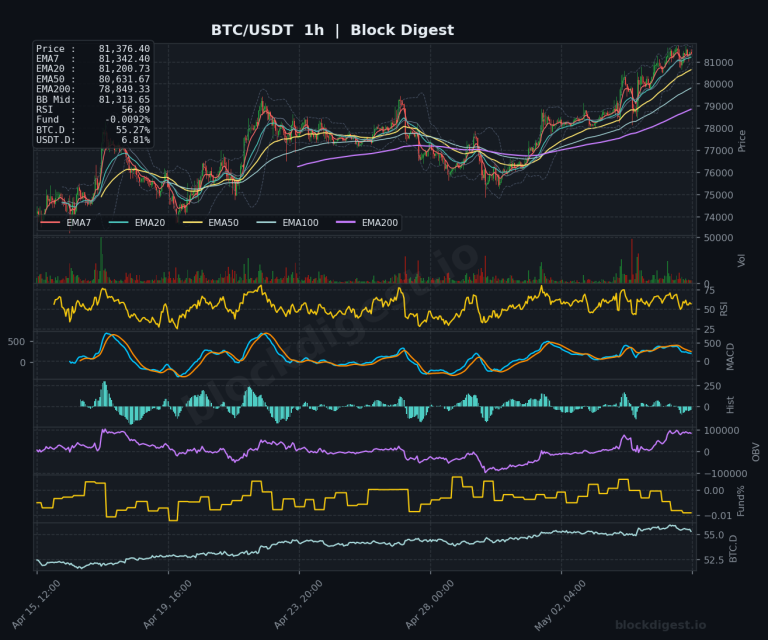
BTC Dominance & Market Sentiment
BTC.D currently stands at 55.18%, showing a slight upward trajectory that typically correlates with capital flowing toward Bitcoin and away from altcoins like ETH during risk-off periods. USDT.D at 7.06% remains elevated, suggesting defensive positioning within the crypto market as traders maintain higher stablecoin allocations. This combination of rising BTC dominance and elevated USDT dominance creates headwinds for ETH’s price action, as it indicates cautious market sentiment and reduced appetite for altcoin risk exposure.
Risk Scenarios
Bullish case: A confirmed break above $2,350 with sustained volume and RSI momentum pushing above 60 would validate short-term bullish reversal, targeting the $2,400-$2,420 resistance zone initially, with extension potential toward $2,500 if accompanied by declining BTC dominance and improving funding rates.
Bearish case: Failure to hold the $2,287-$2,295 support confluence and a definitive breakdown below $2,250 (daily EMA50) would confirm bearish continuation, opening downside targets toward $2,220 and potentially $2,150 if selling pressure accelerates with negative MACD crossovers on higher timeframes.
Outlook
ETH’s technical setup reflects a market in equilibrium at a critical decision point, with compressed volatility and converging EMAs suggesting an imminent directional move. The primary trigger to monitor over the next 24-48 hours is whether price can sustain above the $2,300 pivot zone and generate momentum toward $2,350, or conversely, whether rejection and breakdown below $2,287 initiates another leg lower. The conflicting signals between stabilizing short-term momentum and persistent daily downtrend pressure warrant cautious positioning. A breach of $2,350 with confirming volume would shift near-term bias bullish, while failure at current levels with breakdown below $2,287 would reinforce bearish control and likely trigger accelerated selling toward the $2,220-$2,250 support zone.
Disclaimer: This analysis is for informational purposes only and does not constitute financial advice. Cryptocurrency markets are highly volatile and unpredictable. All trading decisions should be made based on your own research and risk tolerance. Block Digest is not responsible for any financial losses incurred as a result of acting on this content.