
Market Overview
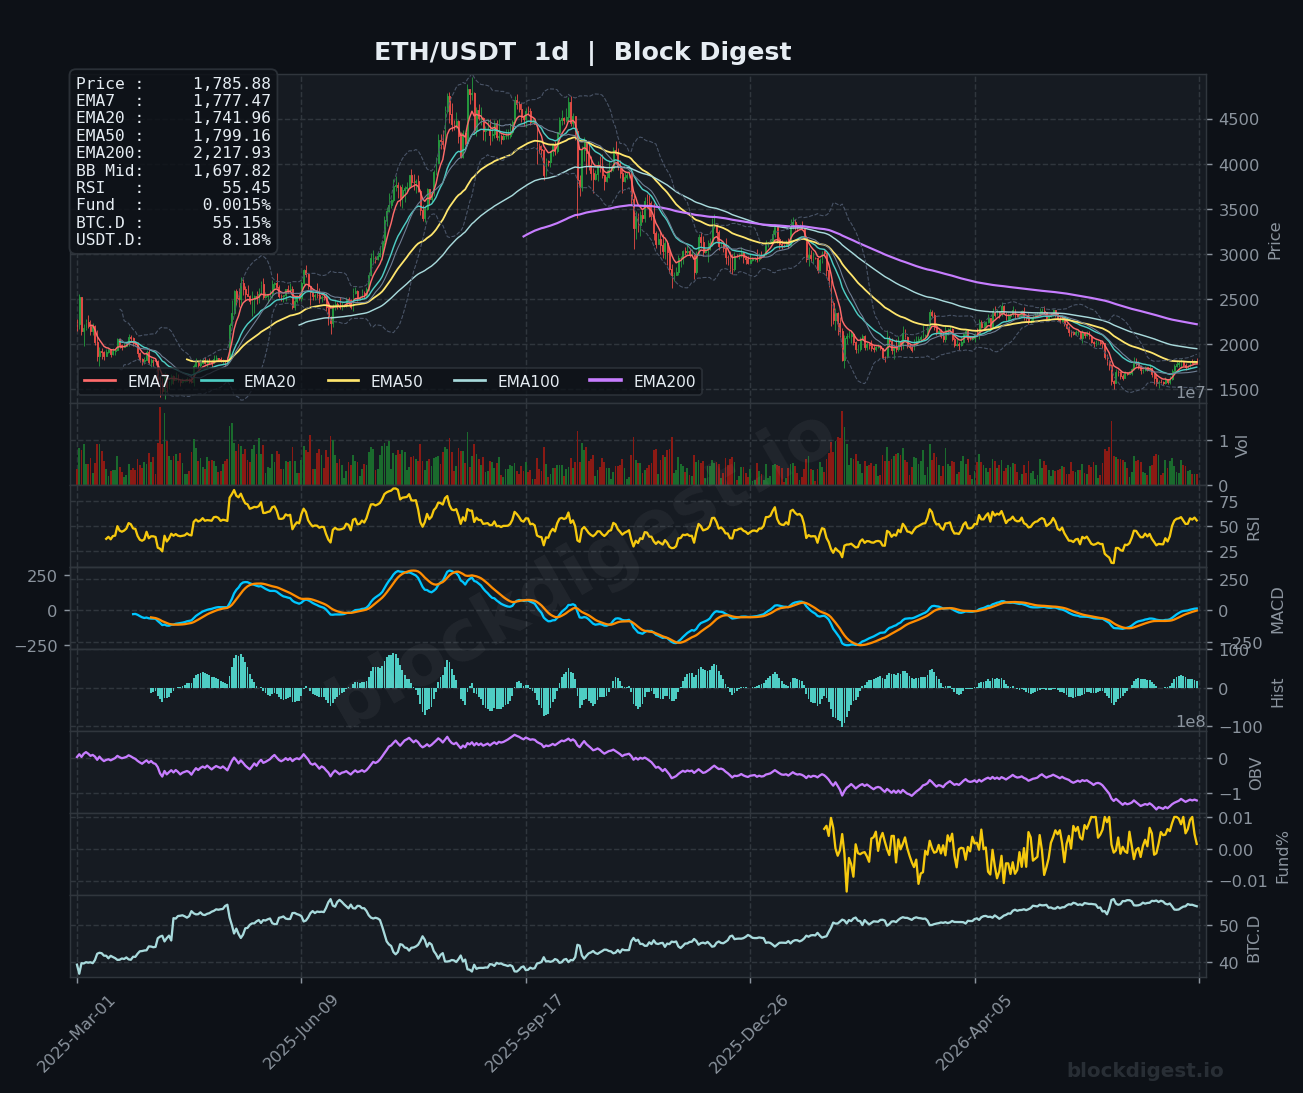
ETH/USDT is currently trading at $1,785.88, situated in a technically precarious position as it attempts to consolidate after a significant multi-month downtrend visible on the daily chart. Price is trading below the daily EMA200 ($2,217.93) and just beneath the EMA50 ($1,799.16), confirming that the broader macro structure remains bearish. On the daily Bollinger Bands, price is hovering near the midline at $1,697.82, having recently pushed above it — a marginal constructive signal, though far from decisive. The daily EMA7 ($1,777.47) has crossed above the EMA20 ($1,741.96), suggesting a nascent short-term recovery attempt within an otherwise downward-sloping macro trend.
Multi-Timeframe Confluence
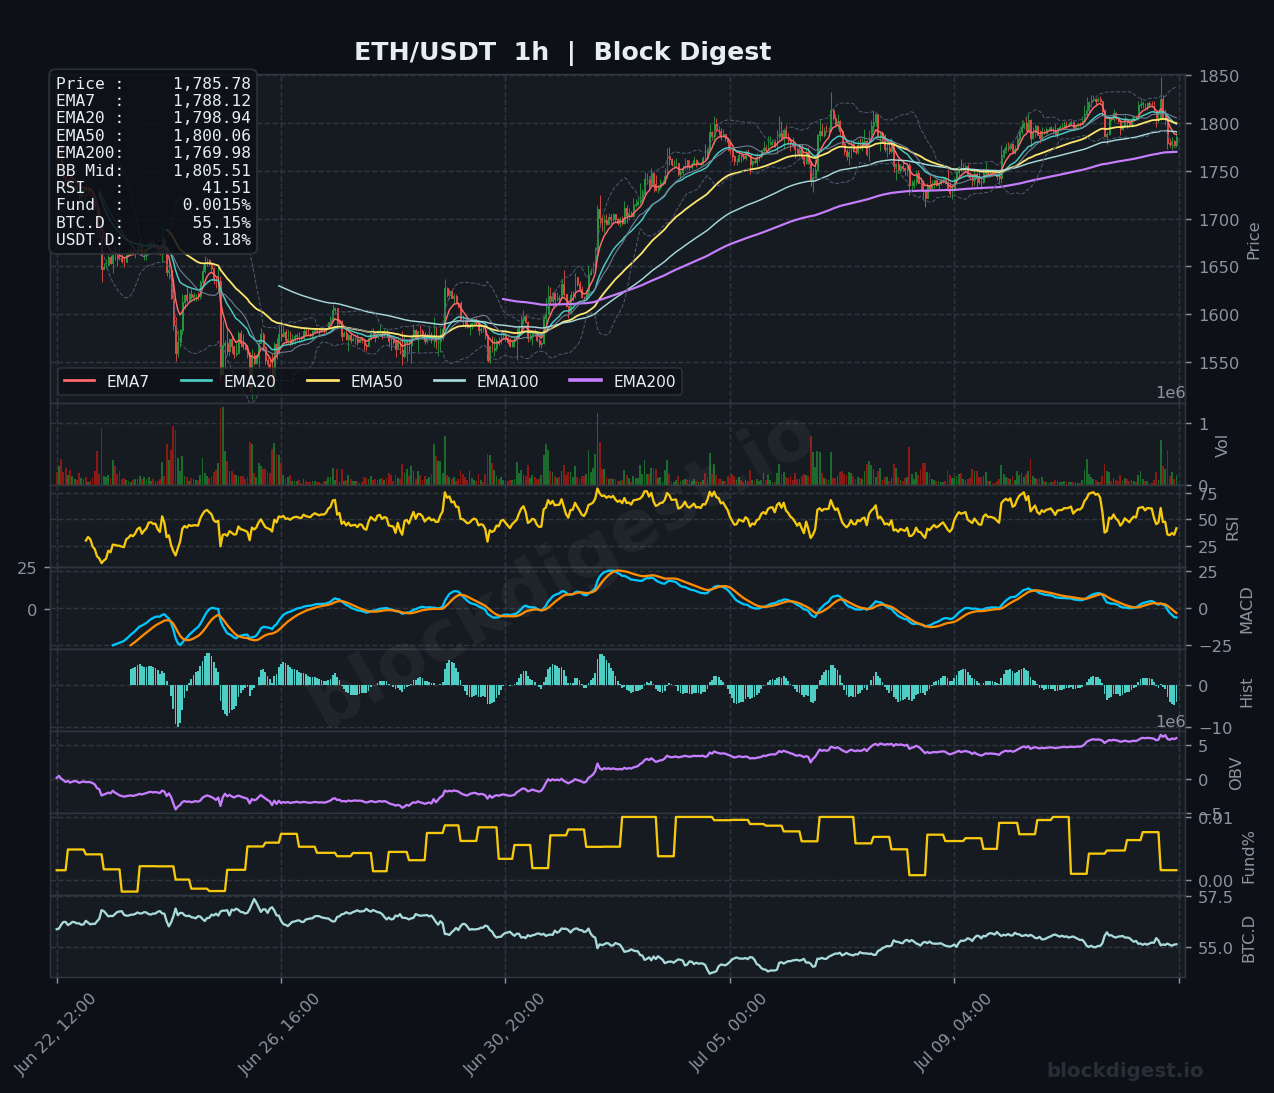
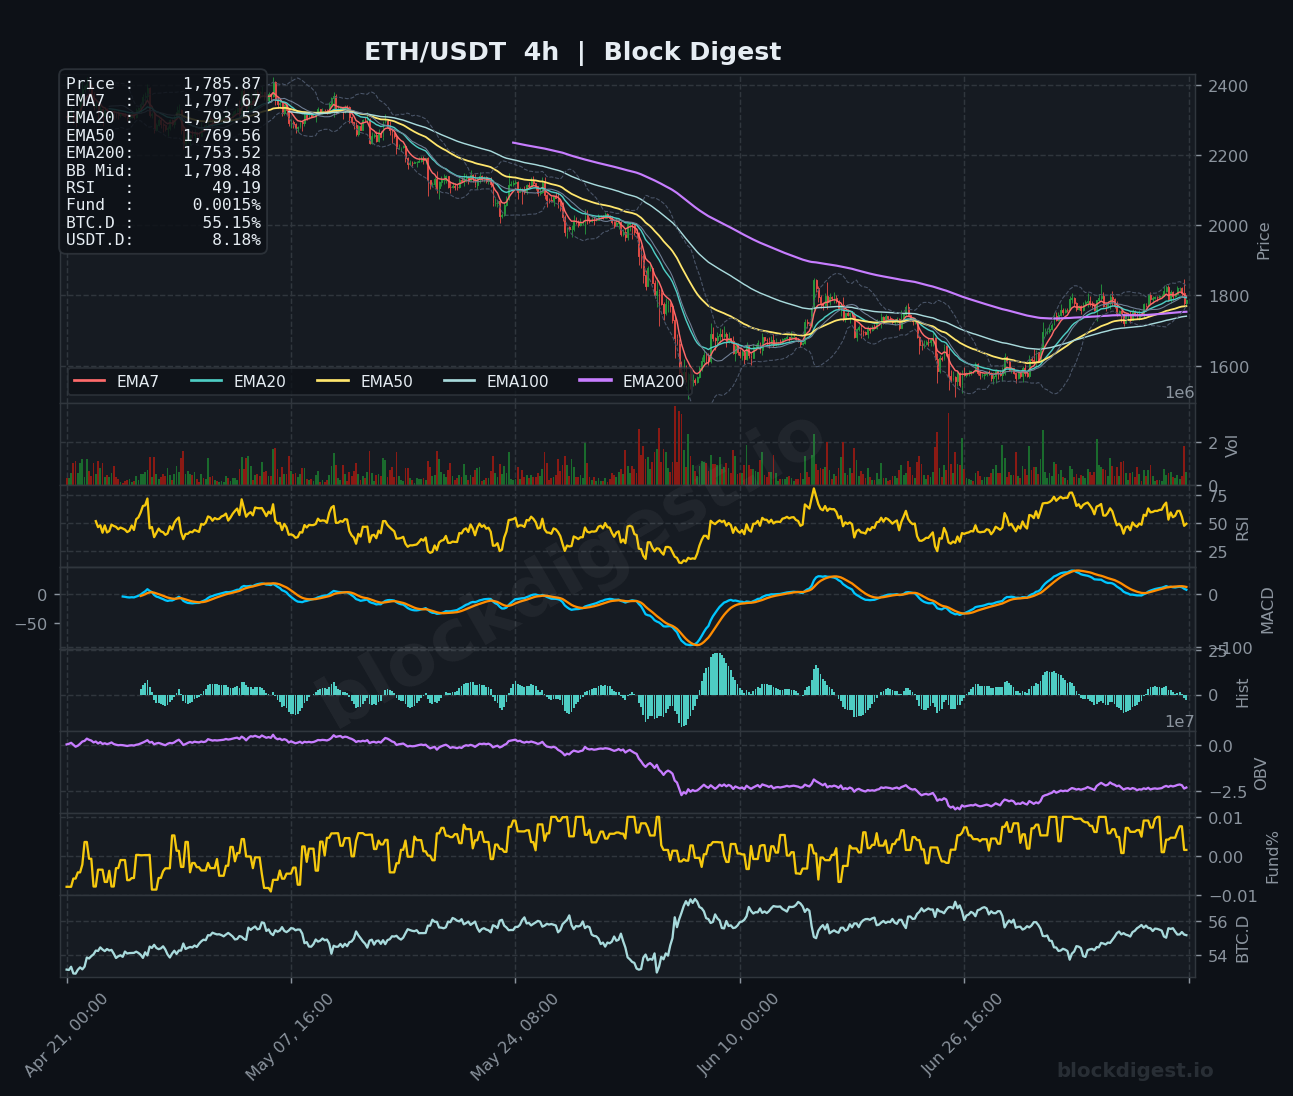
On the 4-hour chart, ETH staged a meaningful recovery from lows near $1,580, with the EMA50 ($1,769.56) and EMA200 ($1,753.52) now acting as layered support. The 4H EMA7 ($1,797.67) has crossed above EMA20 ($1,793.53), a modestly bullish near-term signal, though price is currently struggling to hold above these dynamic levels. On the 1-hour chart, price has slipped back below the EMA20 ($1,798.94) and EMA50 ($1,800.06), with the BB midline at $1,805.51 now acting as immediate overhead resistance — the short-term momentum is therefore slightly at odds with the tentative 4H recovery narrative. The $1,800 zone represents a critical confluence point across all three timeframes, where multiple EMAs cluster and price action is compressing.
Key Levels to Watch
- Resistance: $1,800–$1,805 — Dense EMA cluster on the 1H/4H timeframes and Bollinger Band midline; repeated rejections here cap near-term upside
- Resistance: $1,840–$1,850 — Recent swing high on the 1H chart and upper Bollinger Band boundary; a break above this level would shift short-term structure bullish
- Resistance: $1,920–$1,950 — Major structural resistance visible on the 4H chart coinciding with previous consolidation zone from early recovery
- Support: $1,769–$1,753 — 4H EMA50 and EMA200 confluence; loss of this zone would be a significant bearish development
- Support: $1,700–$1,710 — Daily Bollinger Band midline and prior congestion level; key macro floor on the daily structure
- Support: $1,580–$1,600 — Recent multi-month lows; a retest here would represent roughly 10% downside from current levels and signal trend continuation
Momentum & On-Chain Signals
The 1H RSI reads 41.51, hovering in bearish territory and confirming the short-term pullback momentum without yet reaching oversold conditions — suggesting room for further near-term softness. The 4H RSI at 49.19 is neutral, sitting just below the midpoint, while the daily RSI has recovered to 55.45, marking the strongest momentum reading across timeframes and underpinning the nascent daily recovery. The 4H MACD is converging near zero with a flattening histogram, indicating a loss of bearish momentum without yet generating a confirmed bullish crossover. On-chain OBV on the 1H chart continues its steady upward slope, suggesting underlying accumulation pressure, while the 4H OBV has stabilized after a sharp decline — a constructive divergence that modestly favors buyers. Funding rates remain extremely low at 0.0015%, reflecting a market that is neither overleveraged long nor under significant short pressure.
BTC Dominance & Market Sentiment
BTC dominance is holding at 55.15% — a historically elevated reading that continues to weigh on ETH and altcoins broadly, as capital gravitates toward Bitcoin’s relative safety amid ongoing geopolitical uncertainty and macro risk-off sentiment. USDT dominance at 8.18% suggests a meaningful portion of capital remains on the sidelines in stablecoins, which could convert to buying pressure if sentiment shifts but equally reflects persistent caution. For ETH specifically, a sustained decline in BTC.D below the 54% zone would likely be needed to catalyze a meaningful altcoin rotation that benefits ETH.
Risk Scenarios
- Bullish case: A decisive 4H close above $1,805 followed by a reclaim of $1,840 with expanding volume would confirm bullish momentum resumption, opening a path toward $1,920–$1,950. A favorable reception of the anticipated Clarity Act draft could provide the macro catalyst needed to lift risk assets and compress USDT.D.
- Bearish case: Failure to hold the $1,769–$1,753 support zone on the 4H would invalidate the recovery thesis and likely accelerate a retest of the $1,700 region; a confirmed daily close below $1,700 would expose the $1,580 lows and suggest the macro downtrend has resumed in earnest.
Outlook
ETH sits at a pivotal juncture, caught between a promising short-to-medium-term recovery on the 4H and a structurally bearish daily macro picture dominated by price trading well below the EMA200. The immediate 24–48 hour focus should be on whether price can reclaim and sustain the $1,800–$1,805 EMA cluster, as repeated failures here would likely invite renewed selling pressure. Geopolitical risk-off dynamics and elevated BTC dominance remain headwinds, though the neutrally priced funding rate and stabilizing OBV provide a degree of technical reassurance. The directional bias is cautiously neutral-to-bearish on the short term, with a watch for either a clean reclaim of $1,805 or a breakdown below $1,753 to define the next meaningful leg.
Disclaimer: This analysis is for informational purposes only and does not constitute financial advice. Cryptocurrency markets are highly volatile and unpredictable. All trading decisions should be made based on your own research and risk tolerance. Block Digest is not responsible for any financial losses incurred as a result of acting on this content.
Stay Ahead of the Market
Follow BlockDigest for crypto market intelligence, research and real-time updates.


