Weekly Market Overview
Ethereum closes the week of July 7–13, 2026 at approximately $1,785.55, staging a tentative recovery after briefly touching a 21-month low earlier in the week. Price surged from roughly $1,600 in late June to nearly $1,800, representing a short-squeeze-fueled bounce that aligns with Bitcoin’s broader 3%+ weekly gain. Despite the intraweek rally, the weekly candle remains structurally challenged — price is attempting to reclaim the $1,785–$1,800 zone but has yet to print a convincing close above it. The recovery appears primarily driven by oversold conditions and macro tailwinds from a soft U.S. jobs print rather than any fundamental shift in trend.
Higher Timeframe Structure
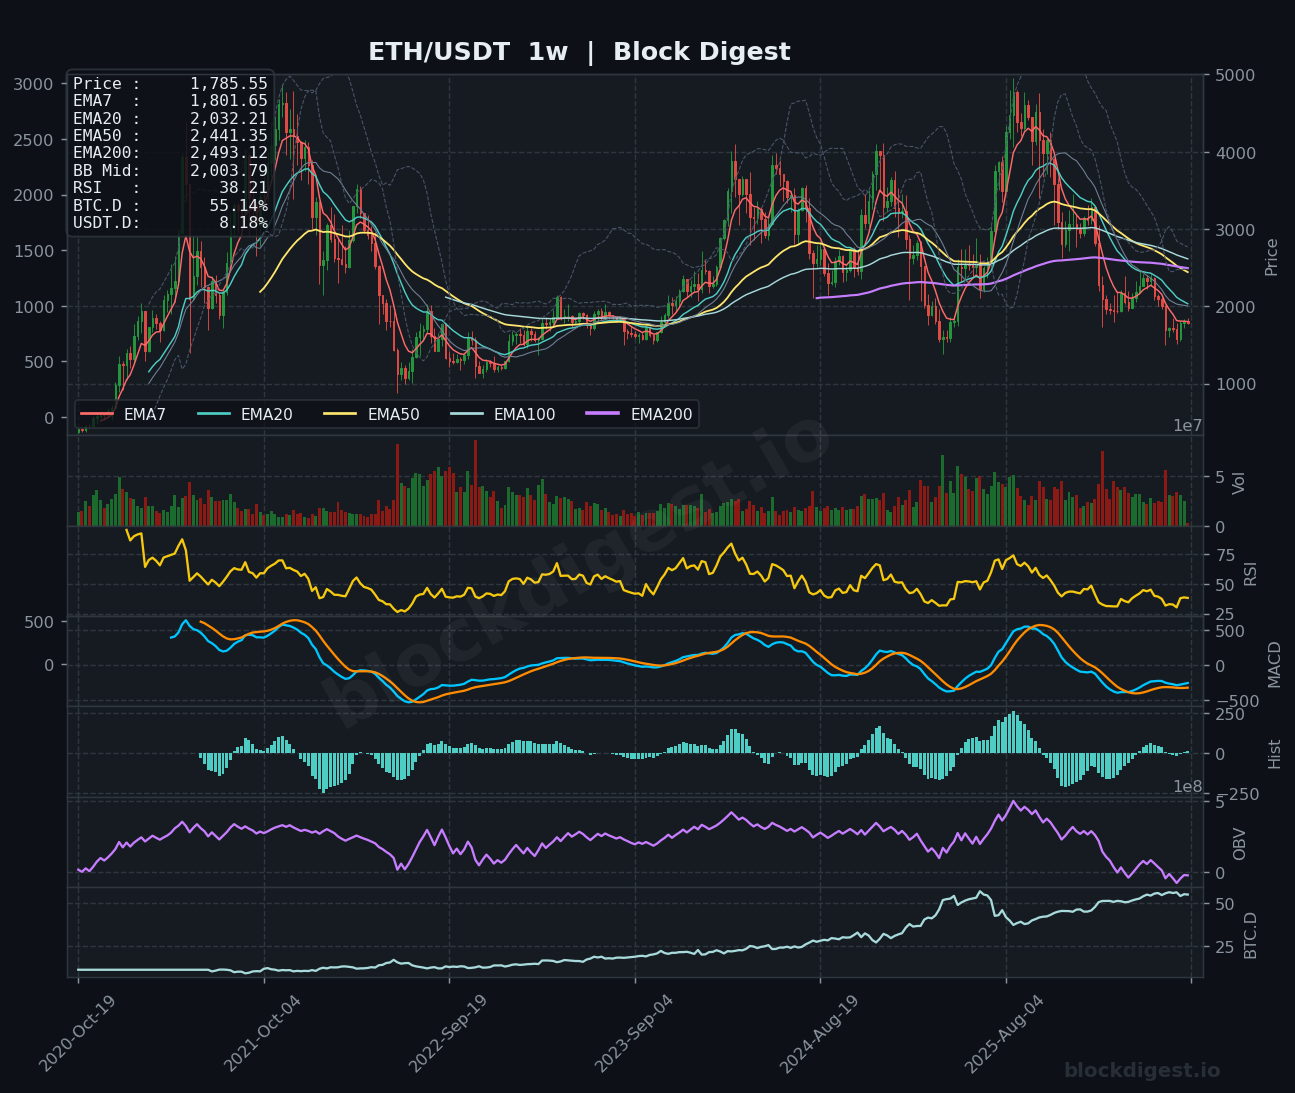
On the weekly chart, the EMA stack remains in a deeply bearish configuration: price trades well below the EMA20 ($2,032), EMA50 ($2,441), EMA100, and EMA200 ($2,493), with all longer-term averages sloping downward. The weekly EMA7 at $1,801 is the immediate overhead hurdle, and the Bollinger Band midline sits at $2,003 — both representing significant resistance clusters that need to be reclaimed before any macro trend reversal can be declared. Price is currently pressing against the lower Bollinger Band, a region historically associated with either elastic bounces or prolonged compression during severe bear cycles. The weekly structure unambiguously reflects a bear market continuation, with ETH having shed more than 60% from its 2024 highs near $4,000+.
Multi-Timeframe Confluence
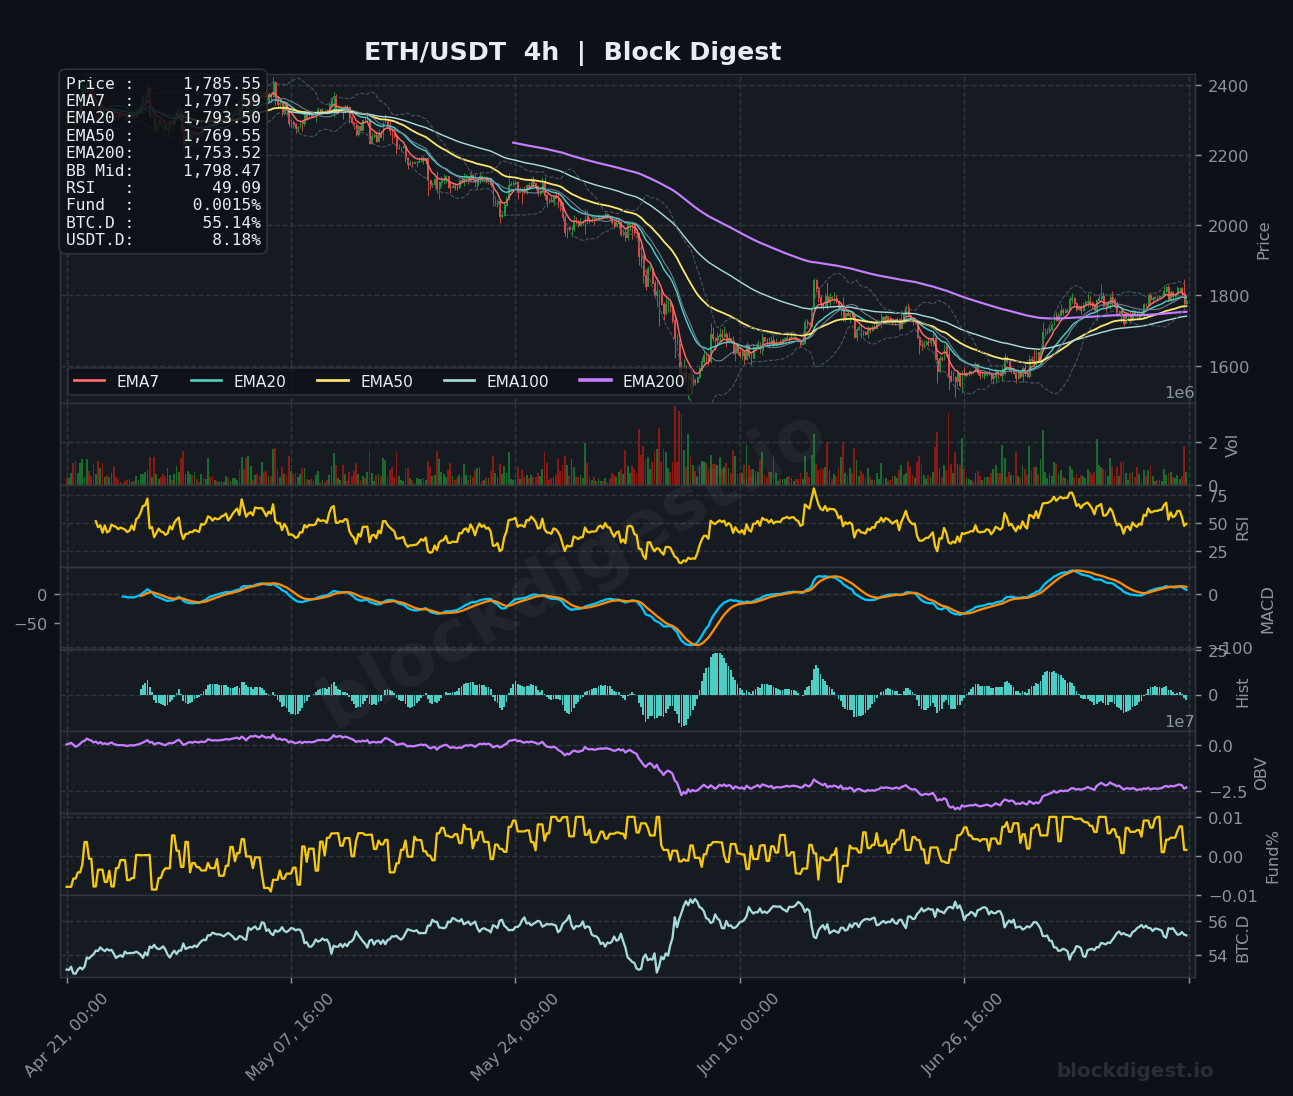
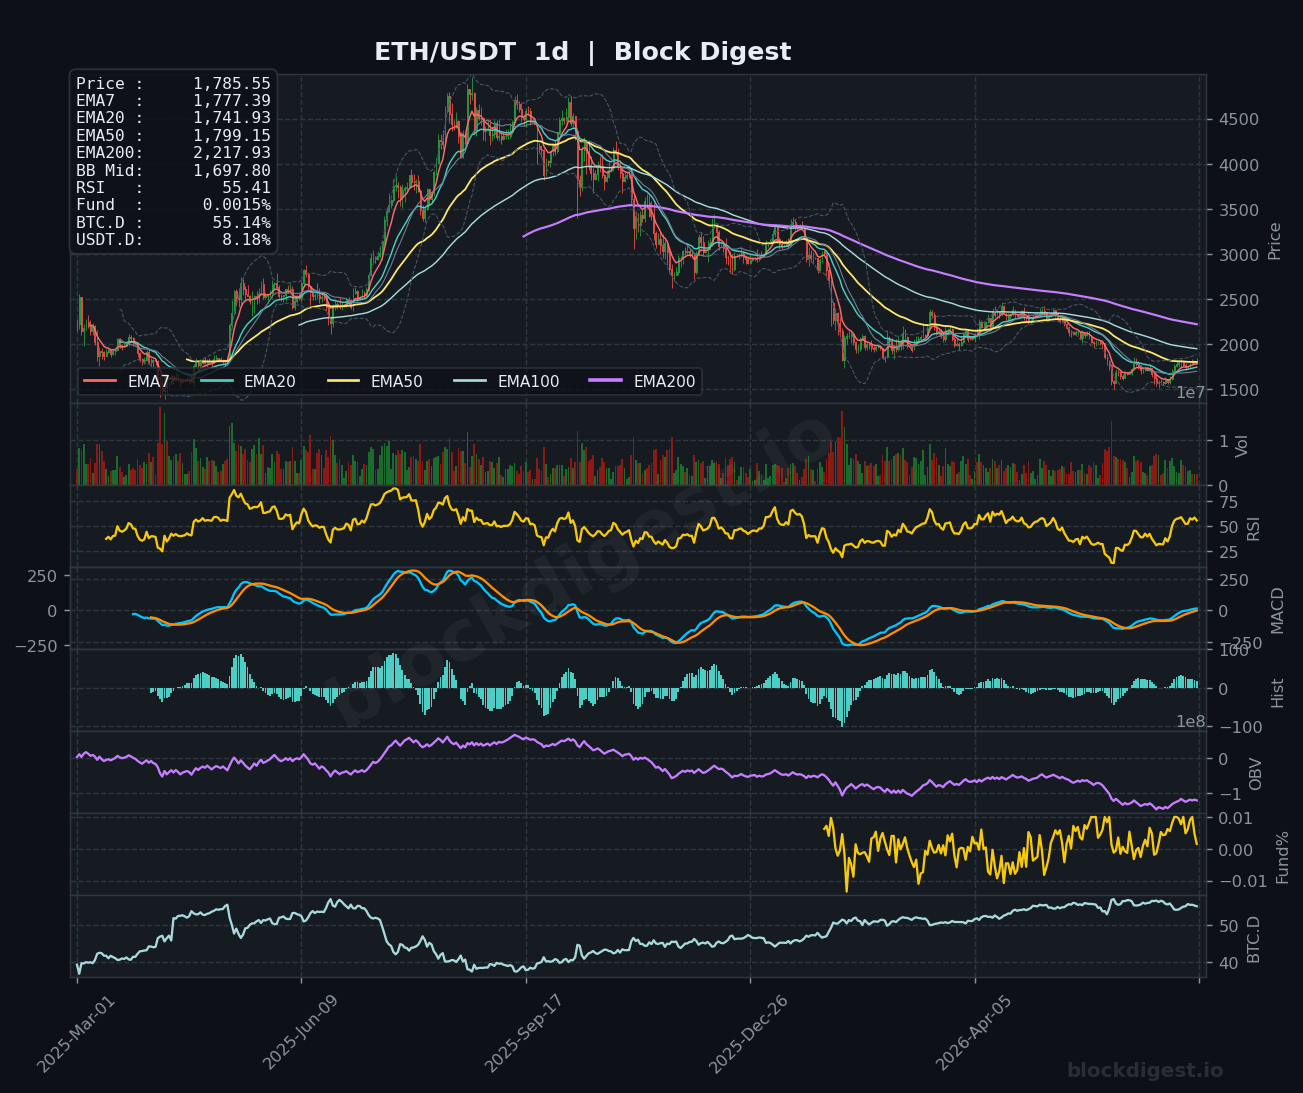
Across all three timeframes, there is confluence around the $1,785–$1,800 zone as the critical battleground for the near-term directional outcome. On the 4-hour chart, the short-term EMA cluster (EMA7 at $1,797, EMA20 at $1,793, EMA50 at $1,769, EMA200 at $1,753) has begun to converge and curl upward, suggesting short-term momentum is improving. However, the daily chart shows price sitting just below the EMA50 ($1,799) and above the EMA7 ($1,777) and EMA20 ($1,741), placing it in a congested zone that requires a decisive daily close above $1,800 to validate the bounce. The weekly downtrend remains firmly intact until price can clear and hold above the $2,000–$2,032 region on a sustained basis.
Key Weekly Levels
- Weekly Resistance: $1,800–$1,801 (weekly EMA7 and daily EMA50 cluster — immediate overhead); $2,000–$2,032 (Bollinger Band midline and weekly EMA20 — major macro resistance); $2,217 (daily EMA200 — defines the overarching bear market ceiling)
- Weekly Support: $1,744–$1,753 (daily open reference from July 10 and 4H EMA200 — near-term floor); $1,650–$1,680 (recent swing low and lower Bollinger Band support on the weekly); $1,500–$1,550 (macro structural support from 2023 consolidation range and critical long-term demand zone)
Momentum & Volume Analysis
The weekly RSI at 38.21 remains in bearish territory but is showing early signs of a potential bottoming curl, recovering from levels that previously marked cyclical lows — though it has not yet crossed back above the neutral 40 mark to signal a shift. On the daily timeframe, RSI has improved more meaningfully to 55.41, reflecting the strength of the short-squeeze bounce, while the 4H RSI at 49.09 is neutral-to-cautiously bullish. The weekly MACD histogram remains negative and the signal line bearish, but the daily MACD is beginning to turn upward with histogram bars transitioning positive — a tentative multi-timeframe divergence worth monitoring. The weekly OBV continues its downtrend from the 2024 peak, confirming persistent distribution, though the daily OBV has stabilized slightly; funding rates sitting at a negligible +0.0015% indicate the market is neither crowded long nor aggressively short, consistent with a fragile, positioning-light bounce rather than a conviction-driven reversal.
BTC Dominance & Altcoin Implications
BTC dominance currently sits at 55.14% and has been in a persistent uptrend visible on both the 4H and weekly charts, reflecting continued capital rotation away from altcoins and into Bitcoin. USDT dominance at 8.18% remains elevated, signaling that a meaningful portion of market capital is still sitting on the sidelines in stablecoins rather than deploying into risk assets like ETH. Until BTC.D shows a clear structural peak and rollover — ideally below the 53% range — the conditions for a sustained ETH outperformance or broader altcoin season remain unfavorable.
Risk Scenarios
- Bull case: A confirmed weekly close above $1,800 followed by a reclaim of the $1,850–$1,900 zone could trigger a more aggressive short-squeeze extension toward the $2,000–$2,032 Bollinger midline resistance. Institutional re-accumulation — potentially catalyzed by entities like BitMine continuing their ETH treasury strategy — combined with a reversal in spot ETF flows and dovish Fed signaling could provide the fundamental fuel for a rally targeting the $2,200 daily EMA200.
- Bear case: Failure to hold the $1,744–$1,753 support band on any retest would expose ETH to a retest of the $1,600–$1,650 swing lows, and a break below that would open the door to the critical $1,500 macro support zone. Continued ETF outflows extending an eighth consecutive week of withdrawals, paired with a strengthening dollar and deteriorating risk appetite from AI equity competition, would validate the bear case and could see ETH revisit multi-year lows.
Weekly Outlook
The directional bias for the week of July 13–20 is cautiously neutral-to-bearish with a short-term bounce bias, contingent entirely on whether ETH can sustain trade above the $1,800 weekly EMA7 and the daily EMA50. The short-squeeze recovery from 21-month lows is technically notable, but it is occurring in the context of a deeply broken macro structure, persistent institutional outflows, and unfavorable dominance dynamics — all of which limit the conviction of any bull case. Key catalysts to monitor include U.S. CPI data and any shifts in Federal Reserve language that could impact risk sentiment, as well as continued developments in spot ETF flow data heading into the ninth consecutive week of potential withdrawals. Traders should watch the $1,800 level on a closing basis as the week’s primary pivot — acceptance above it opens the door to $1,850–$1,900, while rejection risks a swift return toward the $1,650–$1,700 support band. The overall risk/reward setup favors patience: the macro bear trend is intact, and any long exposure should be sized accordingly and protected with clear invalidation levels below $1,750.
Disclaimer: This analysis is for informational purposes only and does not constitute financial advice. Cryptocurrency markets are highly volatile and unpredictable. All trading decisions should be made based on your own research and risk tolerance. Block Digest is not responsible for any financial losses incurred as a result of acting on this content.
Stay Ahead of the Market
Follow BlockDigest for crypto market intelligence, research and real-time updates.