
Market Overview
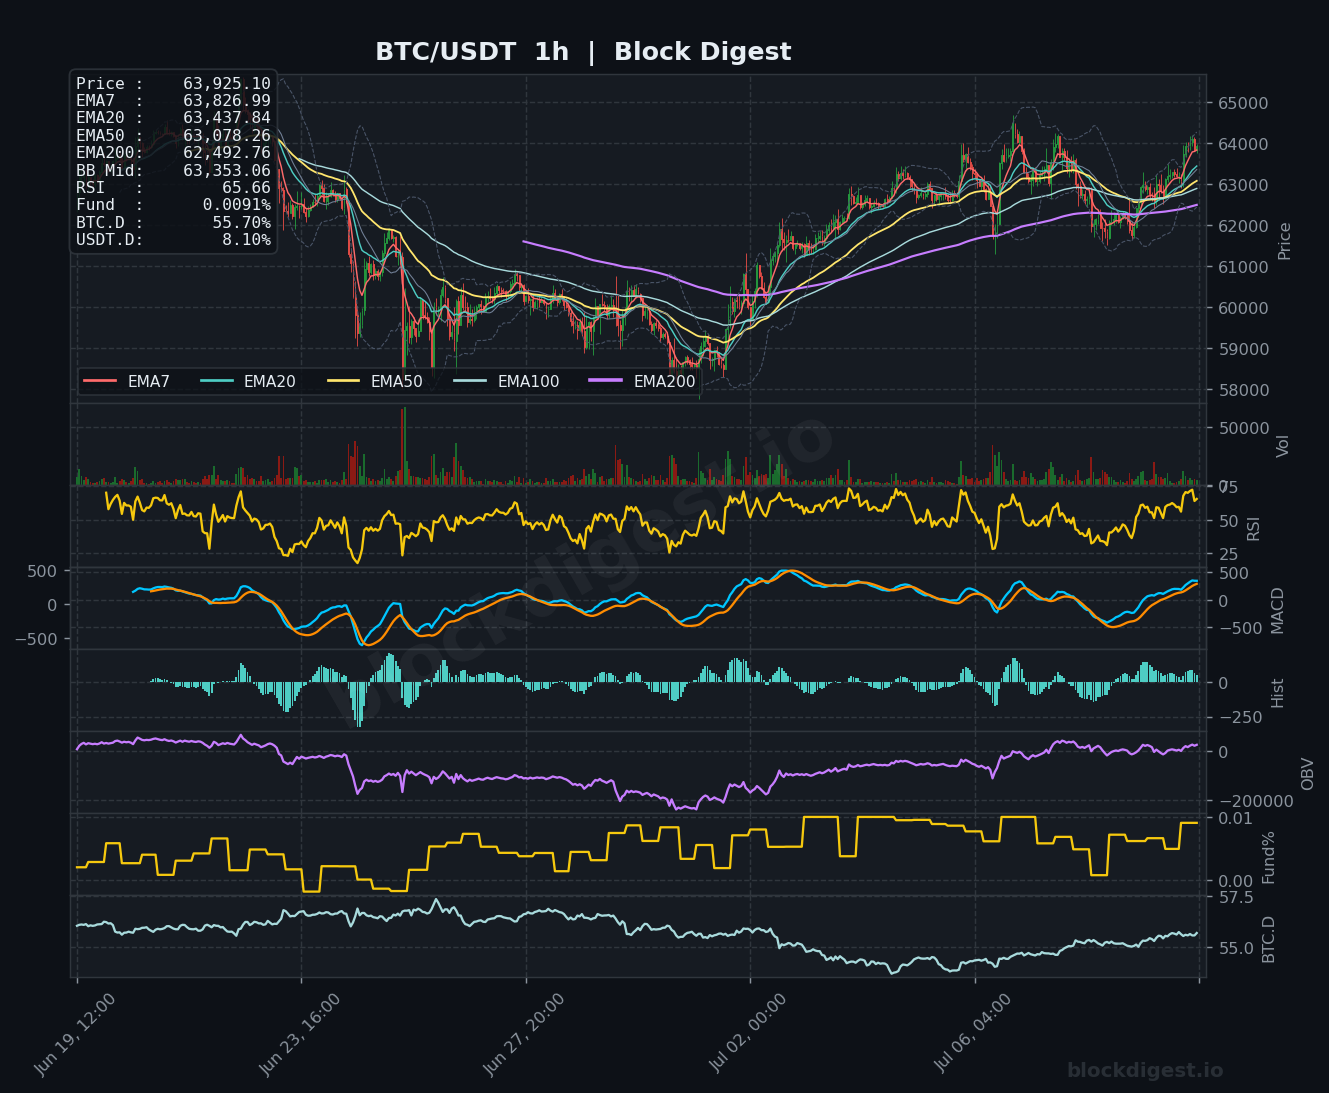
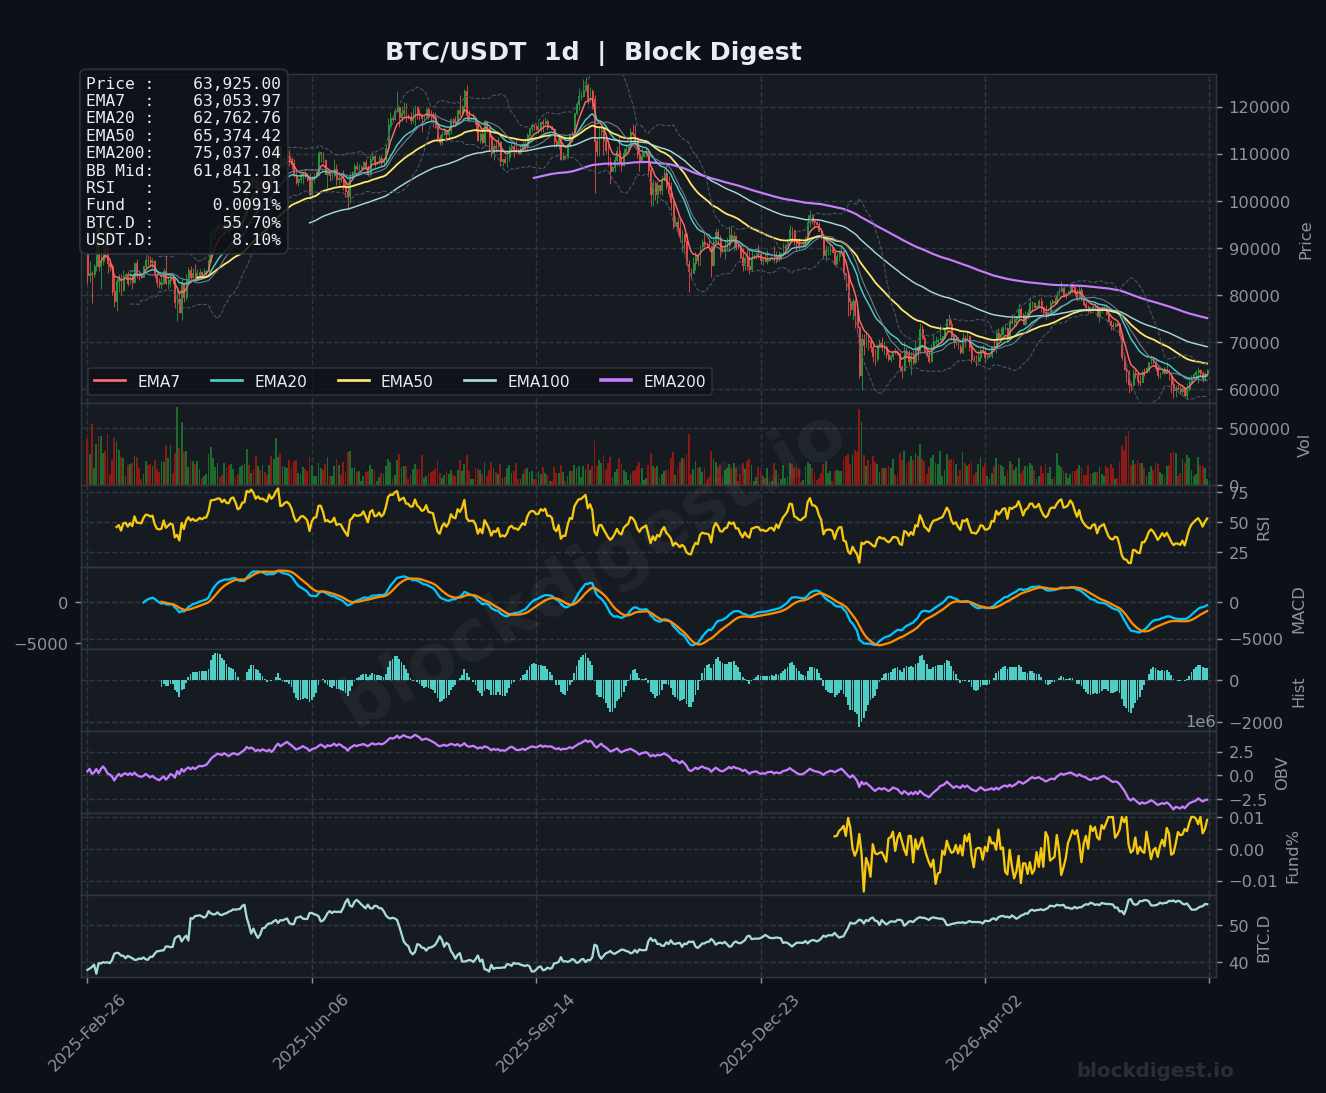
Bitcoin is trading at $63,925 as of July 10, 2026, holding above all short-term EMAs on the 1-hour chart while attempting to reclaim meaningful ground following a recovery from late-June lows near $58,000. On the daily timeframe, price remains well below the EMA200 ($75,037) and EMA50 ($65,374), confirming that the broader macro trend is still bearish despite the recent bounce. The daily Bollinger Band midline sits at $61,841, and price is now trading above it, which is a tentatively constructive near-term development. That said, the prevailing structure on the daily chart reflects a prolonged downtrend from all-time highs, and the current recovery remains corrective in nature until proven otherwise.
Multi-Timeframe Confluence
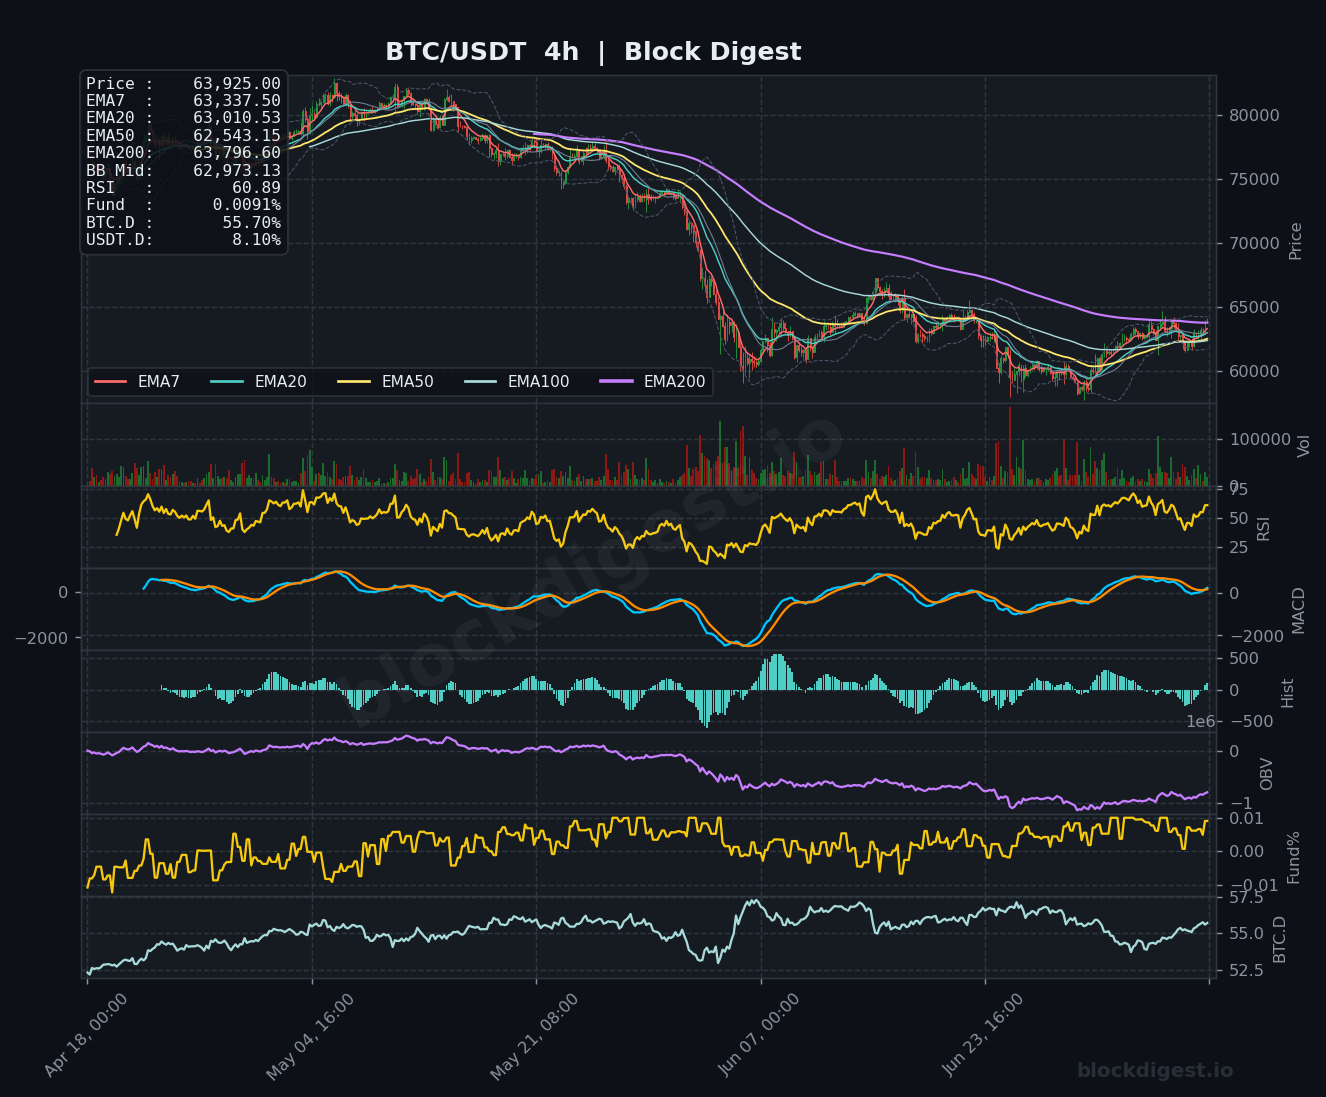
On the 1-hour chart, price at $63,925 sits comfortably above the EMA7 ($63,827), EMA20 ($63,438), EMA50 ($63,078), and EMA200 ($62,493), indicating strong short-term bullish alignment across all key moving averages. The 4-hour chart shows a similar picture, with price breaking above the EMA7 ($63,338), EMA20 ($63,011), and EMA50 ($62,543), though the EMA200 at $63,797 on this timeframe presents immediate overhead resistance that price is currently testing. The daily chart remains the key concern — price has yet to reclaim the EMA7 ($63,054) convincingly and is still structurally below both the EMA50 and EMA200, meaning short-term bullish momentum is operating against a higher-timeframe headwind. Confluent resistance in the $63,800–$65,374 zone is critical for the next directional leg.
Key Levels to Watch
- Resistance: $63,797–$63,925 — The 4-hour EMA200 coincides with current price, acting as a dynamic ceiling; a clean hourly close above this level would be a meaningful short-term signal.
- Resistance: $65,374 — The daily EMA50, a major macro resistance level that has capped rallies throughout the broader downtrend; reclaiming this level would shift the intermediate bias.
- Resistance: $67,000–$68,000 — A structural supply zone visible on the daily chart corresponding to prior consolidation and the EMA100 region, representing the next significant hurdle for bulls.
- Support: $62,493–$62,543 — Confluence of the 1-hour EMA200 and 4-hour EMA50; a key short-term floor on any intraday pullback.
- Support: $61,841 — Daily Bollinger Band midline; holding above this level is essential to maintaining the short-term recovery thesis.
- Support: $58,000–$59,000 — The late-June swing low and broader demand zone; a breakdown to this area would invalidate the current bounce and expose deeper downside.
Momentum & On-Chain Signals
The 1-hour RSI at 65.66 is approaching overbought territory but has not yet reached 70, leaving modest room for continuation before a cooling period becomes likely. The 4-hour RSI at 60.89 is in healthy bullish momentum territory and trending upward, reinforcing the near-term recovery bias. The daily RSI at 52.91 is the most telling — it has recovered from oversold readings near 30 during the June lows, but remains well shy of the 60–70 range typically associated with confirmed bullish momentum. On the OBV front, the 1-hour OBV is trending upward following its trough, suggesting incremental accumulation, while the daily OBV remains in a long-term downtrend, reflecting persistent net distribution that has not yet reversed. The funding rate at 0.0091% is modestly positive but essentially neutral, indicating no excessive leverage buildup in either direction — a relatively healthy environment for continued price discovery.
BTC Dominance & Market Sentiment
BTC dominance currently sits at 55.70%, which after a period of elevated dominance above 57–58%, suggests some capital rotation beginning to move toward altcoins — though the move remains modest. USDT dominance at 8.10% remains relatively elevated by historical standards, indicating a still-cautious market posture with meaningful capital sitting on the sidelines. Together, these readings suggest that overall risk appetite is improving but remains selective, with the broader market not yet in a full risk-on rotation that would amplify BTC’s upside through altcoin outperformance.
Risk Scenarios
- Bullish case: A confirmed 4-hour close above the $63,797 EMA200 followed by a daily close above $65,374 (the daily EMA50) would signal a meaningful shift in structure and could open a path toward the $67,000–$68,000 supply zone. Continued positive funding flows and improving OBV on the daily would add conviction to this scenario.
- Bearish case: Failure to hold the $62,493–$62,543 confluence support on a 4-hour closing basis would suggest the current rally is losing steam and risk a retest of the $61,841 daily BB midline and ultimately the $58,000–$59,000 demand zone; a breakdown there would confirm trend resumption to the downside.
Outlook
The near-term bias is cautiously bullish, supported by a clean short-term EMA stack on the 1-hour and 4-hour charts and an RSI structure that is recovering without yet reaching overbought extremes. However, the daily timeframe keeps the overall context firmly bearish — price remains below the EMA50 and EMA200, and OBV has not confirmed distribution reversal. The critical level to watch over the next 24–48 hours is the $63,797–$65,374 zone; a sustained push through this range with volume would meaningfully improve the intermediate-term thesis, while rejection here would likely lead to a consolidation or pullback toward the $62,000–$62,500 area. With social sentiment leaning modestly bullish (36% vs. 16% bearish) and funding rates neutral, the setup is constructive for a grind higher, but confirmation from the daily chart is still needed before higher-conviction positioning is warranted.
Disclaimer: This analysis is for informational purposes only and does not constitute financial advice. Cryptocurrency markets are highly volatile and unpredictable. All trading decisions should be made based on your own research and risk tolerance. Block Digest is not responsible for any financial losses incurred as a result of acting on this content.
Stay Ahead of the Market
Follow BlockDigest for crypto market intelligence, research and real-time updates.


