Weekly Market Overview
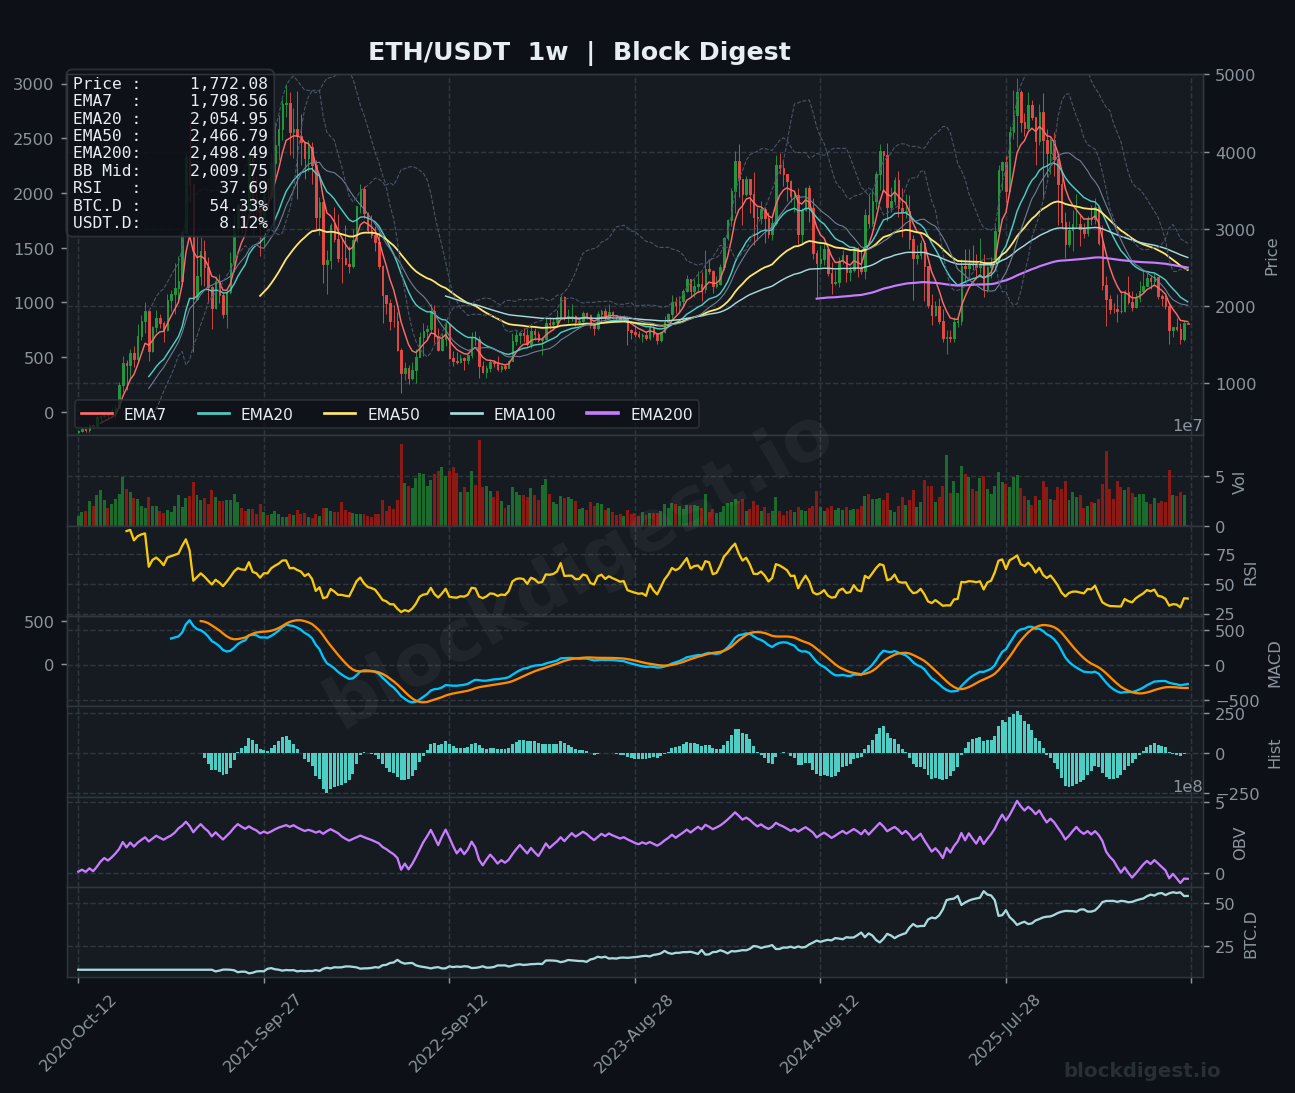
Ethereum closed the week near $1,772, posting a gain of approximately 10% week-over-week — a meaningful recovery from the multi-month lows carved out in late May and early June. Price action has been constructive, with ETH pushing back above the $1,700 psychological handle and reclaiming several short-term moving averages on the 4-hour chart. The weekly candle structure reflects a strong bullish continuation attempt, with buyers clearly in control after a prolonged downtrend. However, this recovery is occurring within the context of a broader macro downtrend that has persisted since ETH’s peak near $4,000, making the current bounce a potential inflection point rather than a confirmed trend reversal.
Higher Timeframe Structure
On the weekly chart, the macro picture remains unambiguously bearish: price sits below all major EMAs — EMA7 at $1,798, EMA20 at $2,054, EMA50 at $2,466, EMA100, and EMA200 at $2,498 — all of which are stacked in a bearish descending order. The weekly Bollinger Band midline sits at approximately $2,009, representing the first meaningful overhead target for bulls to reclaim before a structural trend shift can be considered. Weekly RSI at 37.69 is notably depressed, hovering just above oversold territory, which is consistent with conditions seen near historical cycle lows, but not yet issuing a definitive reversal signal. OBV on the weekly timeframe has been declining persistently, confirming that the sell-side volume has dominated this entire downturn and accumulation has not yet reached a convincing inflection.
Multi-Timeframe Confluence
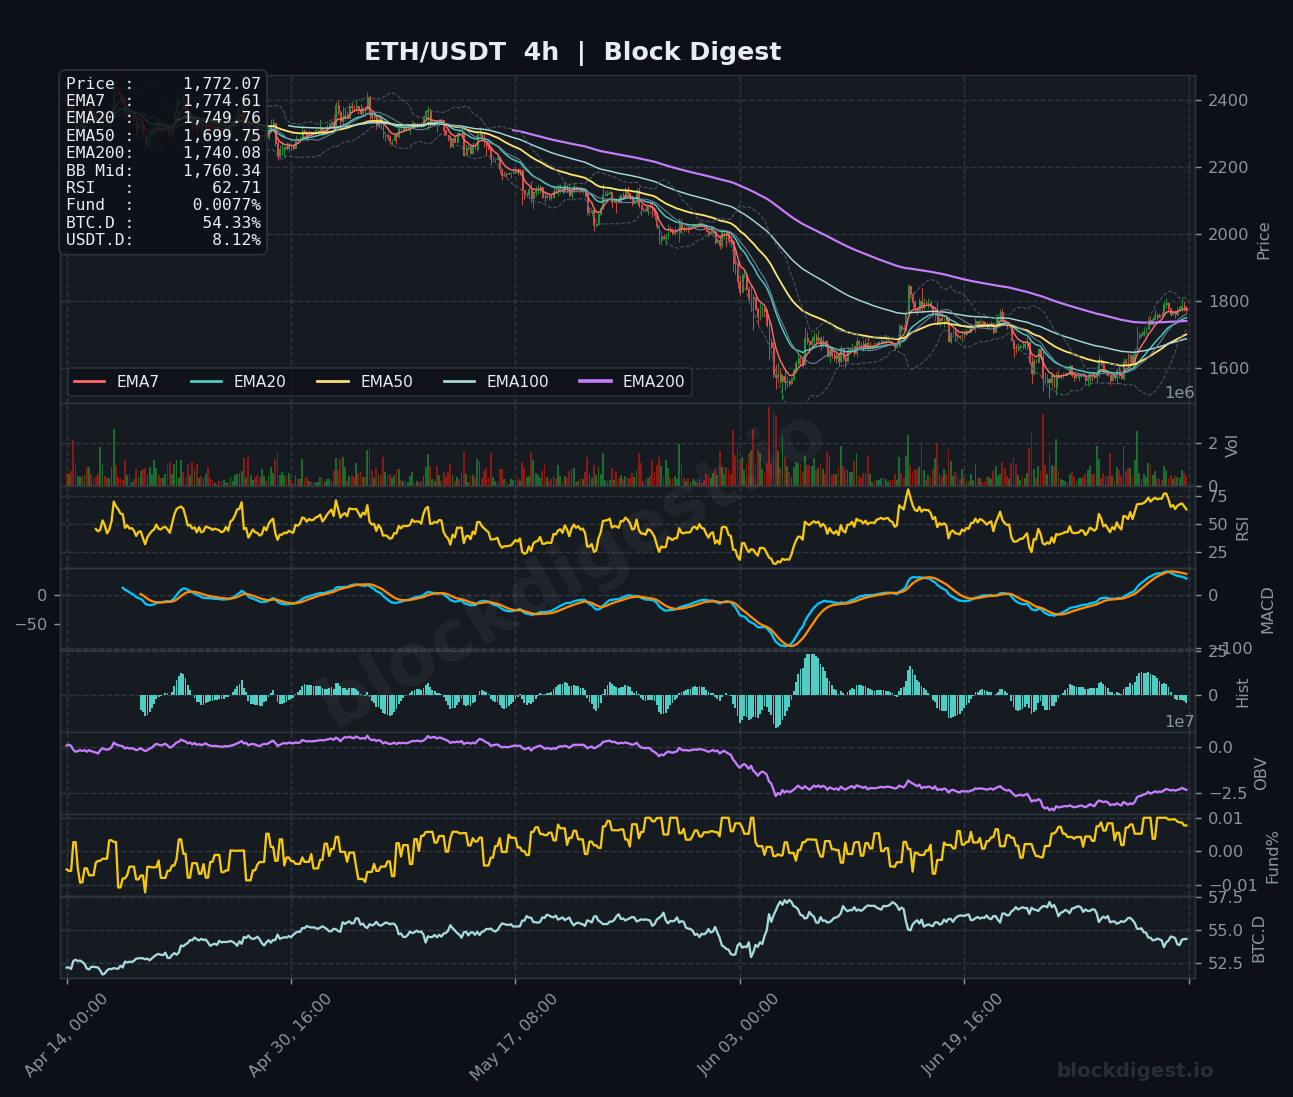
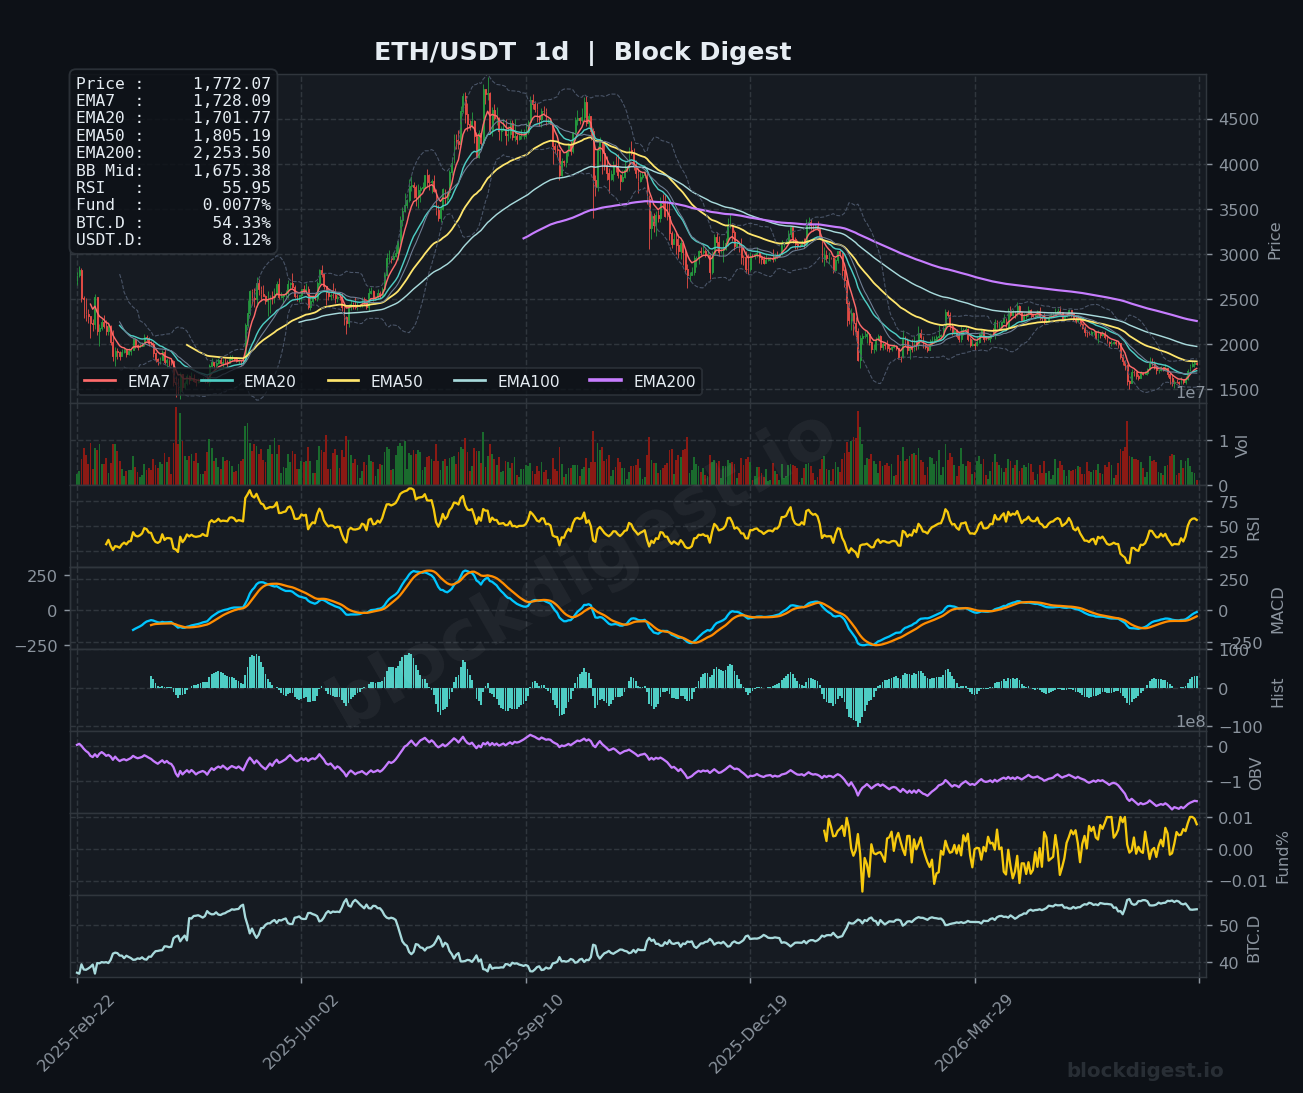
Across timeframes, there is a tentative but meaningful alignment beginning to form in favor of near-term bulls, though it remains fragile. On the 4-hour chart, price has reclaimed the EMA7 ($1,774), EMA20 ($1,749), and critically the EMA200 ($1,740), while the 4H RSI at 62.71 indicates solid bullish momentum without yet reaching overbought extremes. The daily chart shows price trading above EMA7 ($1,728) and EMA20 ($1,701), though the daily EMA50 at $1,805 poses the most immediate overhead resistance. The key zone of confluence lies between $1,800 and $1,810 — where the 4H EMA200, daily EMA50, and a prior structural breakdown area all converge — making this the pivotal decision zone for the week ahead.
Key Weekly Levels
- Weekly Resistance: $1,805 (daily EMA50 and near-term structural resistance), $2,009 (weekly Bollinger Band midline and major psychological zone), $2,054 (weekly EMA20 — the first major MA reclaim needed to shift macro bias)
- Weekly Support: $1,700 (key psychological level and recent breakout zone), $1,620–$1,640 (swing low structure and lower Bollinger Band region on the daily), $1,500 (macro support and multi-year demand area visible on the weekly chart)
Momentum & Volume Analysis
The 4-hour MACD is in bullish territory with the signal and MACD lines positively crossed and histogram expanding, reflecting genuine short-term momentum. The daily MACD is also turning constructively, with the lines beginning to curl upward from deeply negative readings — a classic early-stage recovery signal. Weekly MACD, however, remains in negative territory with both lines below zero, confirming the macro trend has not reversed. Funding rates sitting at a near-neutral +0.0077% are particularly telling: despite a 10% weekly rally, traders are not aggressively adding leveraged longs, suggesting this move is being driven by spot buyers rather than speculative excess — a healthier foundation for continuation, and consistent with the broader narrative of whales absorbing ETF outflows at these levels.
BTC Dominance & Altcoin Implications
BTC dominance sits at 54.33% and, based on the daily chart, has been showing early signs of a rollover from its recent highs — a development that historically precedes capital rotation into altcoins like ETH and Solana. USDT.D at 8.12% remains elevated, suggesting a significant portion of the market remains in stablecoins on the sidelines, which represents latent buying power that could accelerate any breakout if sentiment shifts decisively. ETH’s 10% weekly gain outpacing Bitcoin modestly, combined with Solana’s near-19% move, implies that altcoin rotation may already be underway, though it will require a more sustained BTC.D decline to confirm a broader alt season is materializing.
Risk Scenarios
- Bull case: A clean daily close above $1,805 would clear the daily EMA50 and open the path toward the $2,009 weekly Bollinger Band midline. Continued ETH ETF inflows (which tallied $1.6 billion this week), sustained BTC dominance decline, and improving risk sentiment could fuel a grind toward the $2,054–$2,100 weekly EMA20 zone over a 2–3 week horizon — a level that would mark the first genuine test of macro trend reclamation.
- Bear case: Failure to hold the $1,700–$1,720 zone on any retest would signal the bounce is exhausting, with a likely retest of the $1,620–$1,640 demand area. A deterioration in macro risk sentiment, renewed BTC ETF outflows, or a reversal in BTC.D back above 55–56% could see ETH revisit the $1,500 region, which represents major long-term support on the weekly chart.
Weekly Outlook
The directional bias for the week of July 6 leans cautiously bullish, but with meaningful caveats given the overwhelming macro downtrend still intact on higher timeframes. The $1,800–$1,810 cluster is the critical battleground: bulls need a decisive daily close above this zone to maintain credibility, while bears will look to defend it aggressively as it aligns with the daily EMA50 and prior breakdown structure. Catalysts to watch include continued ETH ETF flow data (particularly whether the $1.6B inflow momentum persists), any developments in U.S. regulatory clarity, and broader risk market behavior as July — historically ETH’s strongest month — gets underway. Historically, July has delivered average returns of +7.6%, which would place ETH in the $1,900 range if seasonal patterns hold. Overall, the setup offers a favorable risk/reward for tactical longs above $1,720 support with a target of $1,900–$2,000, but position sizing should remain measured until the weekly EMA7 at $1,798 is reclaimed and held on a closing basis.
Disclaimer: This analysis is for informational purposes only and does not constitute financial advice. Cryptocurrency markets are highly volatile and unpredictable. All trading decisions should be made based on your own research and risk tolerance. Block Digest is not responsible for any financial losses incurred as a result of acting on this content.
Stay Ahead of the Market
Follow BlockDigest for crypto market intelligence, research and real-time updates.