
Market Context
The broader altcoin market is showing early signs of recovery as BTC dominance slides to approximately 54.78%, a meaningful pullback from recent highs that is beginning to free up capital for rotation into major altcoins. USDT dominance at 8.28% remains elevated but appears to be losing upward momentum, suggesting that sidelined capital may be cautiously re-entering risk assets. The macro backdrop has improved modestly following Fed Chair Warsh’s comments on easing inflation risks, providing a tentative tailwind for risk appetite across the crypto complex.
Solana (SOL)
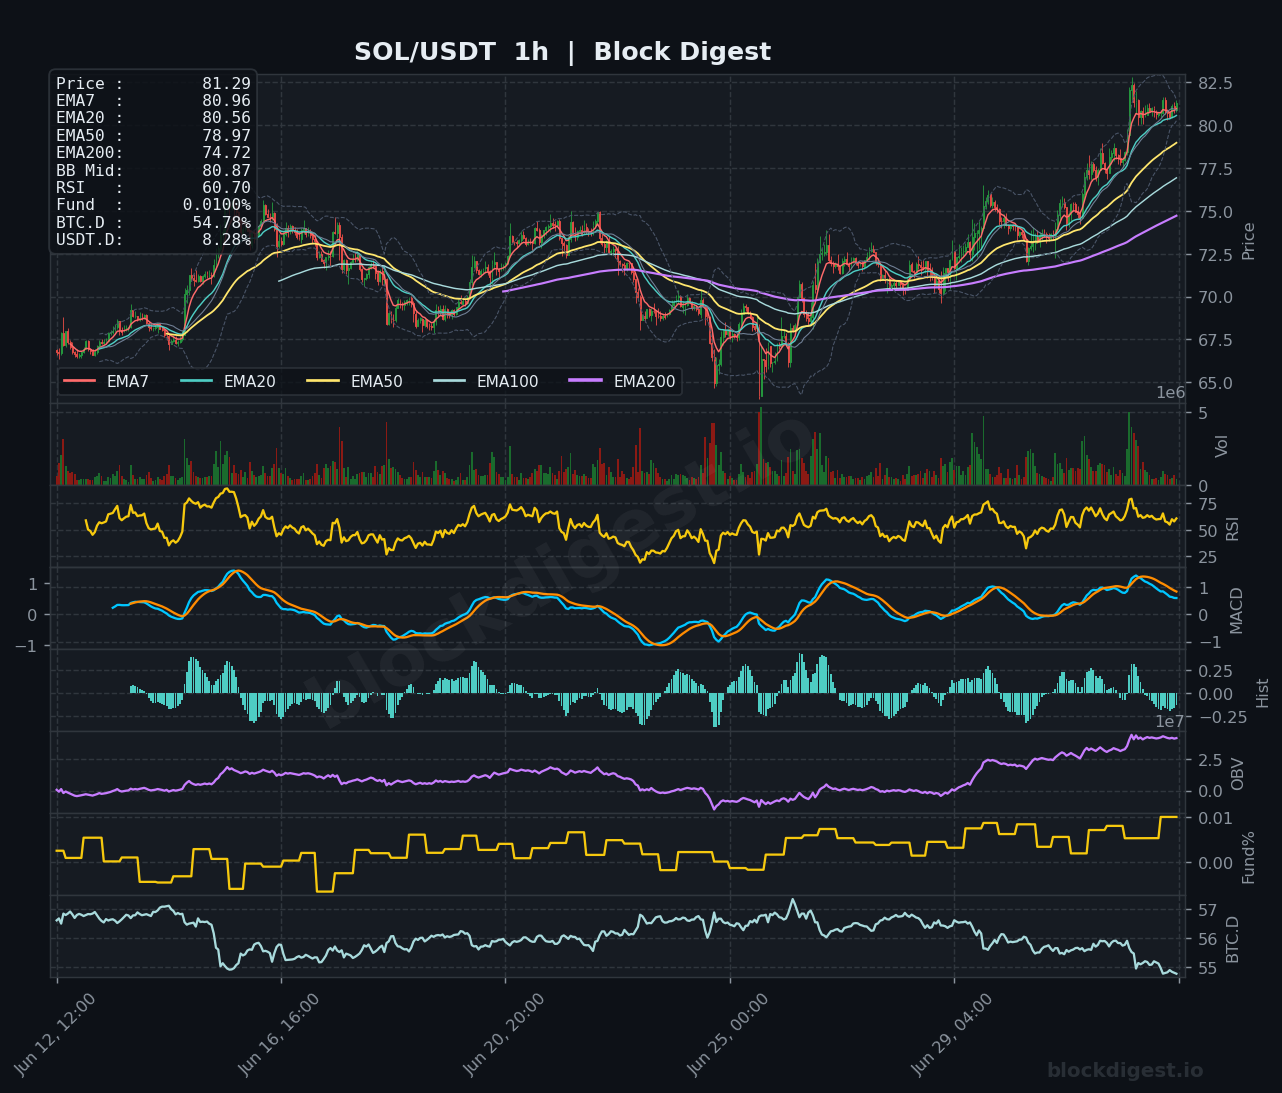
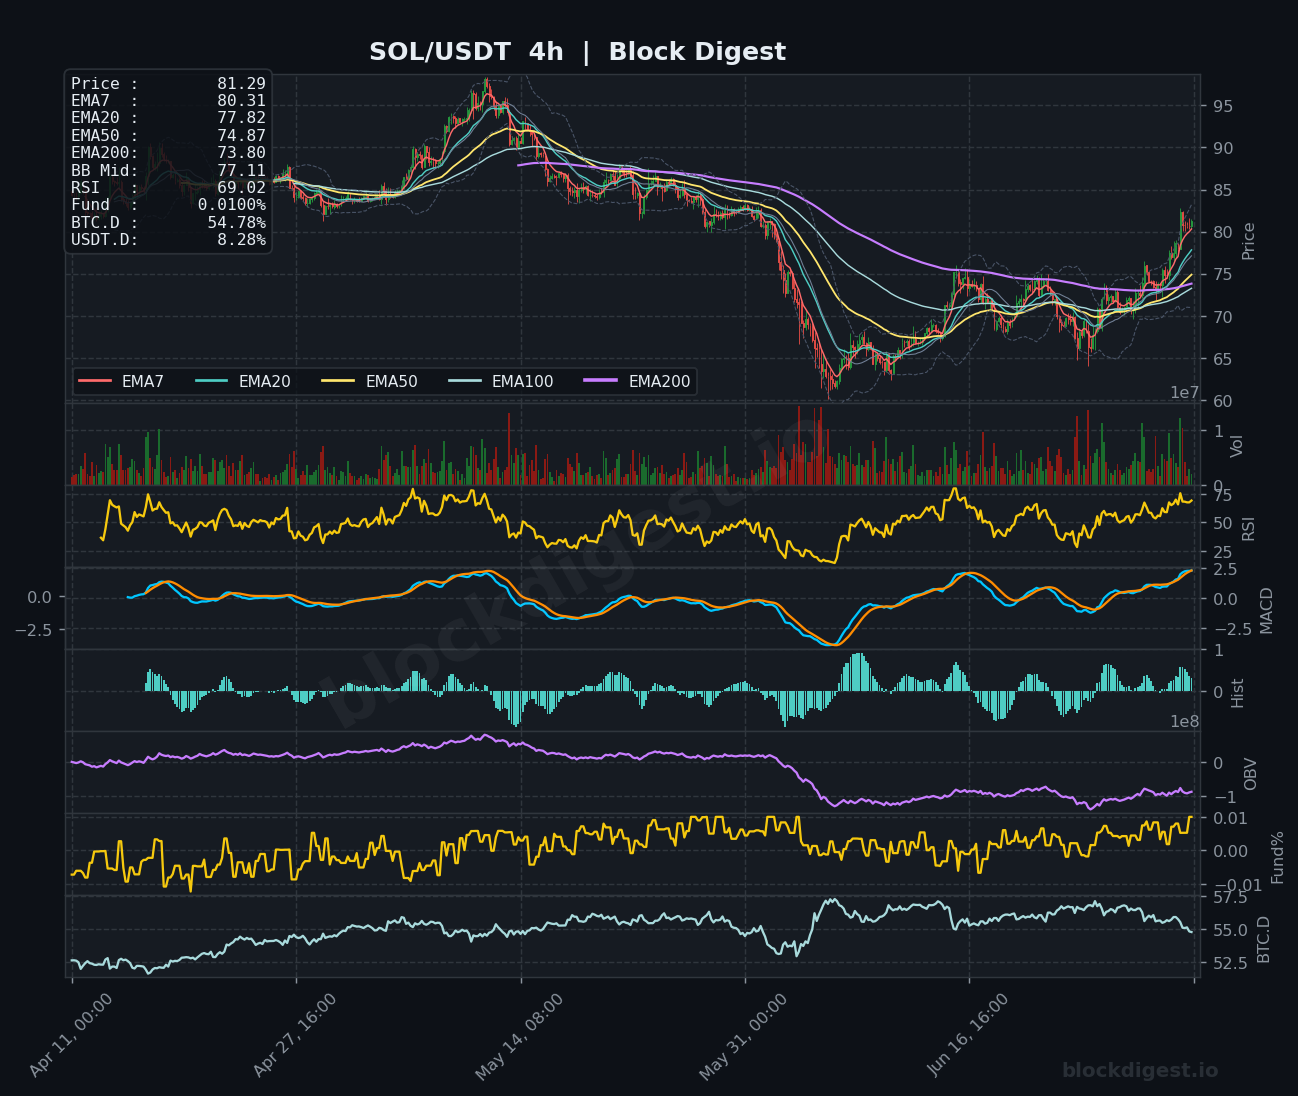
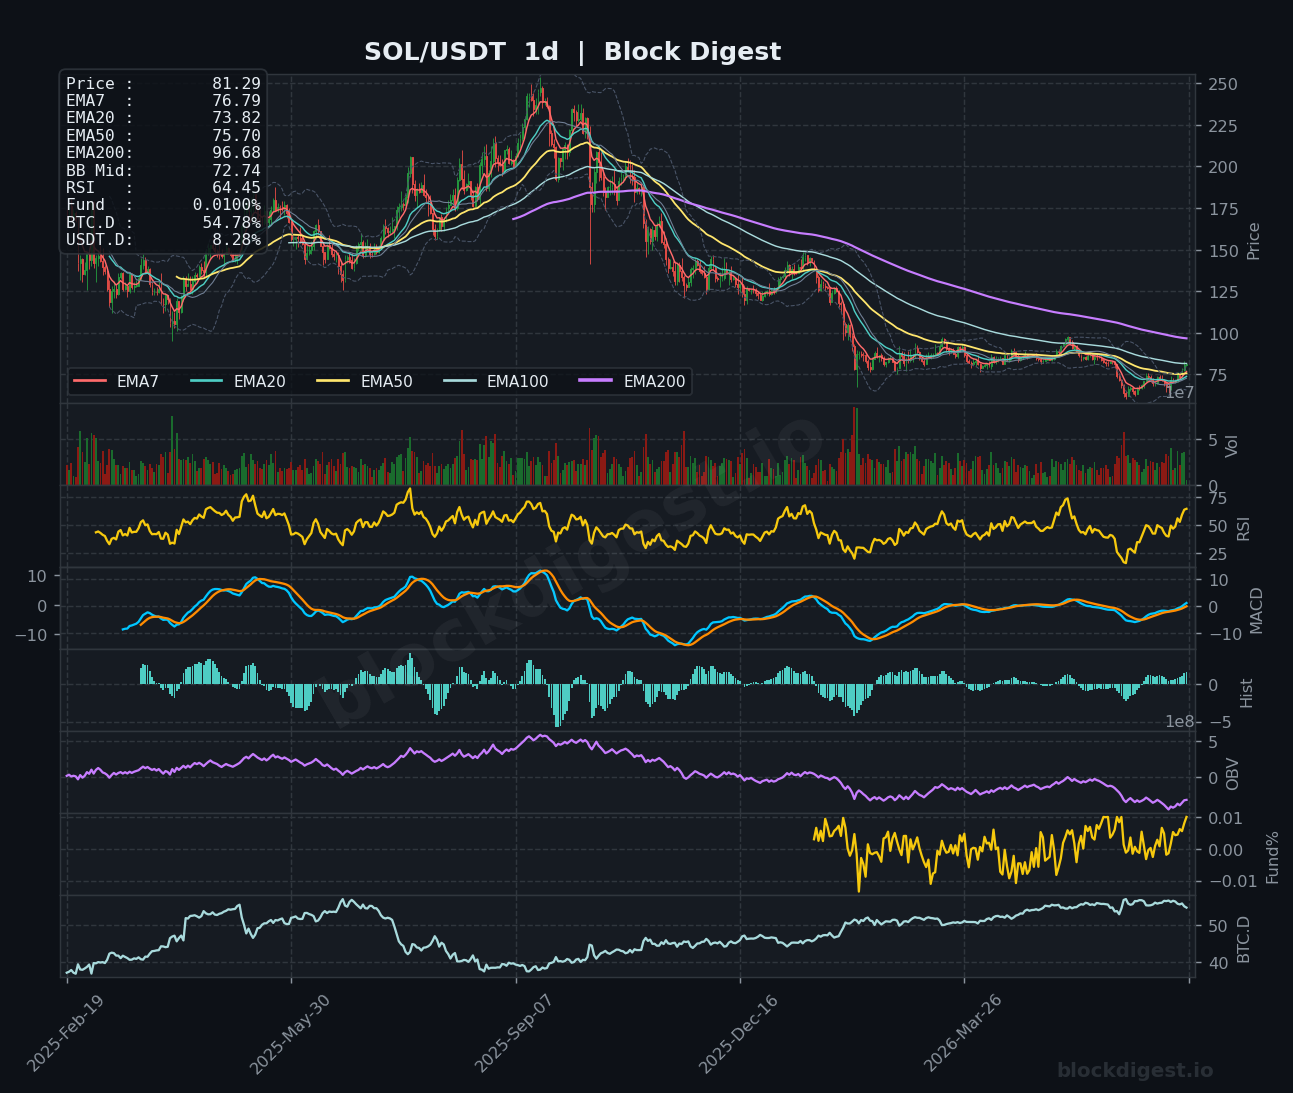
SOL is trading at $81.29, sitting above all short-term EMAs on the 1-hour chart with EMA7 at $80.96 and EMA20 at $80.56, reflecting a clean bullish stack that has held up well since a sharp recovery off the mid-$60s lows. The 4-hour RSI at 69.02 is approaching overbought territory, and while the MACD remains positively sloped and the histogram is building, the pace of gains does invite caution about short-term exhaustion near the $82–$83 resistance zone. On the daily chart, RSI is at 64.45 with the MACD signal line in a bullish crossover that remains early-stage — price still trades well below the daily EMA200 at $96.68, which marks the next major structural hurdle. The OBV on the 1-hour is surging to new highs, confirming genuine buying pressure, and the upcoming Alpenglow consensus upgrade narrative adds a fundamental layer to an already constructive short-term technical setup; bias is cautiously bullish with $78.50 as the key near-term support to hold.
XRP (XRP)
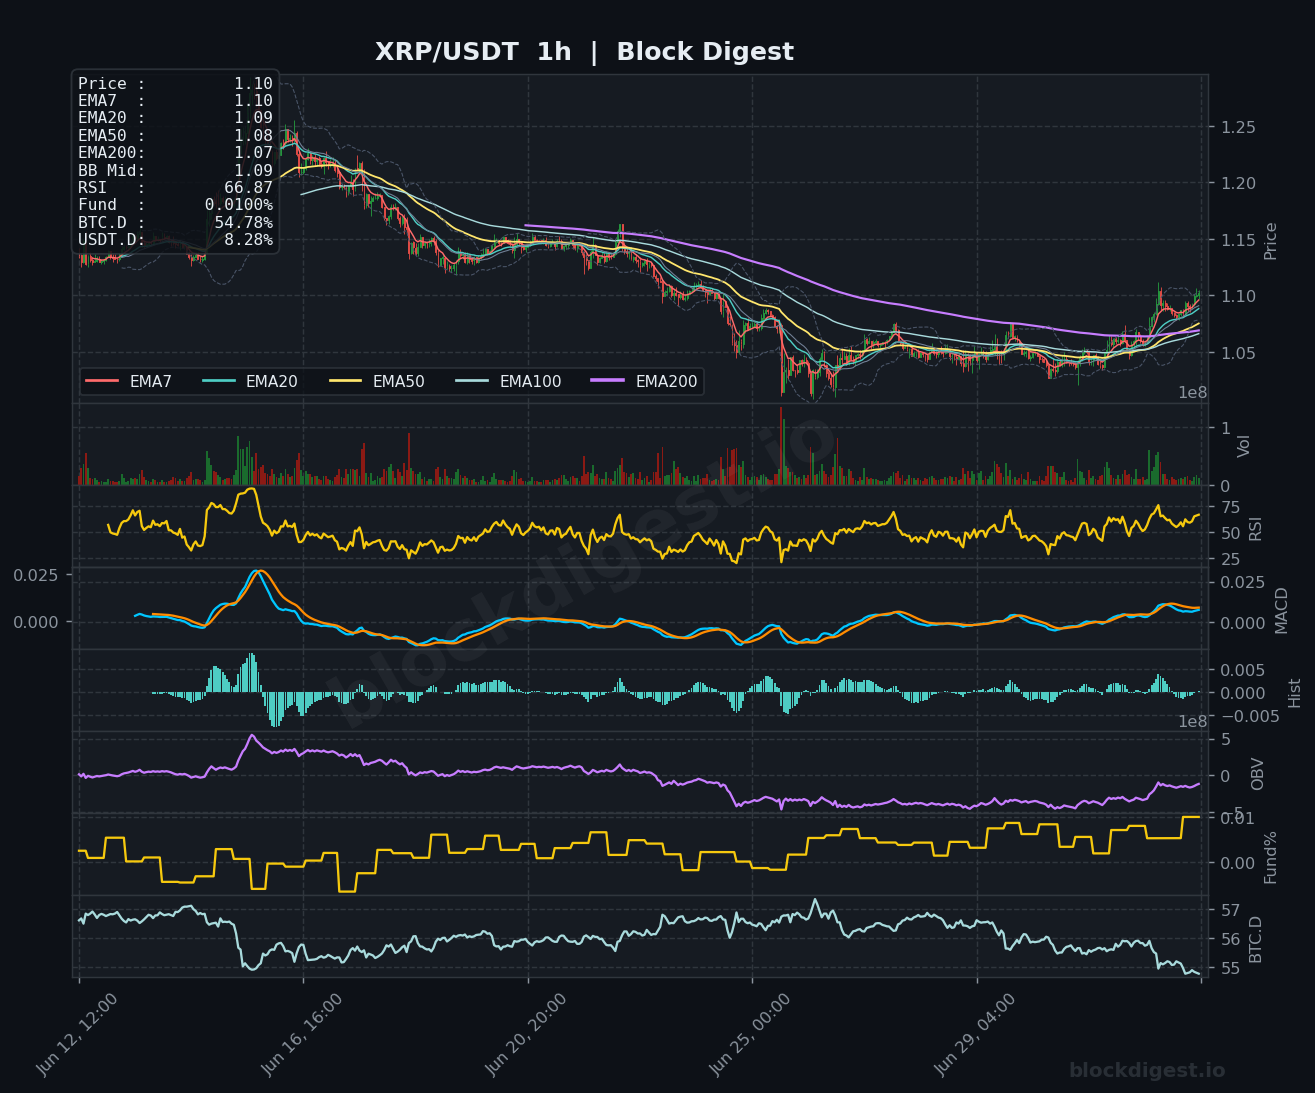
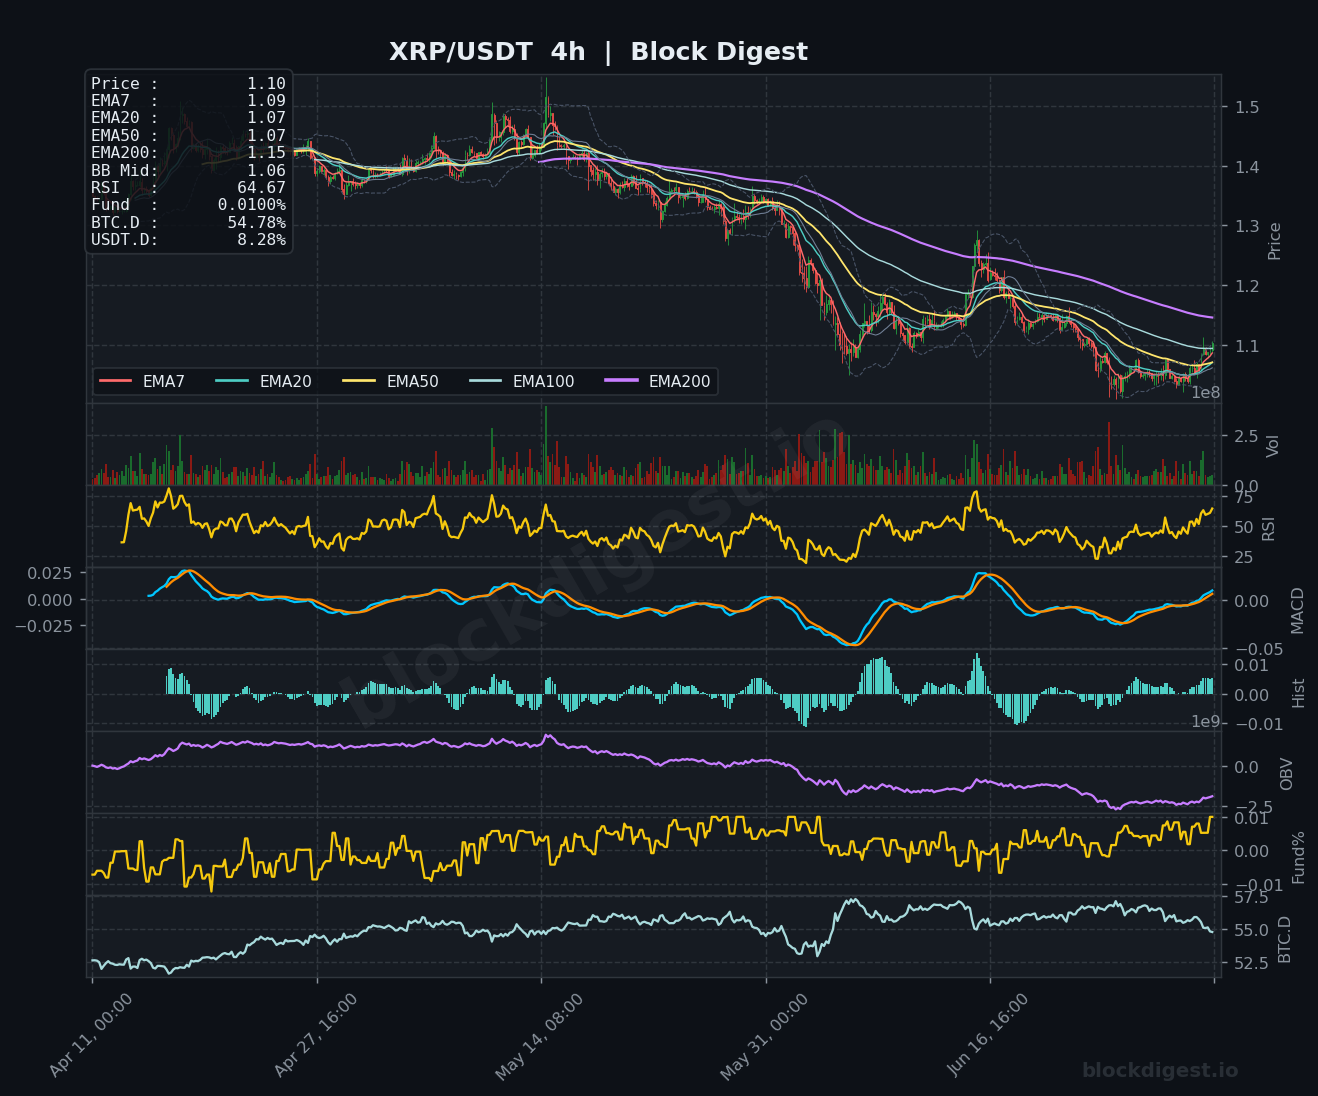
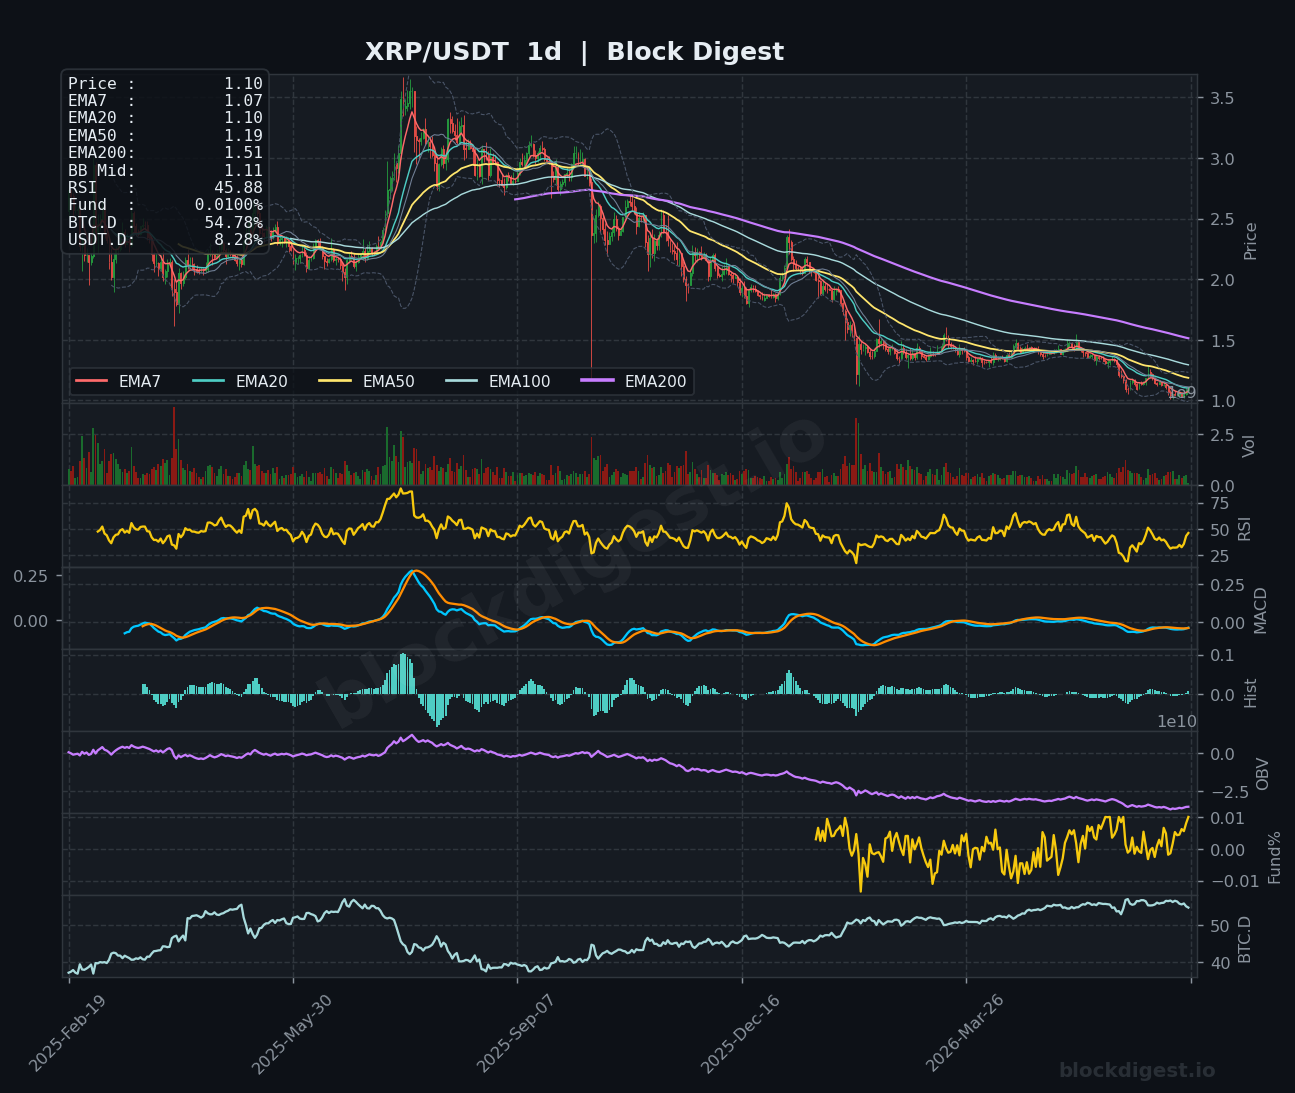
XRP is trading at $1.10, staging a recovery from a prolonged downtrend that saw price bottom near $1.04 before the recent bounce, with the 1-hour chart showing all short-term EMAs now stacked bullishly and price trading above the BB midline at $1.09. The 1-hour RSI at 66.87 is firm but not yet overbought, and the MACD on the same timeframe has crossed positively with a rising histogram — the first convincing momentum signal in several weeks. However, the daily chart tells a more cautious story: RSI sits at a subdued 45.88, the MACD remains in a shallow negative cross, and price is still well below the daily EMA50 at $1.19 and EMA200 at $1.51, which serve as significant overhead resistance levels. The 4-hour OBV has shown modest improvement but has not yet confirmed a structural trend reversal; bias is neutral-to-cautiously bullish on the short-term timeframe, with a clean break and hold above $1.15 needed to shift the intermediate-term picture meaningfully.
BNB (BNB)
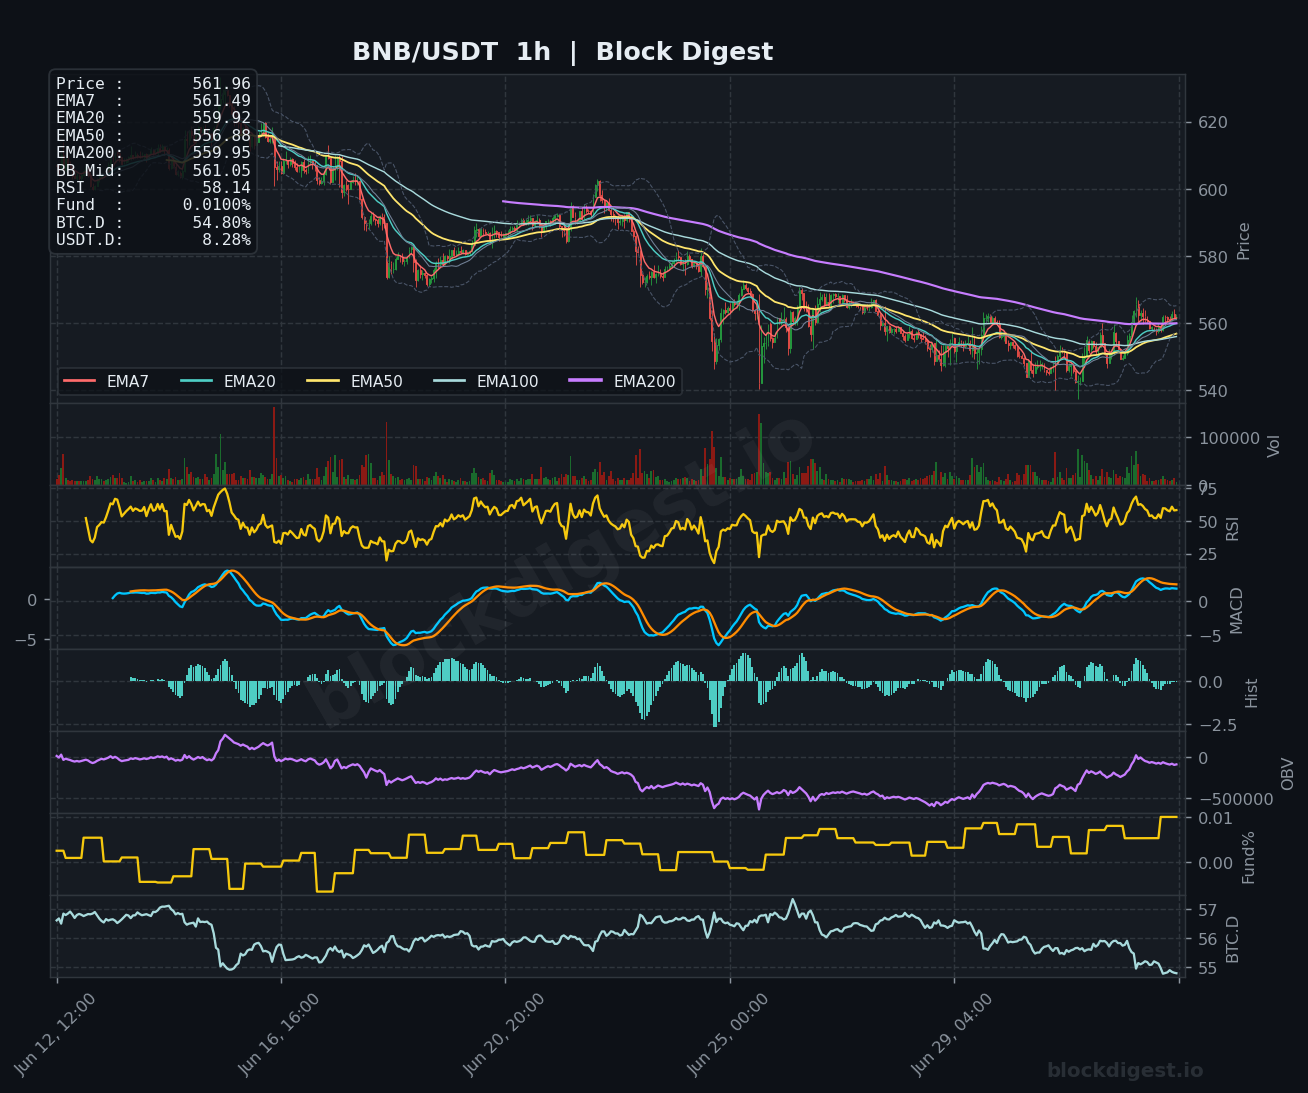
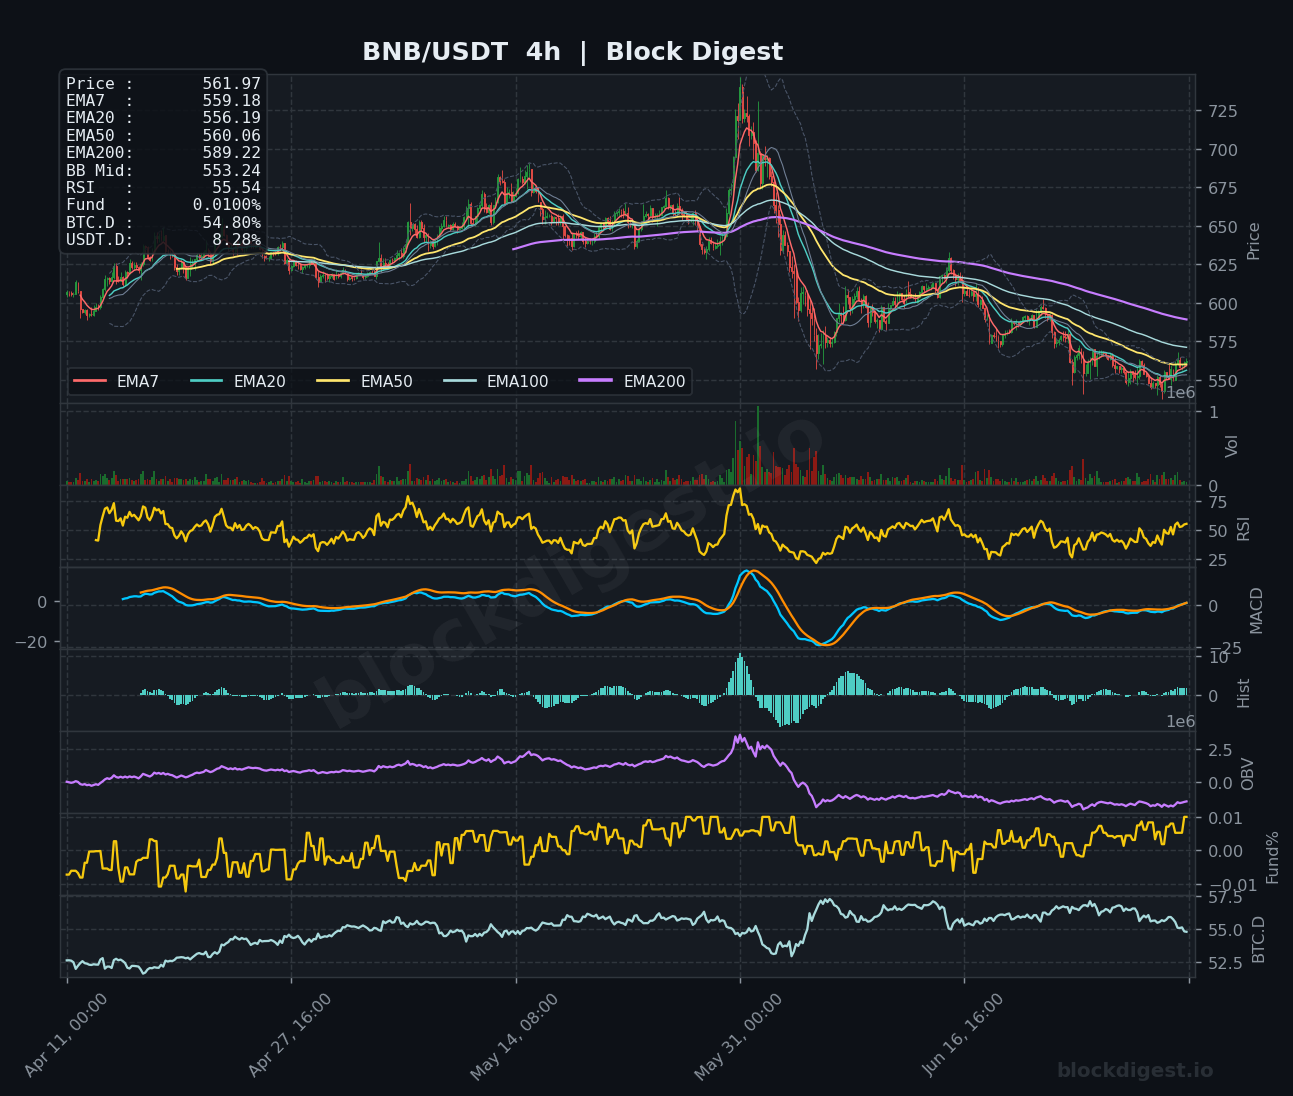
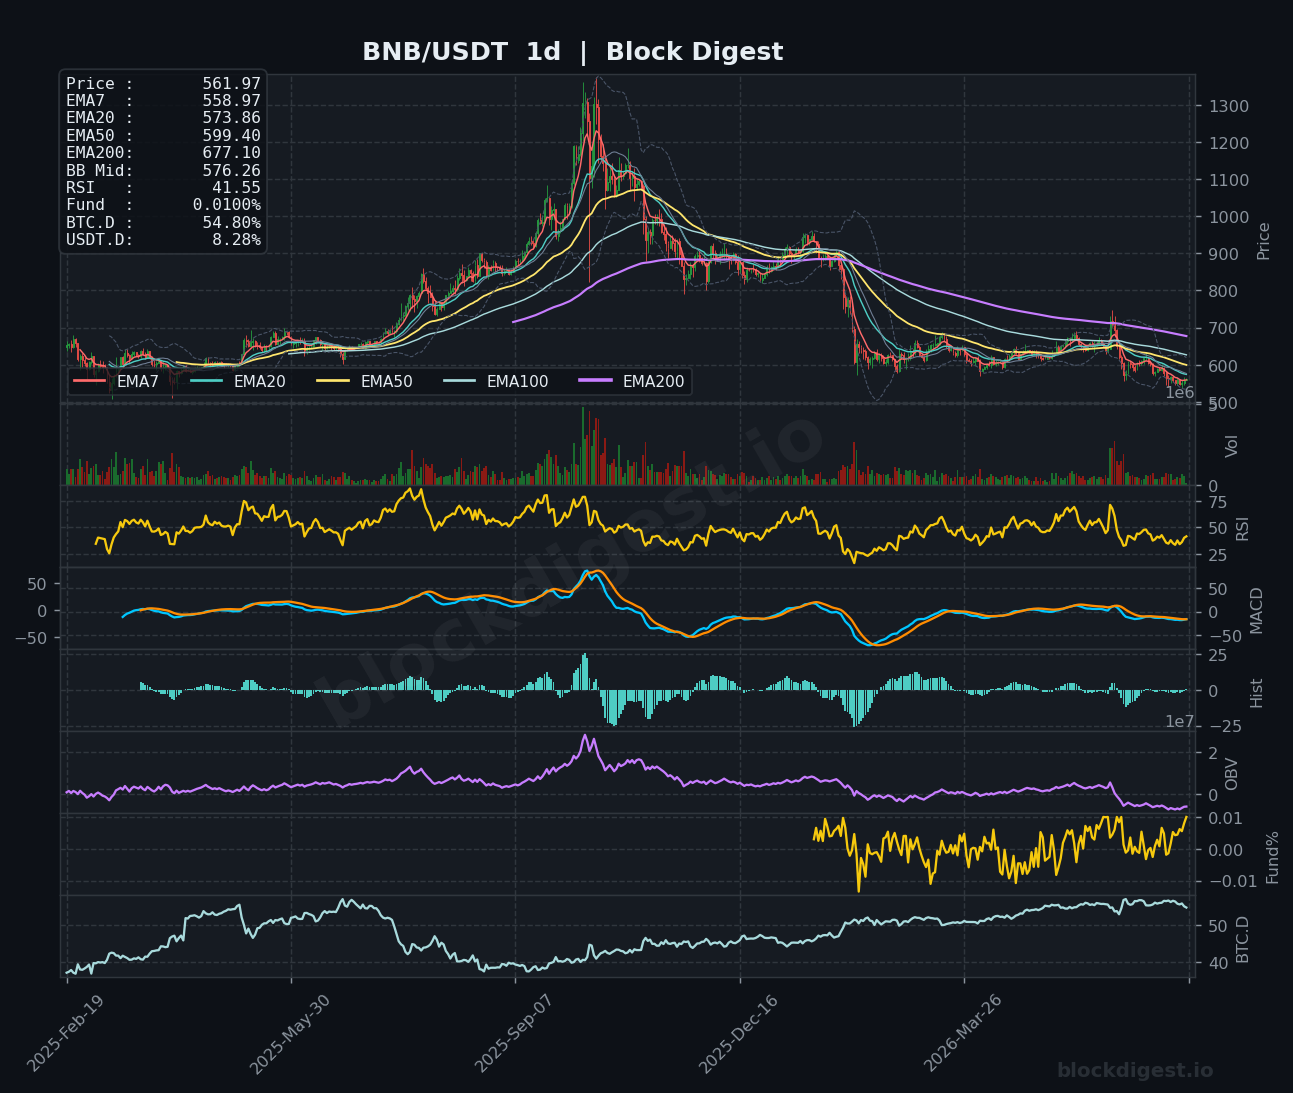
BNB is trading at $561.97, showing tentative stabilization after a sharp correction from highs near $725, with the 1-hour chart displaying a tightly compressed EMA structure — EMA7 at $561.49, EMA20 at $559.92, and EMA50 at $556.88 — all converging beneath price in what could be a base-building formation. The 1-hour RSI at 58.14 is neutral-to-mildly bullish, while the MACD has crossed positively with a rising histogram, suggesting short-term buying pressure is picking up. On the 4-hour chart, RSI has recovered to 55.54 and the MACD is attempting a bullish crossover from deeply negative levels, though the daily chart RSI at 41.55 and a bearish EMA alignment — with price trading below EMA20 ($573.86), EMA50 ($599.40), and EMA200 ($677.10) — underscores that the broader downtrend from all-time highs remains structurally intact. Key support sits at $545–$550, while a recovery above $580 would represent the first meaningful technical milestone; the short-term bias is neutral with a slight recovery lean, though sellers retain the advantage on higher timeframes.
Dogecoin (DOGE)
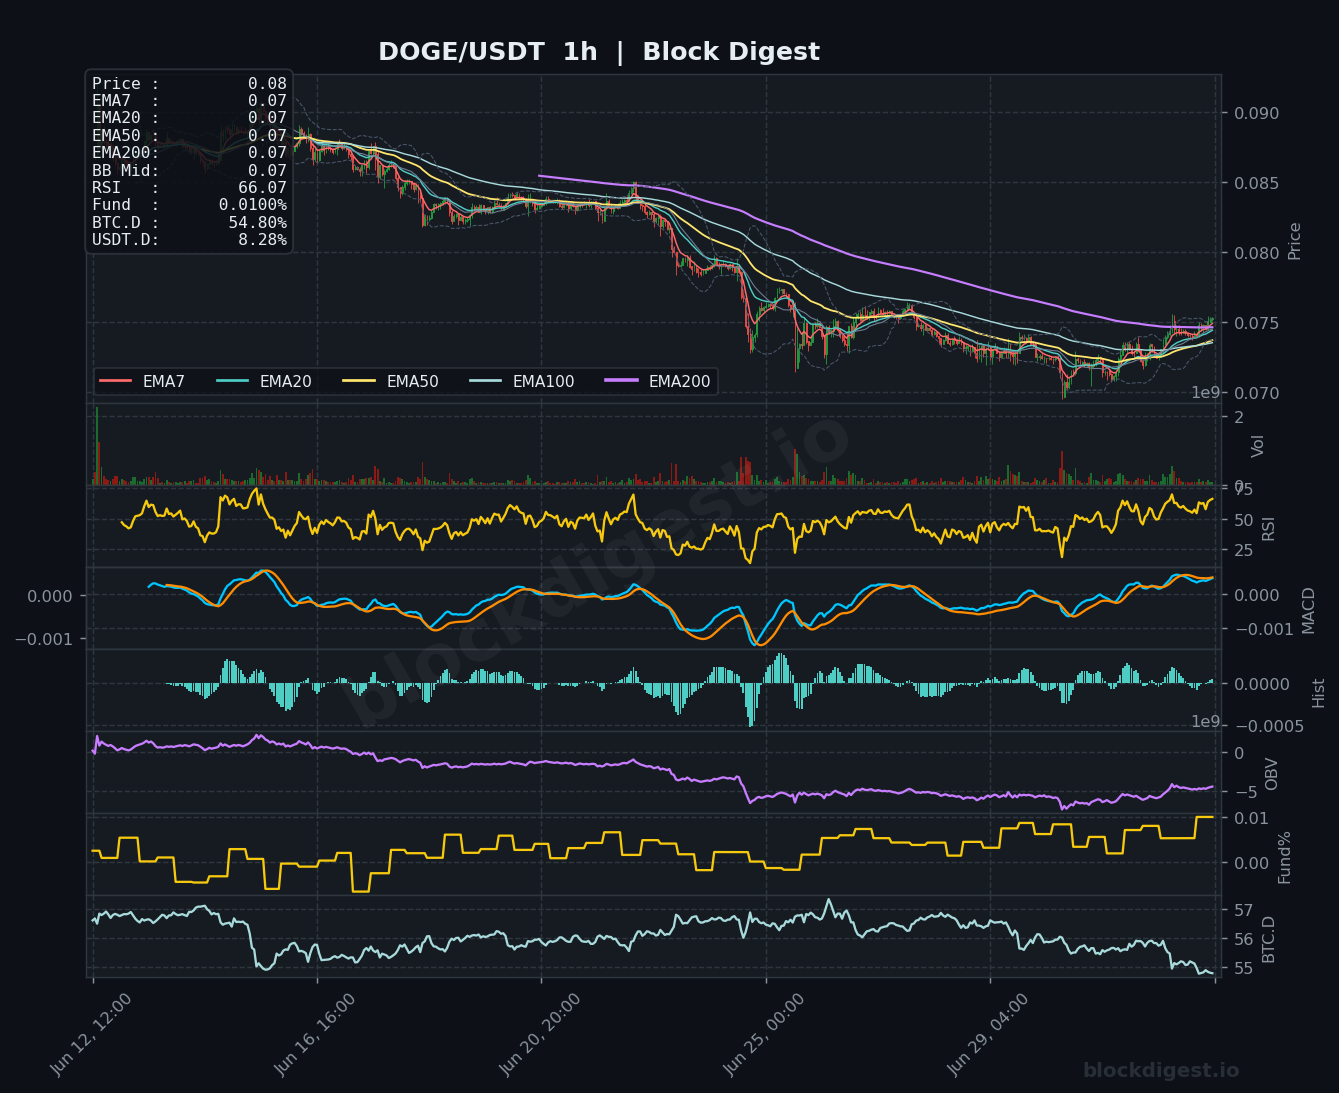
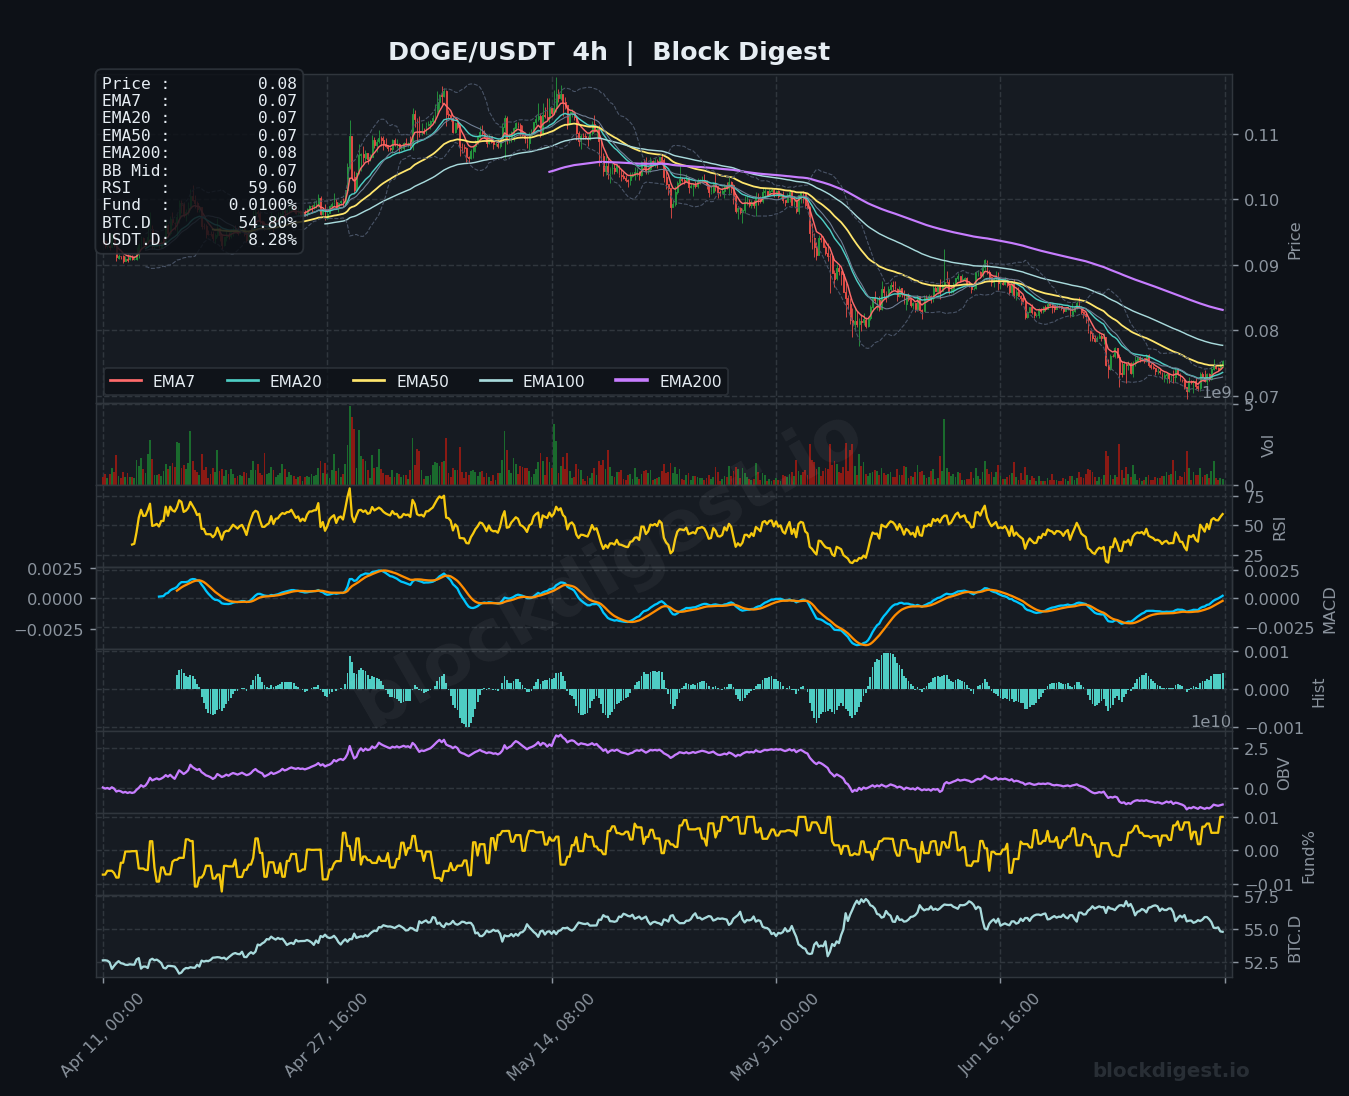
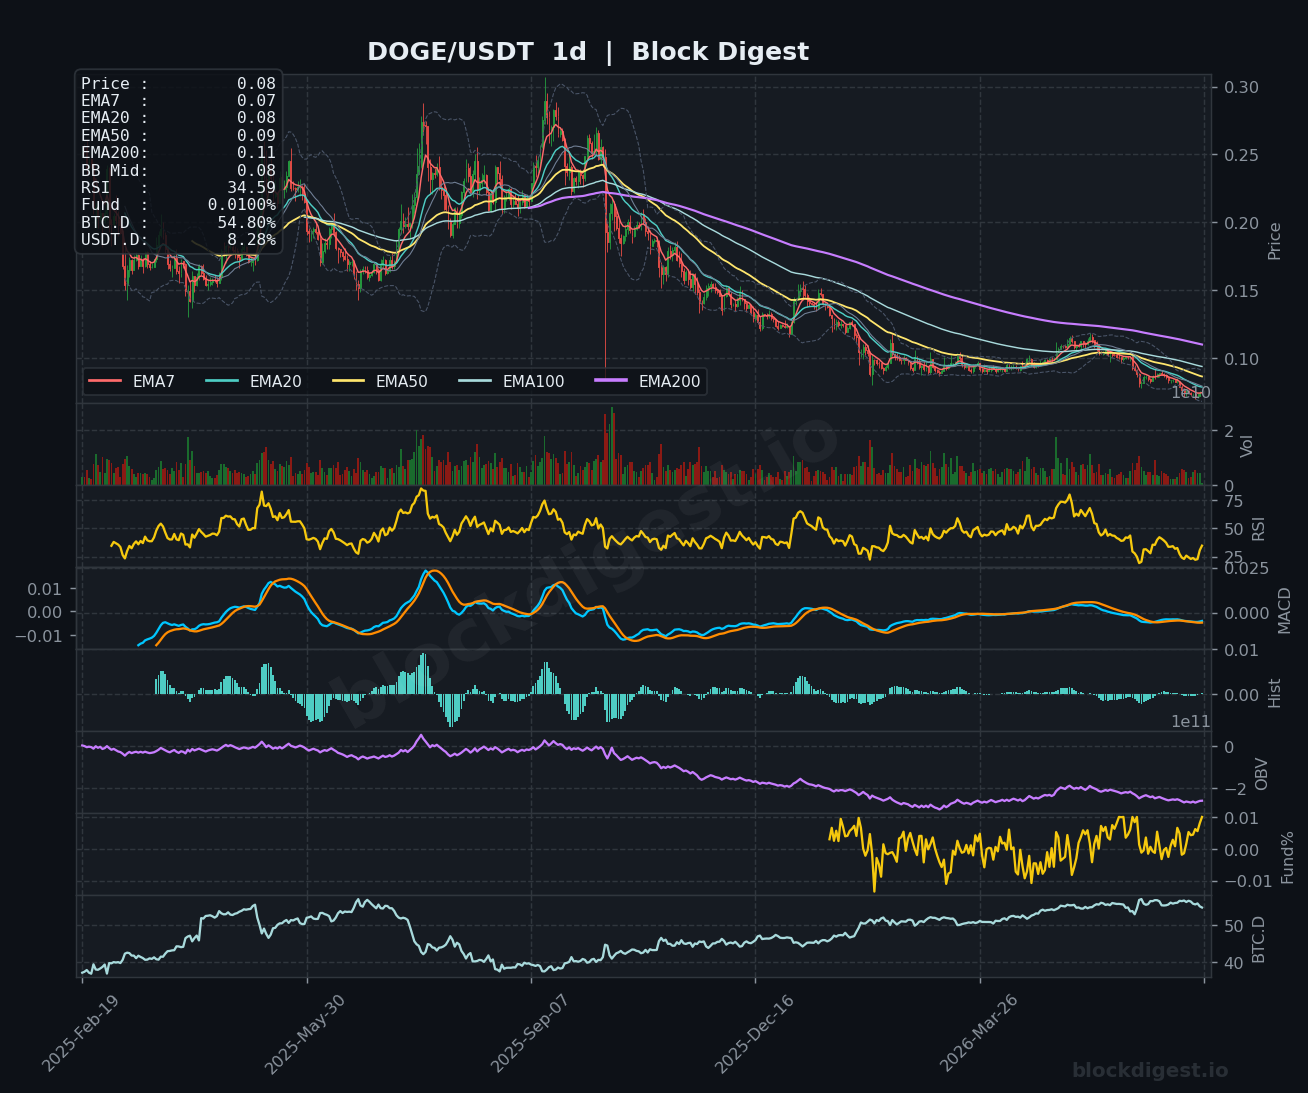
DOGE is trading at $0.0800, bouncing off recent lows near $0.0700 with the 1-hour chart showing a modest but emerging bullish EMA structure, though all EMAs remain tightly clustered around $0.07, reflecting a coin that has been in sustained compression. The 1-hour RSI at 66.07 is elevated for DOGE’s recent range and reflects momentum building in the near term, while the MACD has crossed bullishly with positive histogram bars accumulating — a mildly encouraging sign. The 4-hour RSI at 59.60 is recovering from deeply oversold levels, and the MACD is attempting a bullish cross from negative territory, although the OBV on both timeframes continues to trend downward, warning that volume does not yet confirm a durable reversal. The daily chart is the most concerning: RSI at 34.59 is approaching oversold territory, the MACD remains in a deep bearish cross, and price is trading below all major EMAs including a daily EMA200 at $0.11; bias is neutral-to-slightly bearish on all but the shortest timeframe, with $0.074 as the critical support floor to monitor.
Litecoin (LTC)
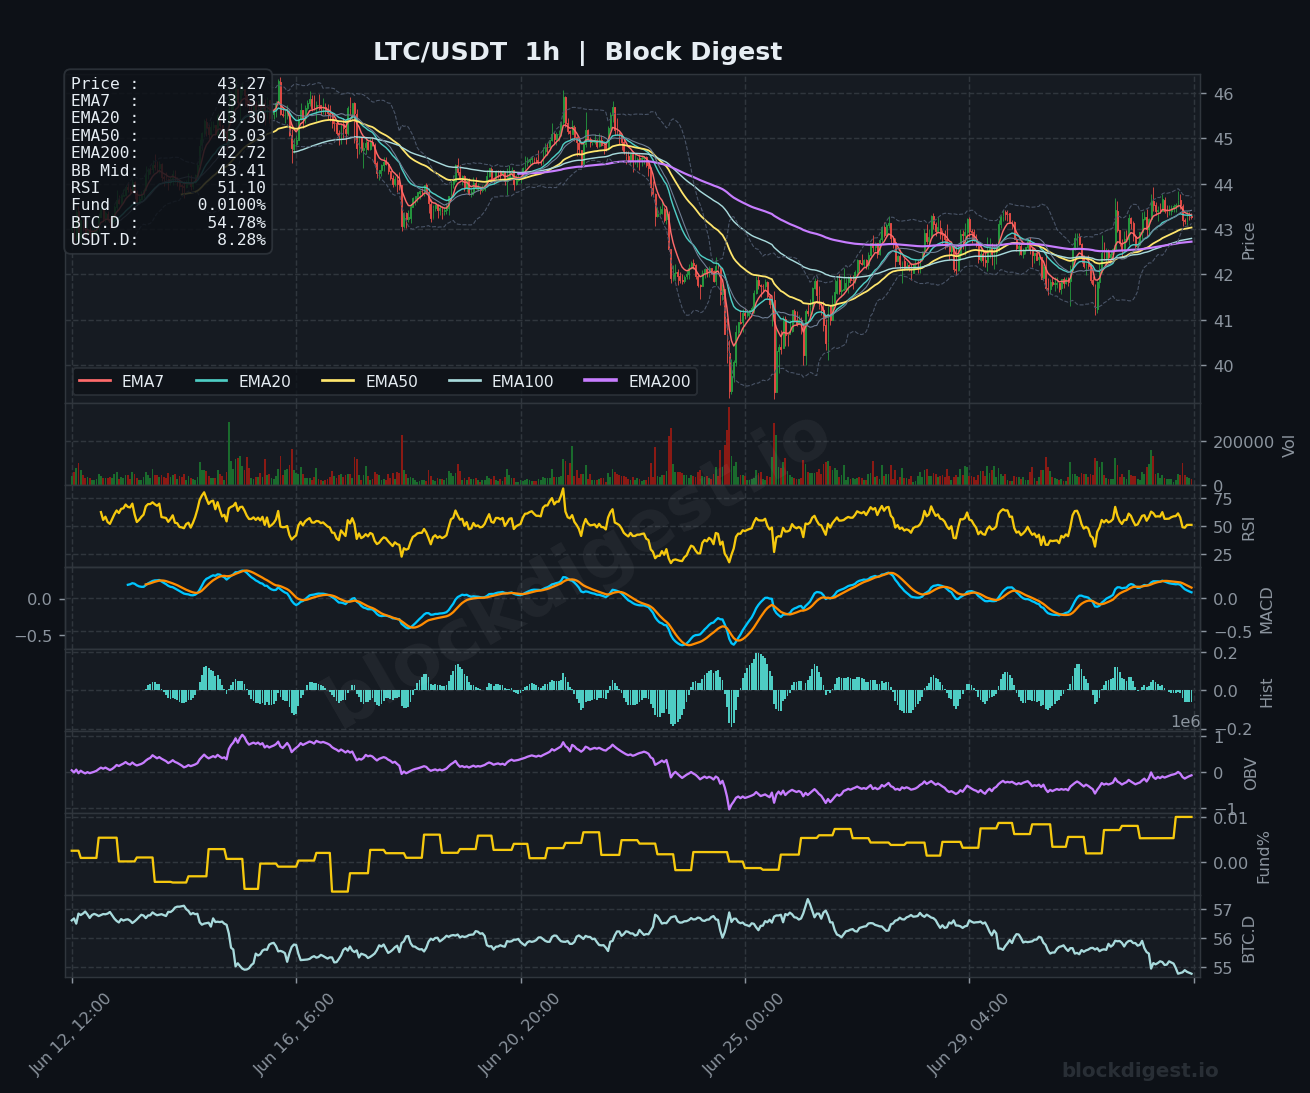
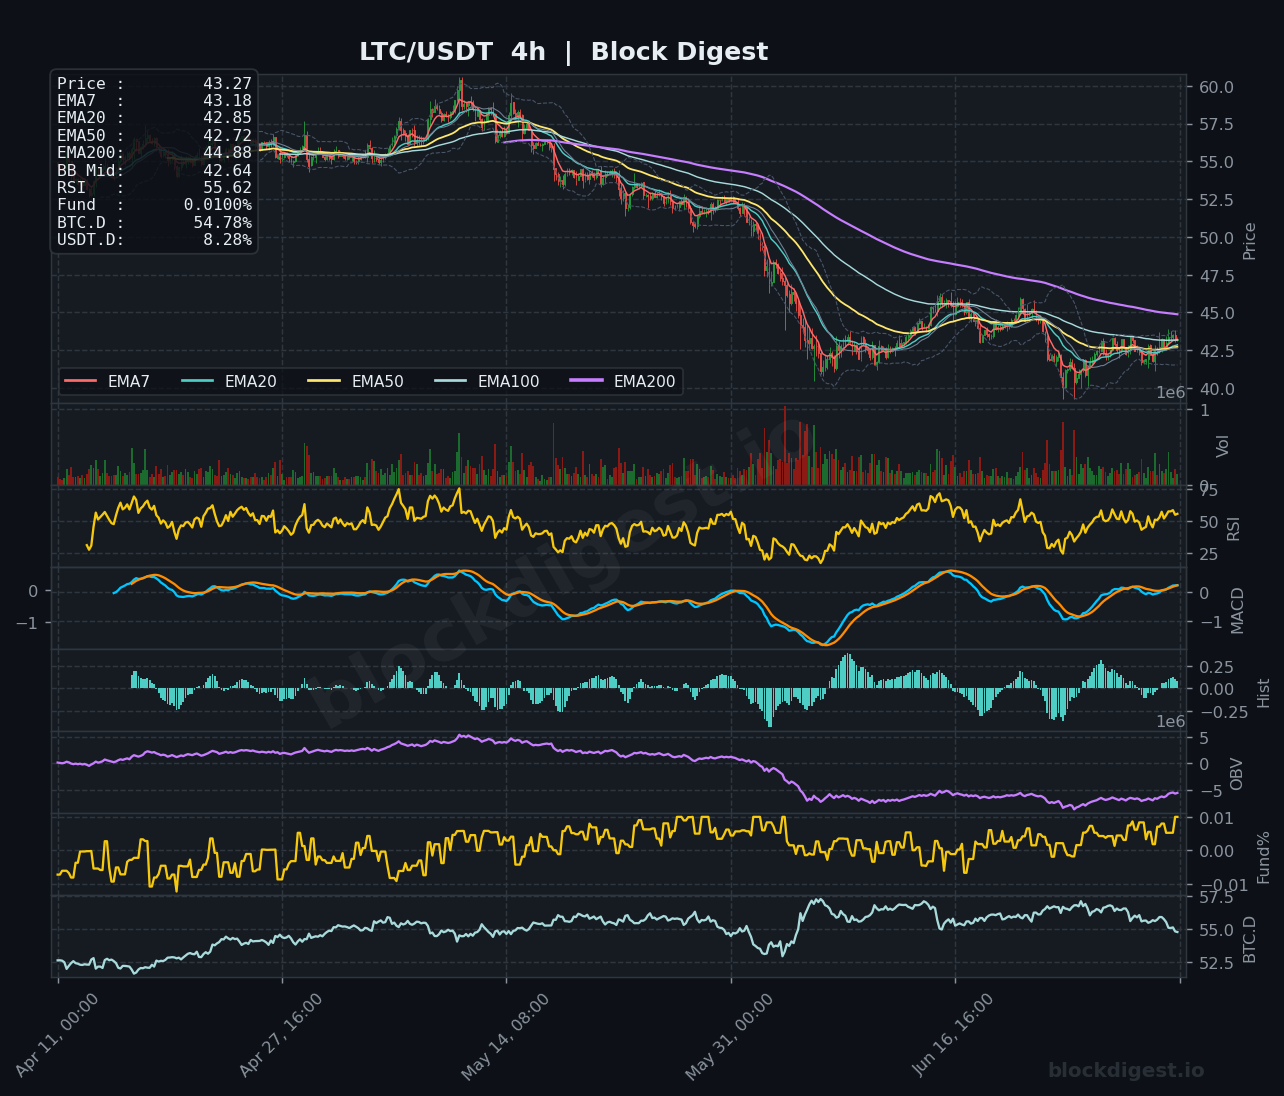
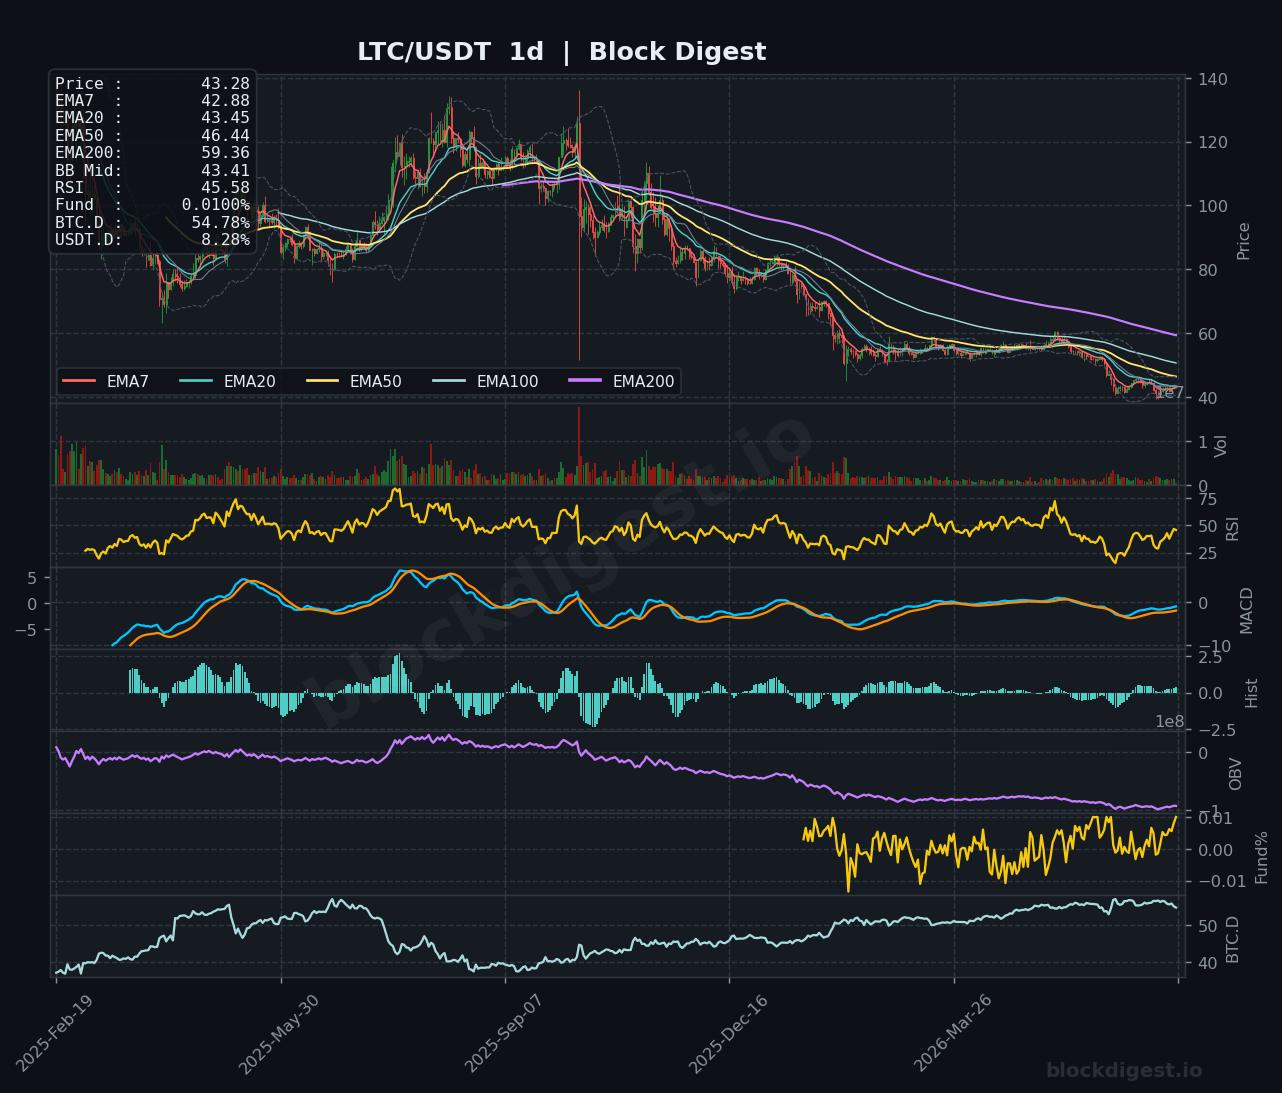
LTC is trading at $43.27, finding tentative footing after a steep decline from the $60-plus range, with the 1-hour chart showing a tightly coiled EMA cluster — EMA7 at $43.31, EMA20 at $43.30, EMA50 at $43.03 — that suggests price is consolidating just above a short-term equilibrium zone. The 1-hour RSI at 51.10 is essentially neutral, and the MACD is hugging the zero line with a very slight positive lean, indicating a coin that is caught between directional impulses and lacks clear conviction in either direction. On the 4-hour chart, the RSI has recovered to 55.62 from deeply oversold lows, and the MACD is attempting a bullish cross off a significant negative trough, which is historically a medium-term buy signal — though confirmation is still needed and the histogram bars are small. The daily chart RSI at 45.58 and the heavily bearish EMA stack — with EMA200 at $59.36 towering above current price — confirm that LTC remains in a macro downtrend; key support is $40–$41, and the short-term bias is neutral with range-bound conditions likely to persist absent a broader market catalyst.
TRON (TRX)
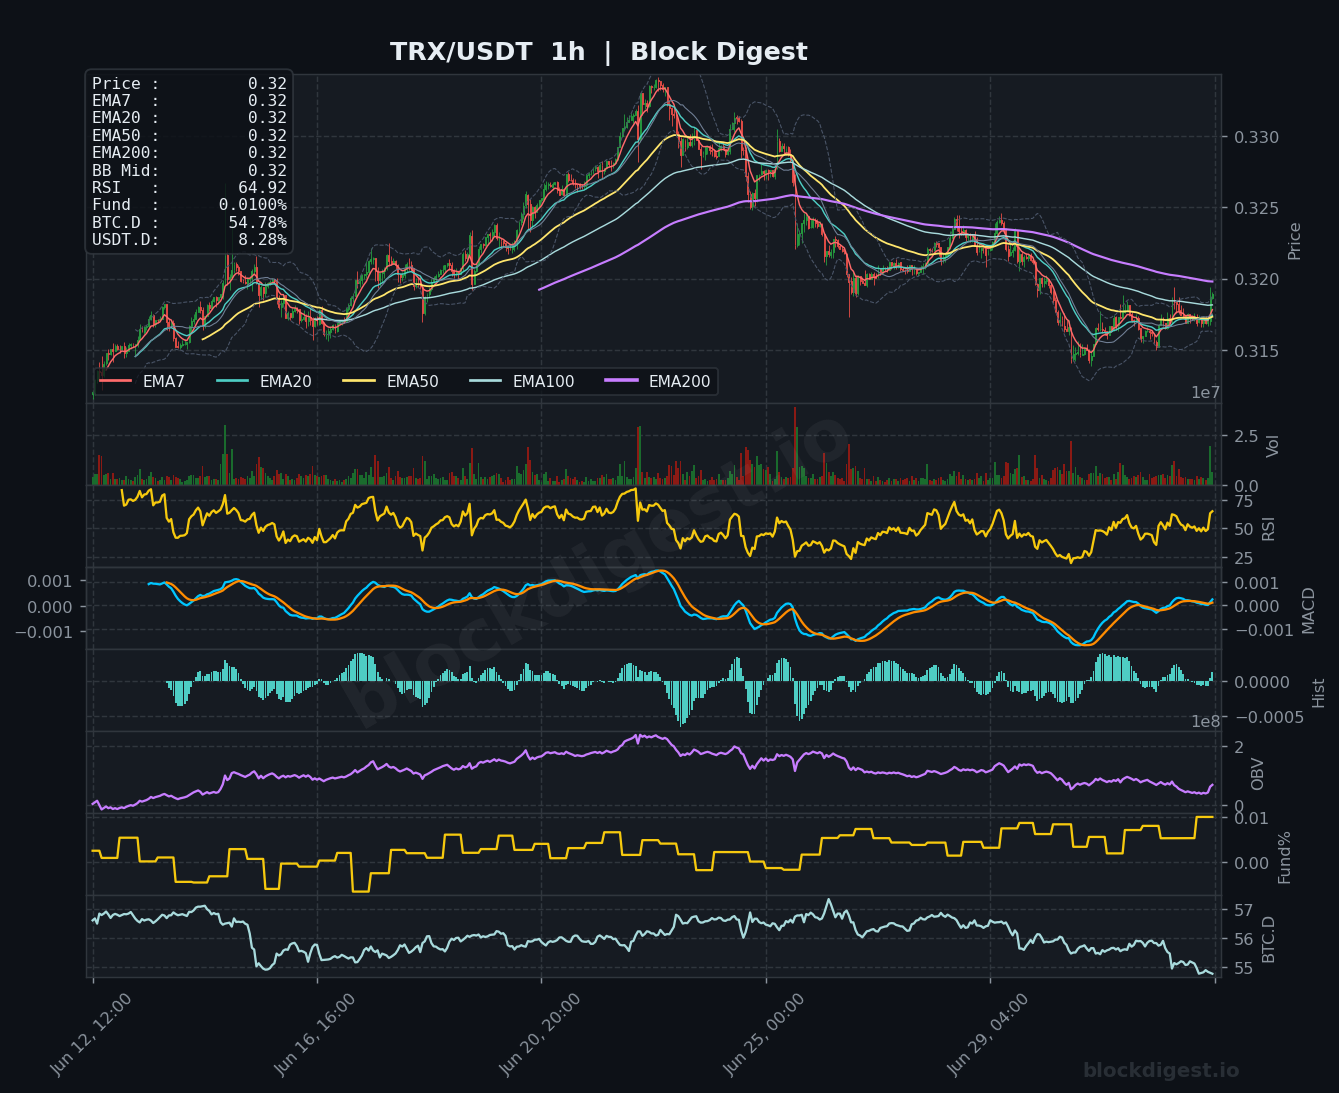
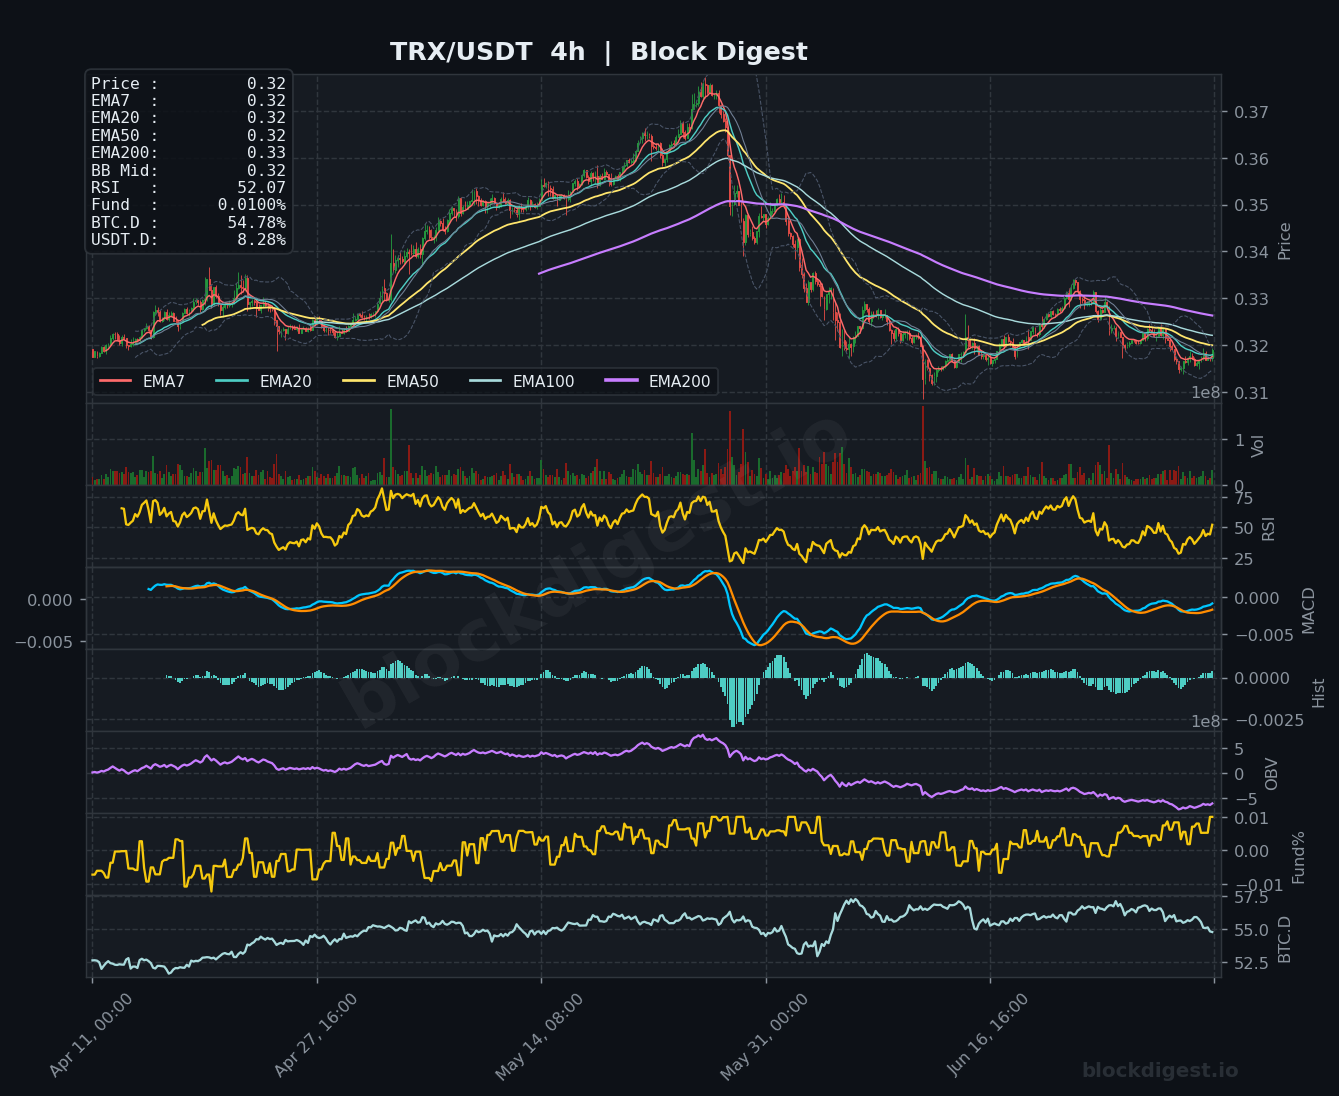
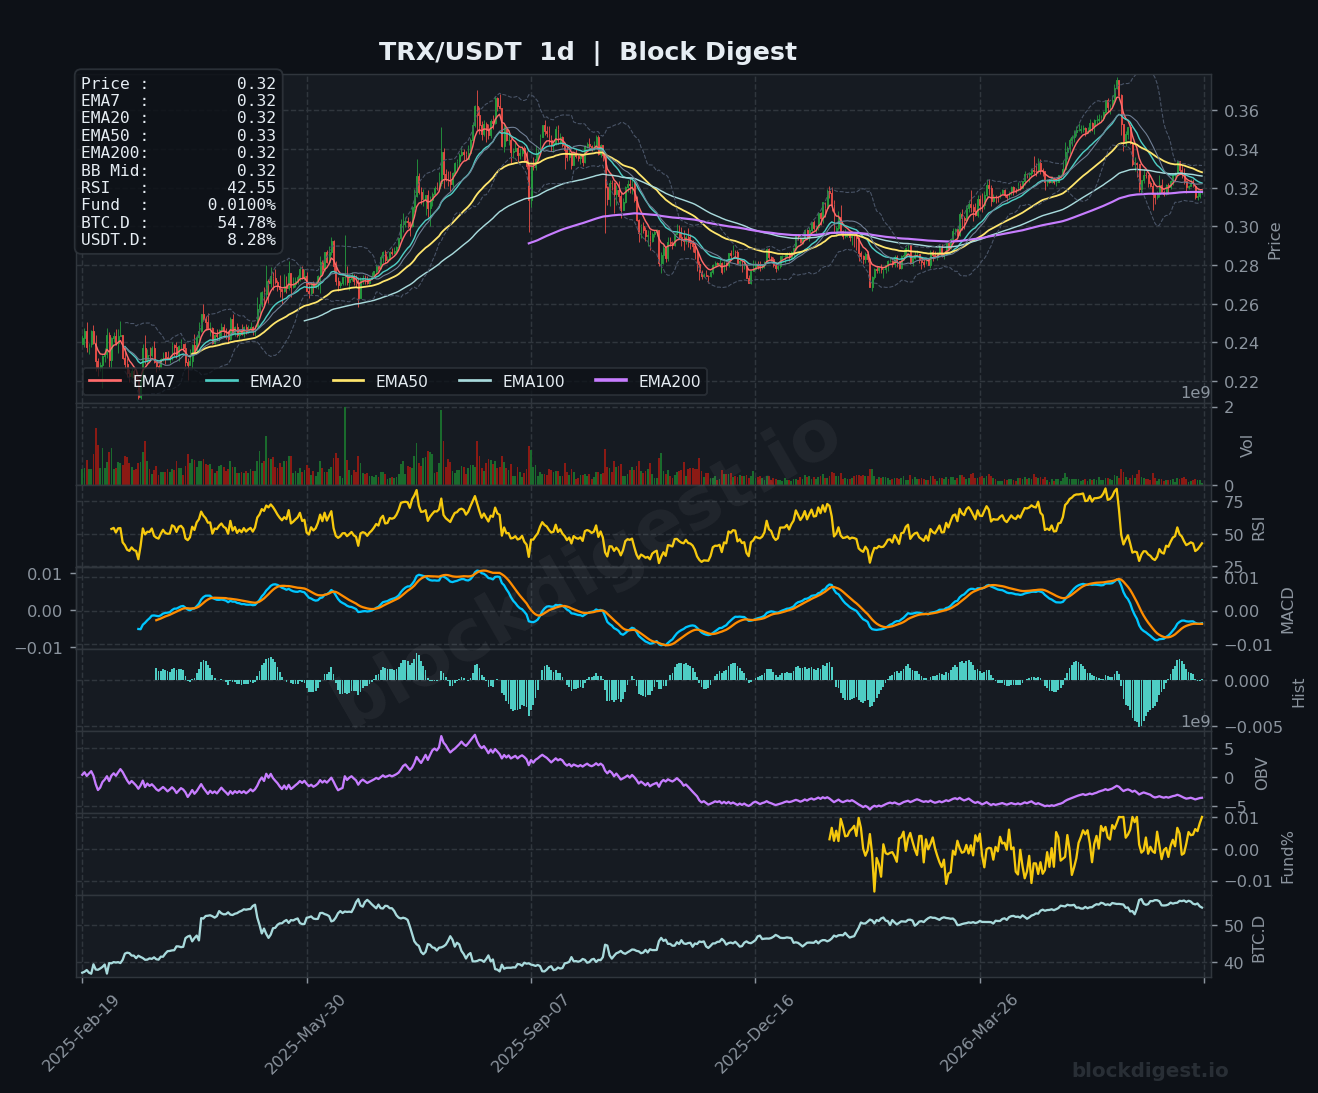
TRX is trading at $0.32, demonstrating notably relative strength compared to peers, as the daily chart reveals a coin that rallied from the $0.27 range to a recent high near $0.36 before pulling back to consolidate at current levels — a corrective phase rather than a structural breakdown. The 1-hour RSI at 64.92 is bullish-leaning and the MACD has crossed positively, with the OBV on the hourly chart holding up better than most coins in today’s roundup, reflecting steady accumulation. On the 4-hour chart, RSI at 52.07 is recovering cleanly from oversold lows seen during the recent correction, and while the MACD remains in mild negative territory, the histogram is compressing and turning, suggesting a bullish cross may be imminent. The daily chart presents the most interesting setup: price is trading above the daily EMA200 at $0.32 — a key distinction that separates TRX from every other coin in this review — and while the daily RSI at 42.55 has room to recover, the MACD being in a shallow negative cross on the daily is the primary risk; bias is cautiously bullish with $0.315 as immediate support and $0.335 as near-term resistance.
Altcoin Outlook
As of July 3, 2026, the altcoin landscape is a study in bifurcation: SOL and TRX represent the strongest setups in today’s coverage, with SOL benefiting from both technical momentum and a powerful fundamental narrative in the Alpenglow upgrade, while TRX is the only coin currently trading above its daily EMA200 — a rare distinction in the current macro environment. BNB and XRP sit in a middle ground, showing early short-term recovery signals that lack daily-timeframe confirmation, making them candidate setups for traders who require patience before adding exposure. D
Disclaimer: This analysis is for informational purposes only and does not constitute financial advice. Cryptocurrency markets are highly volatile and unpredictable. All trading decisions should be made based on your own research and risk tolerance. Block Digest is not responsible for any financial losses incurred as a result of acting on this content.
Stay Ahead of the Market
Follow BlockDigest for crypto market intelligence, research and real-time updates.


