Bitcoin Daily Analysis: BTC Tests EMA20 and Bollinger Band Midline
Market Overview
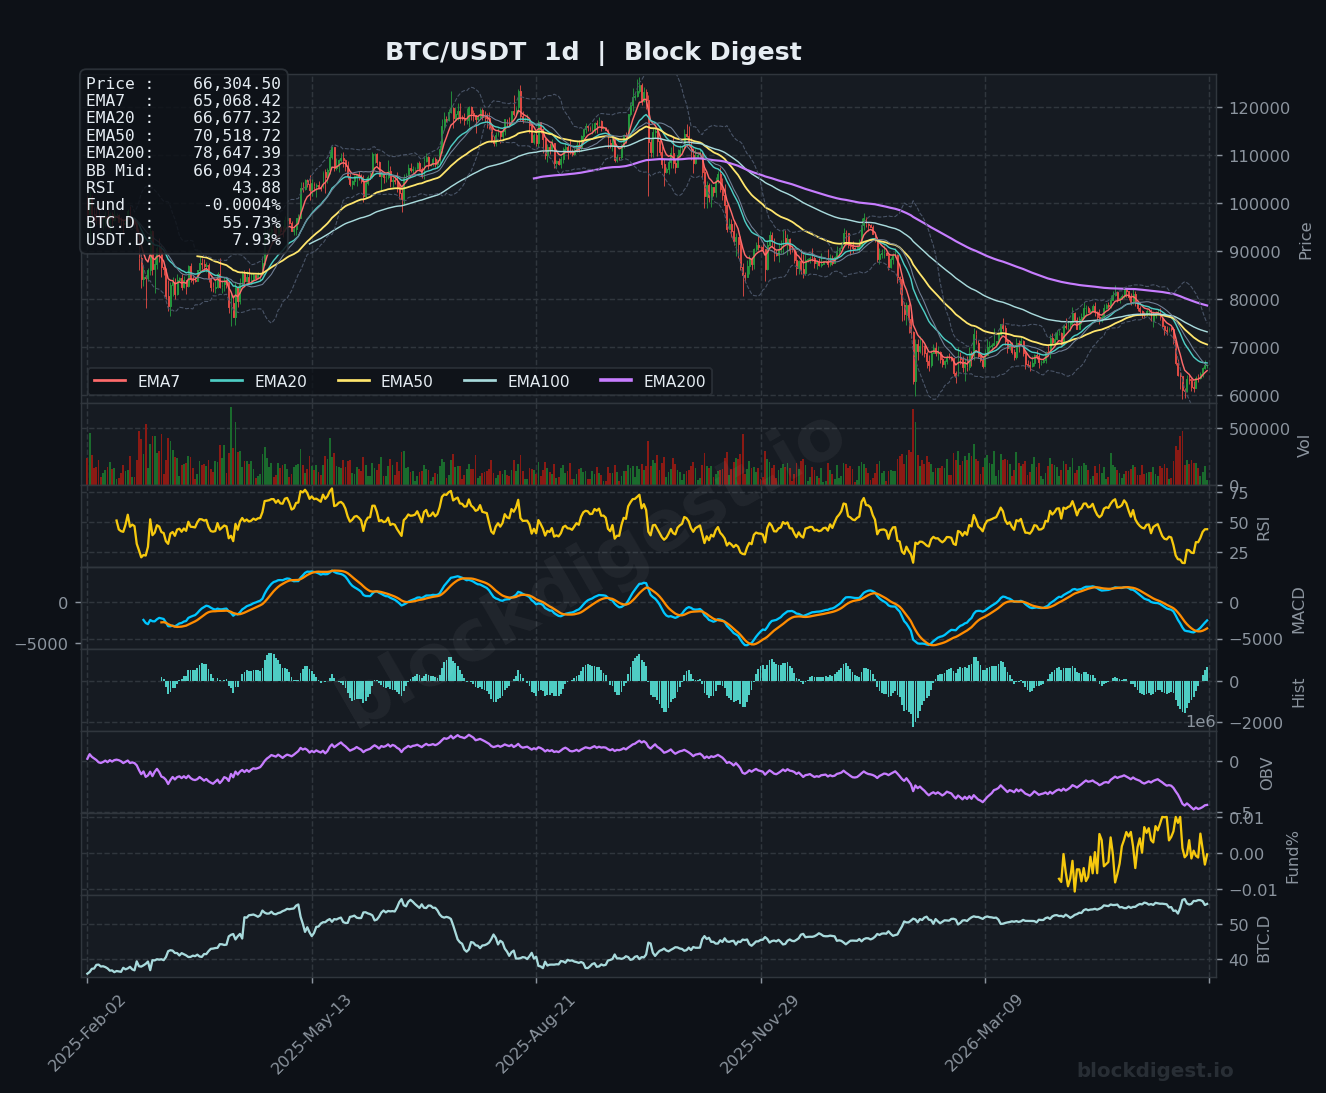
BTC/USDT is currently trading at approximately $66,300, navigating a technically precarious zone following a significant multi-month correction from all-time highs above $100,000. On the daily timeframe, price sits just below the EMA20 ($66,677) and is testing the Bollinger Band midline ($66,094), suggesting the market is at a pivotal inflection point rather than in a confirmed trend. The dominant daily structure remains bearish — price is well beneath both the EMA50 ($70,519) and EMA200 ($78,647) — though a notable recovery bounce from lows near $60,000 has been underway. The daily RSI at 43.88 reflects subdued momentum that has not yet crossed into bullish territory, consistent with a recovery attempt rather than a trend reversal.
Multi-Timeframe Confluence
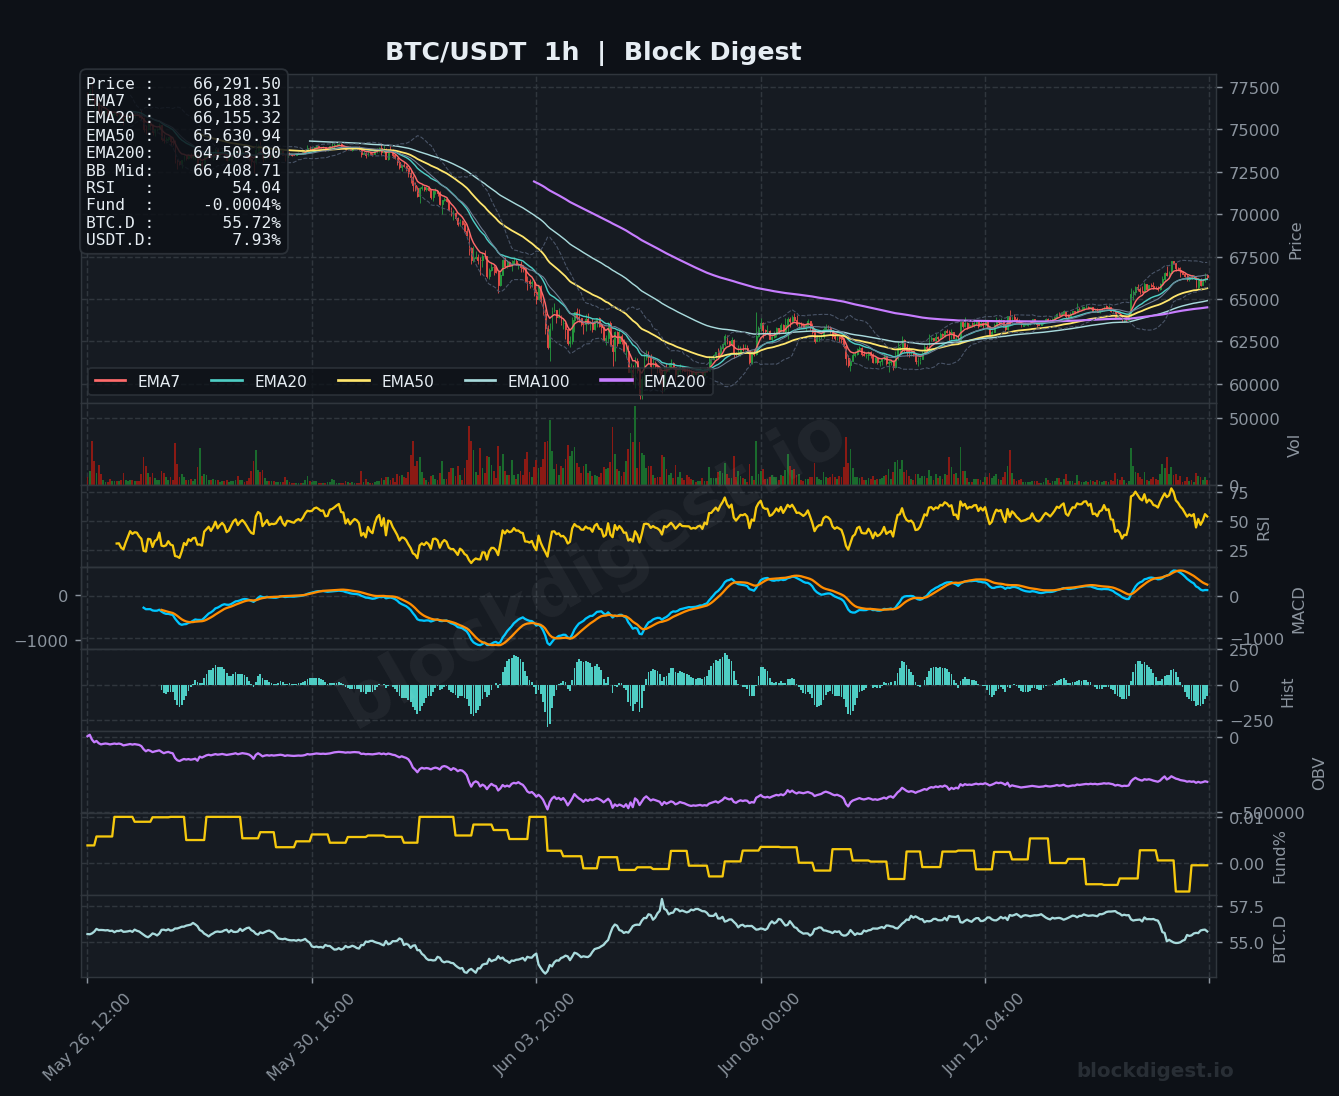
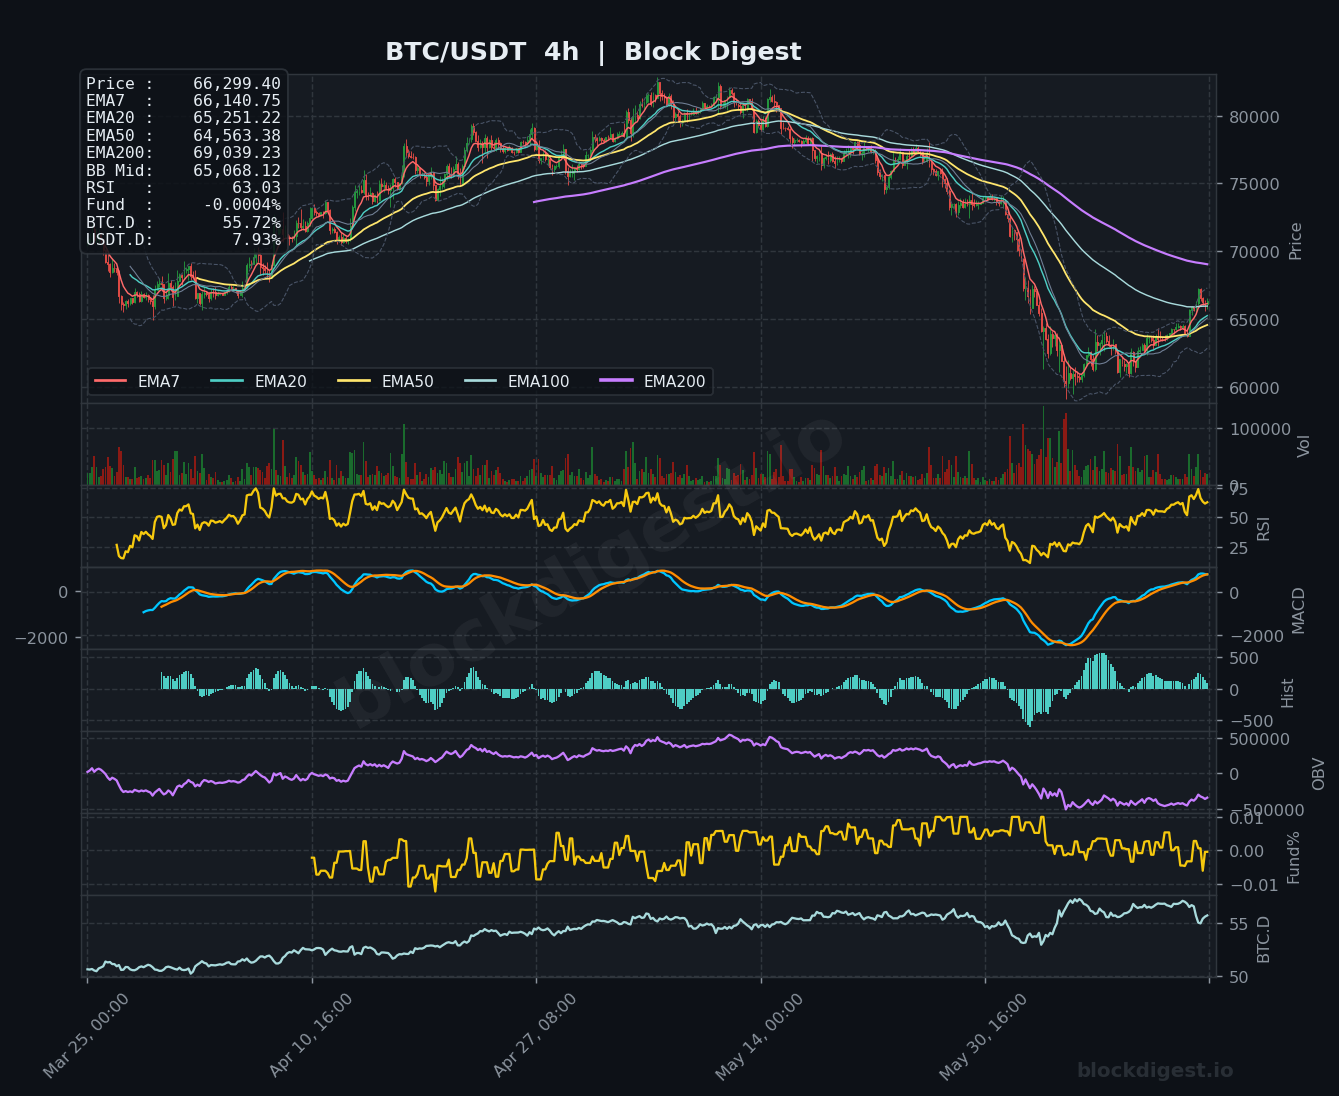
The 1-hour chart shows short-term bullish structure intact, with price trading above EMA7 ($66,188), EMA20 ($66,155), EMA50 ($65,631), and EMA200 ($64,504) — a fully bullish EMA stack on the lower timeframe. The 4-hour chart corroborates short-term strength, with RSI pushing to 63.03 and price above EMA7 ($66,141) and EMA20 ($65,251), though the EMA200 ($69,039) remains a significant overhead barrier. However, the daily timeframe diverges meaningfully — the bearish EMA cascade (EMA50 at $70,519 through EMA200 at $78,647) continues to suppress recovery, meaning lower-timeframe bullishness is operating against a higher-timeframe headwind. The $66,600–$67,000 zone, where the daily EMA20 and upper Bollinger Band converge, represents the most immediate confluence resistance.
Key Levels to Watch
- Resistance: $66,677 — Daily EMA20, the first meaningful overhead test that has capped recent recovery attempts and defines short-term trend direction
- Resistance: $69,039 — 4H EMA200, a structurally significant level marking the boundary between recovery and a more meaningful trend shift
- Resistance: $70,519 — Daily EMA50, the key medium-term barrier; reclaiming this level would significantly alter the bearish thesis
- Support: $65,631 — 1H EMA50, immediate intraday support providing a first line of defense on any pullback
- Support: $64,504–$65,068 — Confluence of the 1H EMA200 and daily EMA7, a critical buffer zone where price must hold to maintain the current recovery structure
- Support: $62,500–$63,000 — Prior consolidation base visible on the 1H chart; breakdown below this area would signal renewed selling pressure
Momentum & On-Chain Signals
The RSI profile across timeframes tells a diverging story: the 1H RSI at 54.04 is neutral-to-mildly bullish, the 4H RSI at 63.03 indicates building momentum without being overbought, but the daily RSI at 43.88 remains below the 50 midline, confirming the broader trend has not flipped constructive. The 4H MACD shows a bullish crossover in progress with the histogram printing positive green bars, while the daily MACD lines remain in bearish territory though narrowing — a potential early signal of trend exhaustion to the downside. OBV on the daily timeframe has continued to decline despite the price bounce, representing a notable bearish divergence and suggesting that the current recovery is not being supported by meaningful accumulation volume. Funding rates at -0.0004% are essentially flat, indicating the market is not heavily leveraged in either direction and reducing the risk of a forced liquidation cascade.
BTC Dominance & Market Sentiment
BTC dominance currently sits at 55.72%–55.73%, holding near multi-year highs and reflecting continued risk-off behavior within the crypto market — capital remains concentrated in Bitcoin rather than rotating into altcoins. USDT dominance at 7.93% remains elevated, indicating a meaningful portion of market participants are still sitting in stablecoins rather than deploying capital, which could serve as dry powder for a rally but also signals sustained caution. Together, these readings suggest the broader market has not yet entered a risk-on phase, which tempers the bullish case for an aggressive BTC breakout in the near term.
Risk Scenarios
- Bullish case: A confirmed daily close above the EMA20 at $66,677, accompanied by rising 4H OBV and RSI holding above 60, would open a path toward the $69,000–$70,500 range. Sustained volume expansion on upside candles would strengthen conviction that the recovery is transitioning into a genuine trend reversal.
- Bearish case: Rejection at the $66,677–$67,000 resistance band and a breakdown below the 1H EMA200 at $64,504 would signal the bounce has exhausted, targeting a retest of the $62,500 support zone. A daily close beneath $64,000 would materially reinforce the broader bearish structure and potentially expose the $60,000 psychological level.
Outlook
The near-term bias is cautiously neutral with a slight bullish lean on the lower timeframes, contingent on BTC’s ability to sustain above the critical $65,000–$65,600 support cluster over the next 24–48 hours. The most important trigger to monitor is whether price can achieve a decisive daily close above $66,677 (daily EMA20) — failure here would suggest the current rally is a corrective bounce within a larger downtrend. The persistent bearish divergence on daily OBV is the most significant concern, as it undermines confidence in the recovery’s sustainability despite constructive short-term price action. Traders should remain aware that the macro structure is still bearish until EMA50 at $70,519 is reclaimed, and position sizing should reflect the elevated uncertainty at this inflection point.
Disclaimer: This analysis is for informational purposes only and does not constitute financial advice. Cryptocurrency markets are highly volatile and unpredictable. All trading decisions should be made based on your own research and risk tolerance. Block Digest is not responsible for any financial losses incurred as a result of acting on this content.