ETH Daily Analysis — April 27, 2026
Market Overview
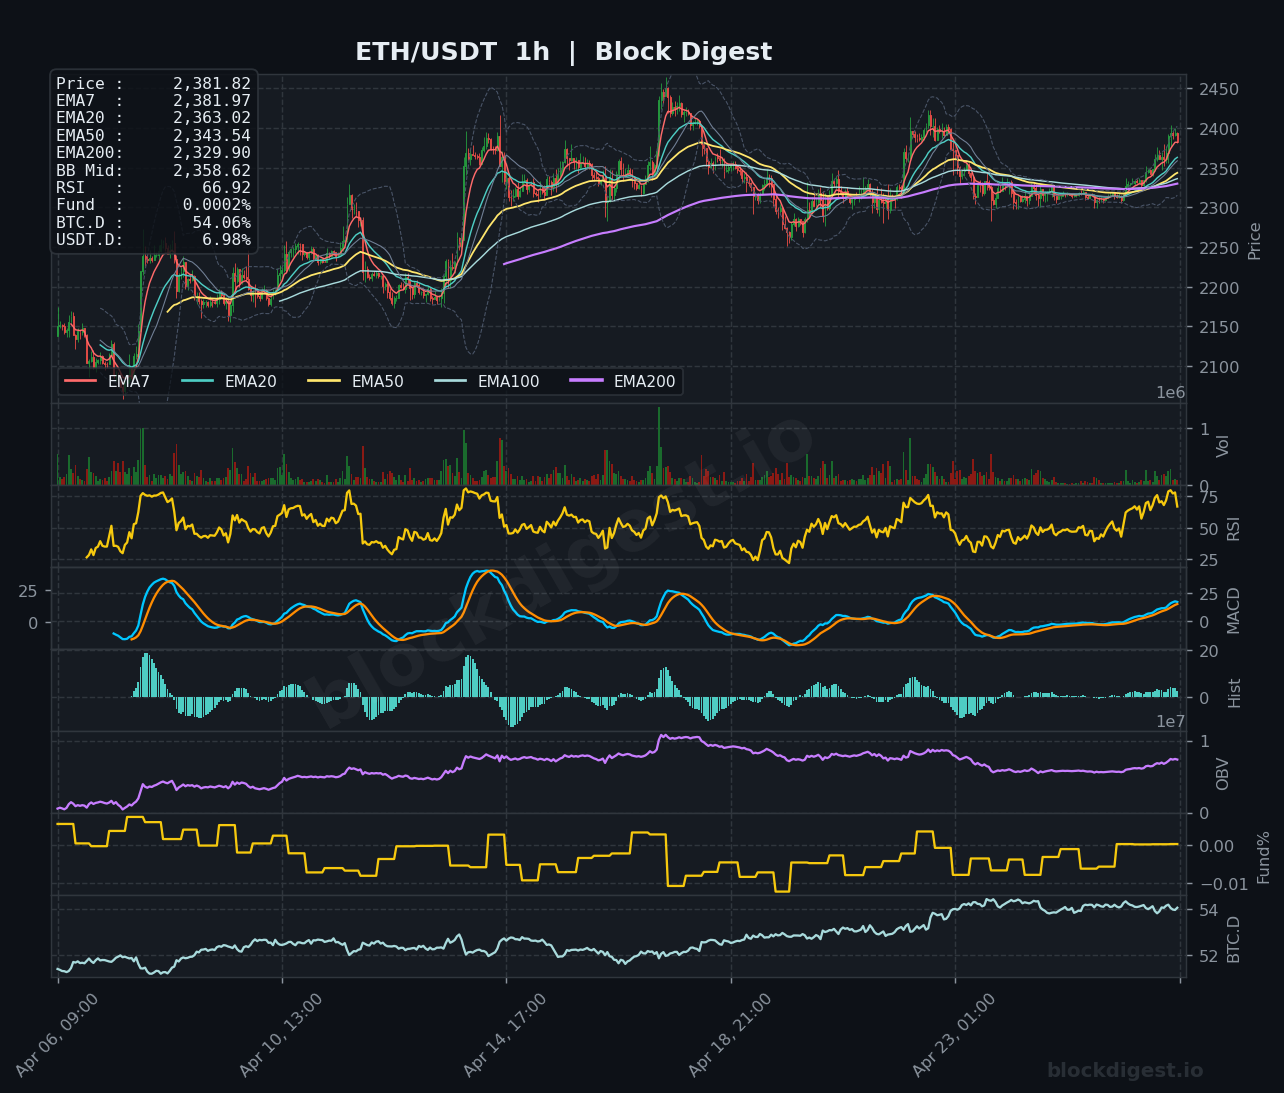
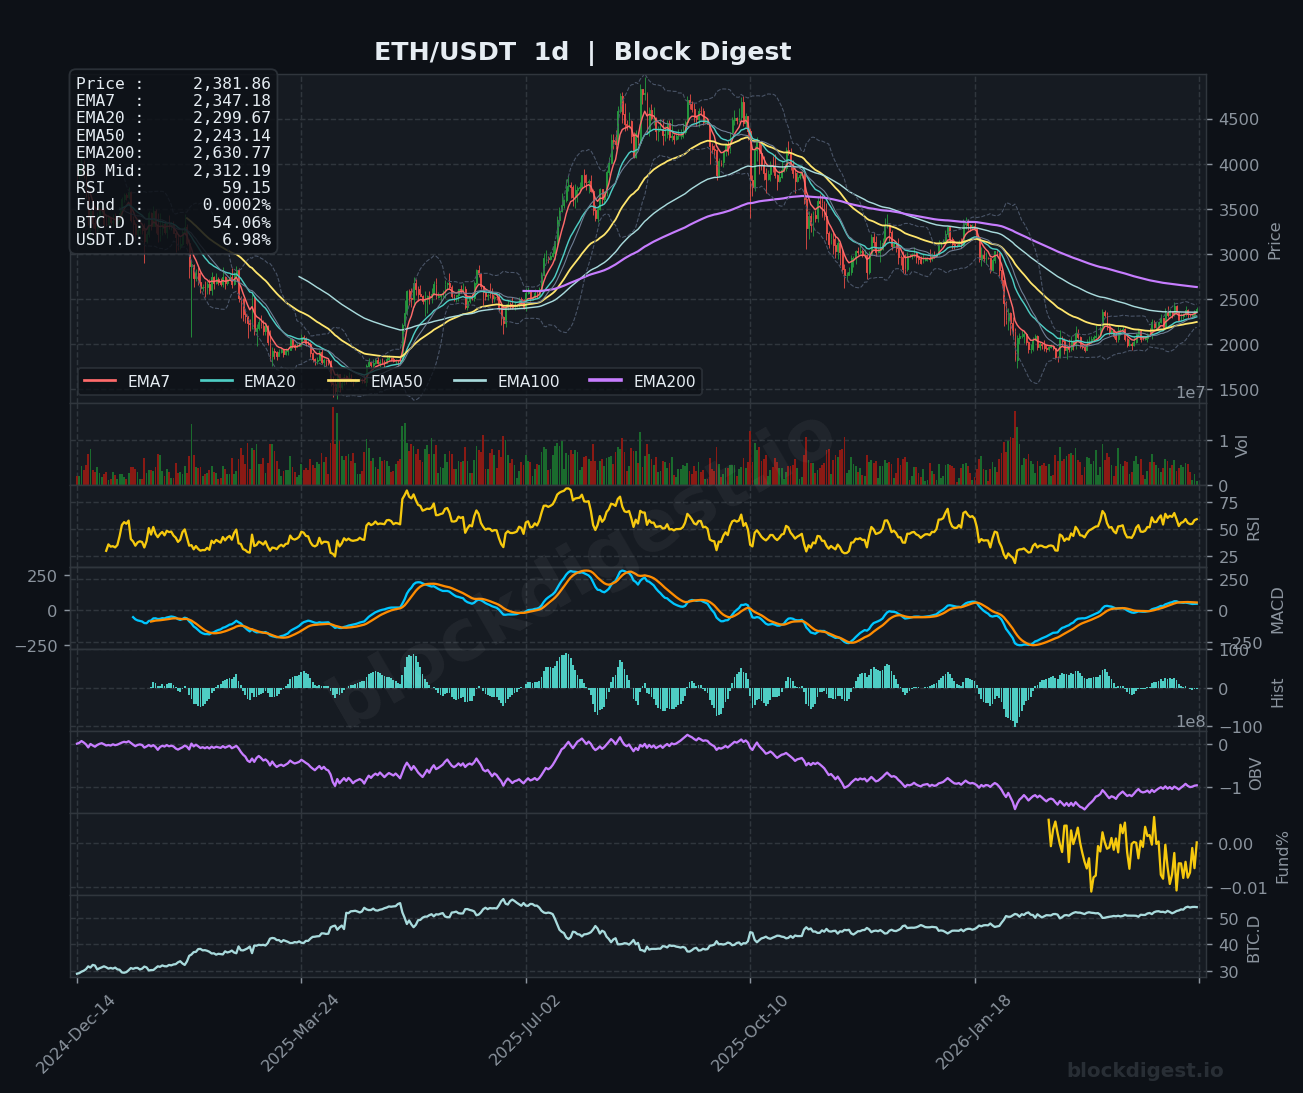
Ethereum is trading at $2,381.82, positioned in a neutral consolidation zone as price action remains compressed between key moving averages. The daily chart shows ETH currently trading below the EMA20 ($2,299.67) and EMA50 ($2,243.14) but above the rising EMA200 ($2,630.77), indicating a medium-term bearish structure with recent recovery attempts. On the 1-hour timeframe, price is testing above all short-term EMAs with the EMA7 at $2,381.97 acting as immediate support, while Bollinger Bands are contracting across all timeframes, suggesting an impending volatility expansion. The overall structure suggests ETH is in a transitional phase following an extended downtrend, with bulls attempting to establish a foothold above the $2,300 region.
Multi-Timeframe Confluence
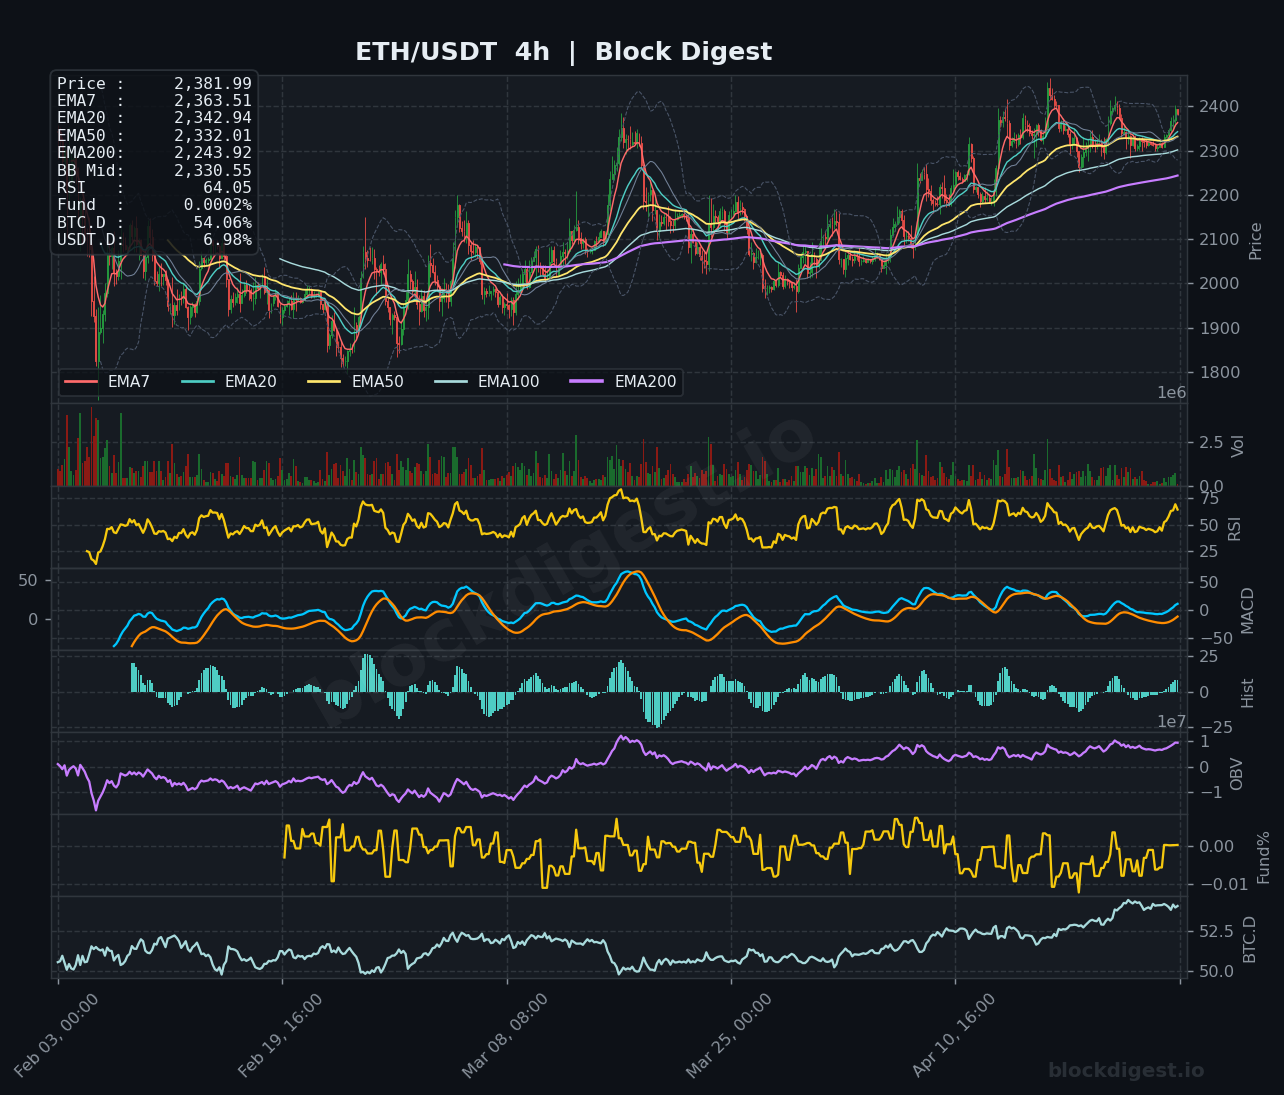
The 1-hour chart displays a tentative bullish micro-structure with price breaking above the EMA20 ($2,363.02) and testing the upper Bollinger Band near $2,358.62, signaling short-term momentum favor. However, the 4-hour timeframe reveals price is still contained within a consolidation range, trading just above the EMA50 ($2,332.01) but facing resistance from the EMA20 ($2,342.94), creating conflicting signals between immediate strength and intermediate hesitation. The daily timeframe confirms the broader challenge, with ETH still well below the declining EMA7 ($2,347.18) and EMA20 ($2,299.67), suggesting any rally must overcome significant overhead resistance to validate a trend reversal. This multi-timeframe divergence indicates scalpers may find short-term opportunities, but swing traders should await confirmation of a sustained break above $2,400 on the daily close.
Key Levels to Watch
- Resistance:
- $2,400-$2,420: This zone represents the recent swing high visible on all timeframes and coincides with the 4-hour EMA7 ($2,363.51) expansion area, serving as the first critical hurdle for bulls
- $2,450-$2,475: Daily chart resistance cluster where previous consolidation occurred, aligning with upper Bollinger Band projections on the 4-hour chart
- $2,550-$2,600: Major resistance zone marking the breakdown region from the prior structure and approaching the daily EMA200 at $2,630.77
- Support:
- $2,350-$2,360: Immediate support zone corresponding to the 1-hour and 4-hour EMA20 levels, critical for maintaining the current bullish micro-structure
- $2,300-$2,330: Major support cluster aligning with the daily EMA20 ($2,299.67), 4-hour EMA50 ($2,332.01), and lower Bollinger Band on the daily chart at $2,312.19
- $2,200-$2,240: Strong demand zone marked by the daily EMA50 ($2,243.14) and previous consolidation floor, representing the last line of defense before a retest of lower levels
Momentum & On-Chain Signals
RSI readings across timeframes show mild bullish divergence, with the 1-hour RSI at 66.92 approaching overbought territory, the 4-hour RSI at 64.05 confirming momentum expansion, while the daily RSI remains neutral at 59.15, suggesting room for upside without being extended. The MACD histogram on all three timeframes shows positive momentum, with the 1-hour and 4-hour charts displaying bullish crossovers and expanding histograms, though the daily MACD remains relatively flat, indicating early-stage momentum that hasn’t yet translated to the higher timeframe. OBV trends show gradual accumulation on the daily chart following the recent bottom, supporting the notion of buyer absorption at lower levels, while the Funding Rate remains slightly positive at 0.0002%, reflecting neutral-to-slightly-bullish sentiment among perpetual traders without excessive leverage buildup. Notably, the lack of bearish divergence between price and RSI during recent bounces suggests the recovery attempt has legitimate backing rather than being purely speculative.
BTC Dominance & Market Sentiment
BTC.D currently sits at 54.06%, showing a sustained elevation that typically correlates with risk-off behavior in the crypto markets as capital flows toward Bitcoin as a relative safe haven. USDT.D at 6.98% has remained elevated, indicating continued caution among market participants with significant stablecoin positioning awaiting clearer directional signals. The combination of elevated BTC dominance and stablecoin dominance suggests the broader altcoin market, including ETH, faces headwinds in terms of capital allocation, and any sustainable ETH rally would likely require either a Bitcoin rally that lifts all assets or a rotation event where BTC.D begins declining as capital flows back into major altcoins.
Risk Scenarios
- Bullish case: A decisive daily close above $2,400 with confirmation from volume expansion would validate the recovery structure and target the $2,450-$2,500 zone initially, with extended targets toward $2,550-$2,600 where the declining EMA200 resistance awaits. Supportive conditions would include RSI maintaining above 60 on the daily chart, continued OBV accumulation, and preferably a decline in BTC.D indicating renewed altcoin appetite.
- Bearish case: Rejection at current levels or failure to hold above $2,350 would expose the $2,300-$2,330 support cluster, and a breakdown below this zone on significant volume would likely trigger cascade selling toward $2,200 and potentially retest the $2,000 psychological level. Such a scenario would be confirmed by bearish MACD crossovers on the 4-hour and daily charts, declining OBV, and continued elevation in both BTC.D and USDT.D.
Outlook
Ethereum is positioned at a critical juncture where short-term technicals show improving momentum, but higher timeframe structure and market breadth indicators suggest caution is warranted. The immediate 24-48 hours will be defined by ETH’s ability to sustain trading above $2,350 and challenge the $2,400 resistance with conviction—a successful breach would shift the near-term bias bullish and attract momentum traders. Conversely, failure to hold above the $2,330-$2,350 support zone would likely reinvigorate sellers and pressure the asset back toward the $2,200s. Given the compressed Bollinger Bands across all timeframes and neutral-to-positive momentum indicators, traders should prepare for increased volatility in the coming sessions, with position sizing adjusted for potential whipsaw action until a clear directional break confirms the next leg of the trend.
Charts