Ethereum Daily Analysis: Ethereum Below All EMAs, Bollinger Band Resistance at $1,804
Market Overview
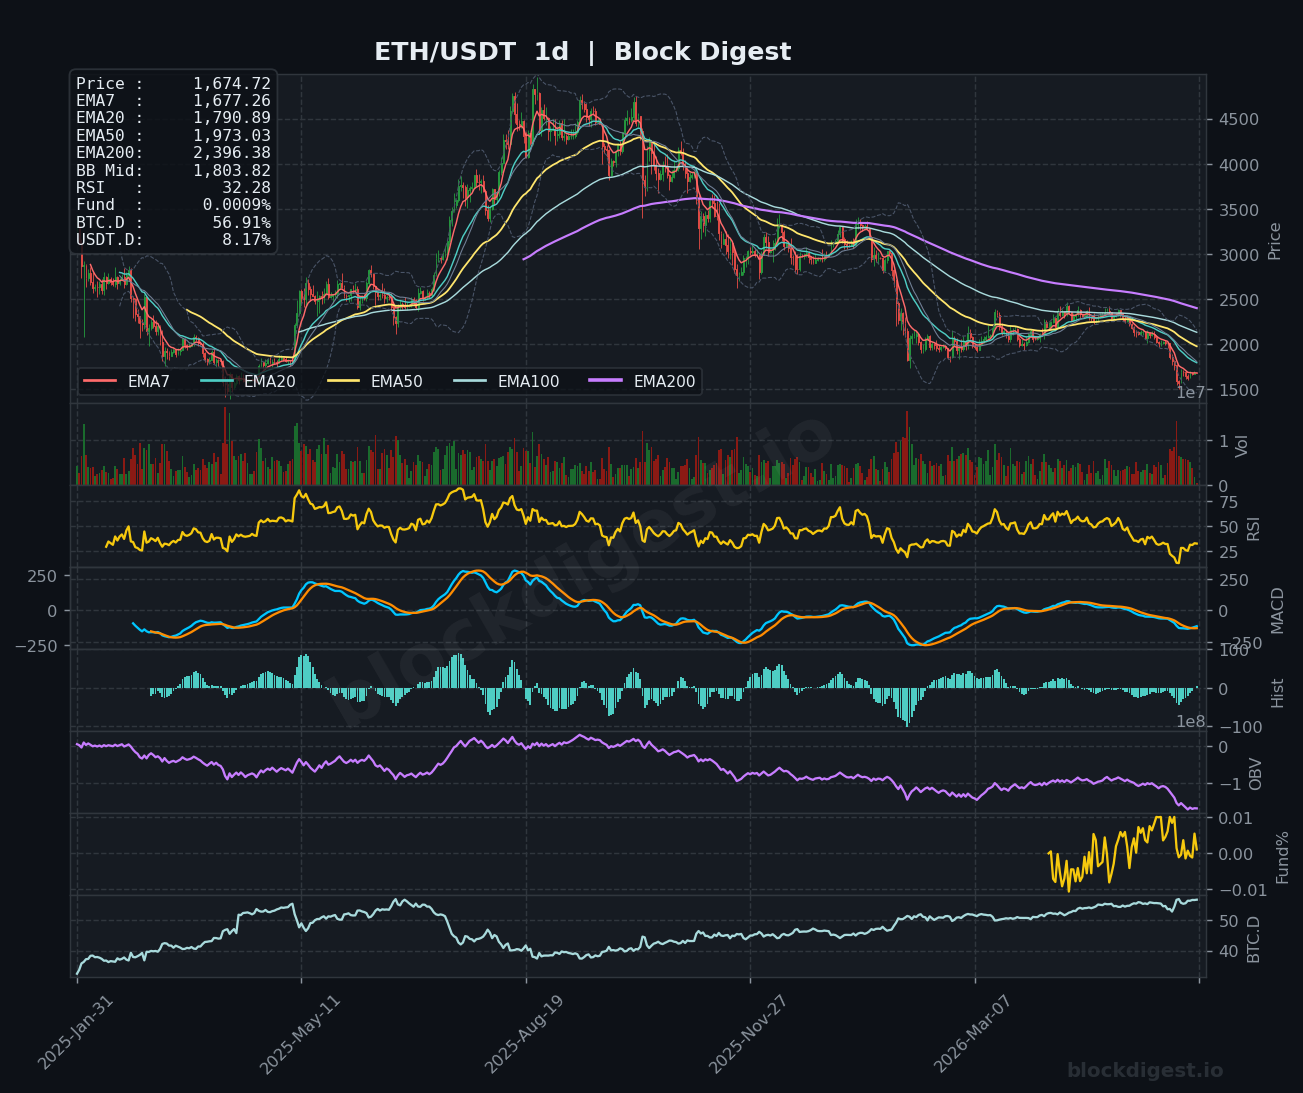
Ethereum is trading at $1,674.69 as of June 14, 2026, caught in a deeply entrenched bearish structure across all timeframes. Price sits well below every major EMA on the daily chart — with the EMA7 at $1,677.26, EMA20 at $1,790.89, EMA50 at $1,973.03, and the EMA200 towering at $2,396.38 — painting a picture of sustained macro selling pressure. The daily Bollinger Band midline at $1,803.82 acts as overhead resistance, with price hugging the lower band region after a prolonged downtrend from the 2025 highs above $4,500. The dominant daily trend remains unambiguously bearish, with ETH now down approximately 9.8% year-to-date and trading nearly 56% below its cycle peak.
Multi-Timeframe Confluence
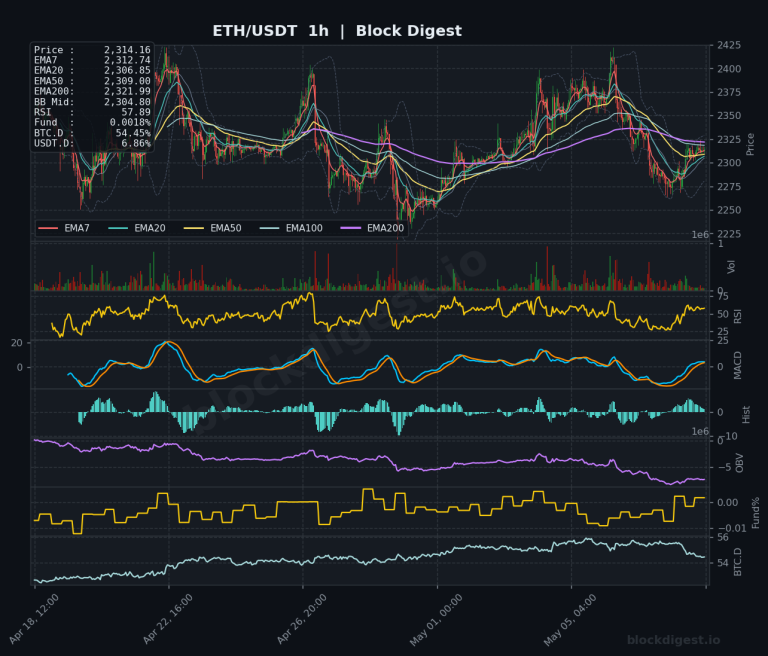
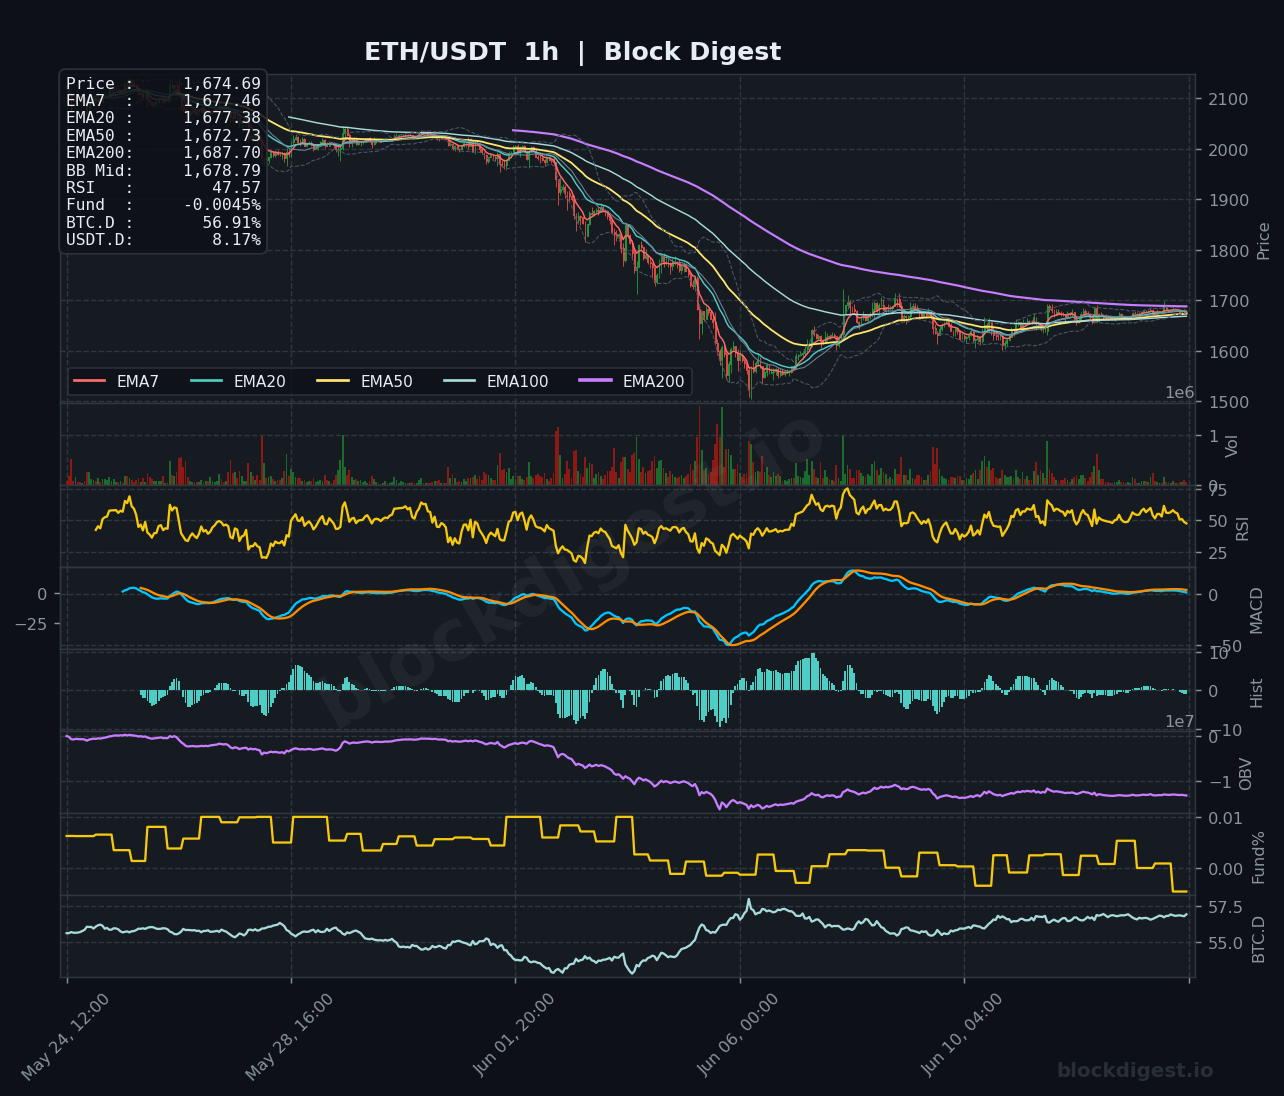
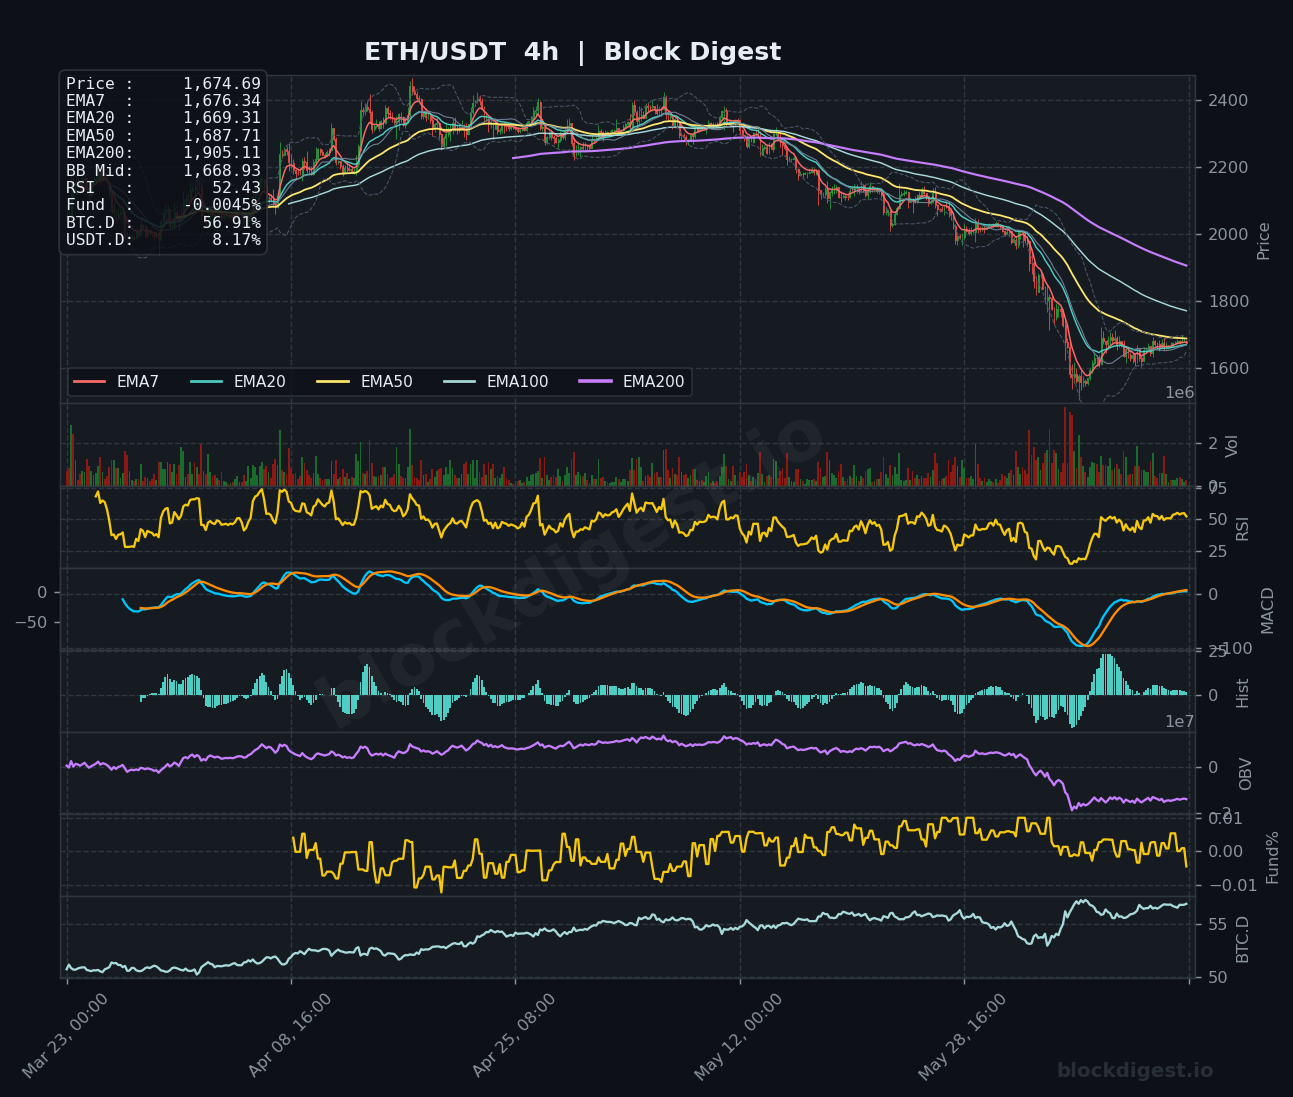
On the 1-hour chart, price is compressing tightly around the short-term EMAs — EMA7 ($1,677.46), EMA20 ($1,677.38), and EMA50 ($1,672.73) — suggesting a period of consolidation after a sharp capitulation move that bottomed near $1,500. The 4-hour chart shows the EMA7 ($1,676.34) and EMA20 ($1,669.31) beginning to curl upward, though price remains firmly below the 4H EMA50 ($1,687.71) and the 4H EMA200 ($1,905.11), confirming that any near-term recovery is a counter-trend move within a larger bear structure. Across all three timeframes, the $1,680–$1,690 zone represents immediate confluent resistance where short-term EMAs and the 4H EMA50 converge, making this a critical level to reclaim for bulls.
Key Levels to Watch
- Resistance: $1,687–$1,690 — Cluster of 1H EMA200, 4H EMA50, and prior consolidation resistance; a decisive close above this zone is needed to shift short-term momentum bullish.
- Resistance: $1,790–$1,803 — Daily EMA20 and daily Bollinger Band midline; reclaiming this level would signal a meaningful structural recovery and likely attract more buyers.
- Resistance: $1,905–$1,975 — 4H EMA200 ($1,905.11) and daily EMA50 ($1,973.03) form a major supply zone; this region would need to be cleared to shift the intermediate trend.
- Support: $1,640–$1,650 — Recent consolidation floor and near-term demand zone identified following the capitulation low; initial line of defense for bulls.
- Support: $1,540–$1,560 — The approximate capitulation low visible on the 1H chart; a retest of this area would represent a significant test of market conviction.
- Support: $1,480–$1,500 — Structural lows and psychological round number; a breach here would signal continuation of the macro downtrend with limited near-term support below.
Momentum & On-Chain Signals
The daily RSI at 32.28 is approaching oversold territory but has not yet confirmed a reversal signal, hovering just above the critical 30 threshold where historically meaningful bounces have emerged. The 4H RSI at 52.43 has recovered meaningfully from its lows, suggesting short-term momentum is constructive, while the 1H RSI at 47.57 reflects neutral-to-slightly-bearish conditions with no strong directional conviction. The daily MACD remains in negative territory with the signal line below zero, though the histogram shows early signs of compression — a bullish crossover has not yet materialized. OBV on both the daily and 4H charts remains in a clear downtrend, confirming ongoing distribution rather than accumulation, which undermines the credibility of the current bounce. Funding rates are fractionally negative at -0.0045%, indicating that short positioning is marginally dominant — a condition that could fuel a short squeeze if price breaks above $1,690.
BTC Dominance & Market Sentiment
BTC dominance sits at 56.91% — an elevated reading that historically correlates with altcoin underperformance and capital concentration in Bitcoin rather than broader market participation. USDT dominance at 8.17% reflects a meaningful level of sidelined capital in stablecoins, which could theoretically re-enter risk assets but currently signals continued risk-off positioning. For ETH specifically, elevated BTC.D is a headwind, as capital rotation into altcoins typically requires BTC.D to peak and roll over — a reversal that is not yet evident in the charts.
Risk Scenarios
- Bullish case: A sustained break and 4H close above $1,690, combined with declining BTC dominance and improving OBV, would open a path toward the $1,790–$1,803 daily EMA20 zone, with extension potential toward $1,900 if the broader market shifts risk-on. Continued record Ether ETF inflows, as seen recently with $2.12 billion in weekly flows, could catalyze the demand-side push needed to absorb overhead supply.
- Bearish case: Failure to hold $1,640 on the 1H/4H timeframe, accompanied by a daily RSI breakdown below 30 and further OBV deterioration, would expose the $1,540–$1,560 capitulation lows and potentially the $1,480–$1,500 structural support region. A resurgence in BTC dominance above 57.5% would further compound downside pressure on ETH.
Outlook
The near-term bias for ETH is cautiously neutral with a bearish lean, as the dominant macro structure remains firmly downward despite short-term stabilization around the $1,675 level. The key trigger to watch over the next 24–48 hours is whether price can convincingly reclaim and hold the $1,687–$1,690 confluence zone — failure to do so reinforces distribution, while a clean break higher opens the door to a relief rally toward $1,790. The record-breaking Ether ETF inflows are a meaningful fundamental tailwind, but technical distribution signals on OBV and the deeply suppressed daily RSI suggest the market has not yet found a durable bottom. Until the daily MACD delivers a bullish crossover and OBV begins trending upward, any rally should be treated as a counter-trend move within an ongoing bear phase rather than the start of a new uptrend.
Disclaimer: This analysis is for informational purposes only and does not constitute financial advice. Cryptocurrency markets are highly volatile and unpredictable. All trading decisions should be made based on your own research and risk tolerance. Block Digest is not responsible for any financial losses incurred as a result of acting on this content.